Stacking non-nested groups of repeating columns in Power Query
There are plenty examples on how to unpivot nested tables (some brilliant ones can be found here and here). But what if a table we need to make flat has no nested headers for repeating groups of columns? It ought to be nested, but it doesn’t. And standard unpivoting methods then do not works then.
Stacking (or unpivoting) non-nested groups of columns is not a common task, but sometimes it appears. It could be due to bad constructed software report or hand-made user table in Excel or web-page scrapping. But in some case, we meet with this horror.
Once a client asked me to help with intelligence on his database. Of course, I agreed. But when I saw this “database” which he proudly presented to me, I was glad that the customer does not see my face and did not hear any comments passed my lips.
There was an Excel worksheet with more than 100 (one hundred) columns with more than 10000 rows, with all diversity of data in it. About 80 columns was in repeating groups, named “Date”, “Sum”, “Date”, “Sum” …. “Date”, “Sum” – without nesting or grouping.
For some reasons, when a VBA solution couldn’t be applied (especially if you work in Power BI and want to pull data in it without voodoo dances), the only way to flatten this table was using the Power Query for Excel 2010-2013 (or “Get Data” in Power BI, “Get & Transform” in Excel 2016).
Working on that task I discovered that there are at least four ways of doing it. You can choose the method that best suits your case.
As-is and to-be
What we have in source and what we need to get shown on the picture below:
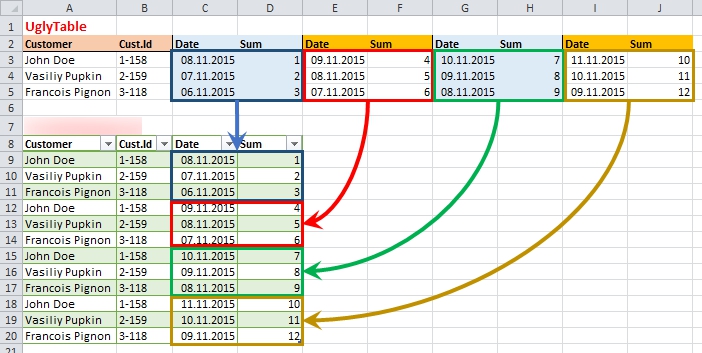
The source and the target: not so easy…
Actually we need to stack repeating groups one under other, keeping in place the common data from first columns.
For demonstration purposes I prepared a sample workbook, where source is in named range “UglyTable” (I was ruthless). You can download it here.
Classical stacking (by appending queries)
The first solution (looking obvious) for this task that I found after some googling and thinking was using of “append queries” method.
Indeed, if we want to place one table below another with the same structure, we need to append. So the algorithm for this method is in next steps:
- Extract first group of columns (included common columns and first repeating group of columns).
- Extract second group (included common columns and second repeating group of columns).
- Make sure that second group has the same column names as first.
- Repeat steps 2 and 3 for all paired columns groups…
- Append all extracted tables.
Here is a simple code in M language to perform this transformation:
|
1 2 3 4 5 6 7 8 9 10 11 12 13 14 |
let Source = Excel.CurrentWorkbook(){[Name="UglyTable"]}[Content], Promoted = Table.PromoteHeaders(Source), Group1 = Table.SelectColumns(Promoted,{"Customer", "Cust.Id", "Date", "Sum"}), Group2 = Table.SelectColumns(Promoted,{"Customer", "Cust.Id", "Date_1", "Sum_2"}), Part2 = Table.RenameColumns(Group2,{{"Date_1", "Date"}, {"Sum_2", "Sum"}}), Group3 = Table.SelectColumns(Promoted,{"Customer", "Cust.Id", "Date_3", "Sum_4"}), Part3 = Table.RenameColumns(Group3,{{"Date_3", "Date"}, {"Sum_4", "Sum"}}), Group4 = Table.SelectColumns(Promoted,{"Customer", "Cust.Id", "Date_5", "Sum_6"}), Part4 = Table.RenameColumns(Group4,{{"Date_5", "Date"}, {"Sum_6", "Sum"}}), Result = Table.Combine({Group1,Part2,Part3,Part4}), ChType = Table.TransformColumnTypes(Result,{{"Customer", type text}, {"Cust.Id", type text}, {"Date", type date}, {"Sum", type number}}) in ChType |
Although it can be done with UI on all stages, this method has a lot of manual work. When performing it with UI only, you need to create as much queries as number of repeating groups you have, and then append queries one by one in corresponding number of steps.
In sample code above I shortened this steps and place it in one query, but it takes a lot of editing.
And the main lack of this method is that whether number of groups changed, you need to add/remove some queries and edit last step (appending). So this solution could be made if you sure that table’ structure will be the same all time long.
Merging columns
As I was dissatisfied with the first method, I resumed googling and then asked Gil Raviv (a Microsoft fellow who runs Get & Transform Data in Excel 2016 blog on TechNet) in Twitter. He supposed another solution, based on a little tricky instrument he used when unpivoting nested tables.
Here the steps for this method:
- Merge first pair of grouped columns with some delimiter (e.g. merge “Date” and “Sum” columns
- Repeat this step for each pair of columns shall be stacked.
- Unpivot all of these merged columns.
- Split unpivoted values by delimiter used.
- Make clean-up in table and make-up data.
I love this trick – it is really interesting and not obvious. The idea is simple: as we cannot just unpivot this table because we have more than one column of the same data, we merge these columns in one, and then we get a pack of columns that can be unpivoted in usual way. And all we need then is just split data to separated columns.
Here is the code of this query:
|
1 2 3 4 5 6 7 8 9 10 11 12 13 14 |
let Source = Excel.CurrentWorkbook(){[Name="UglyTable"]}[Content], Promoted = Table.PromoteHeaders(Source), Merge1 = Table.CombineColumns(Table.TransformColumnTypes(Promoted, {{"Date", type text}, {"Sum", type text}}, "en-US"),{"Date", "Sum"},Combiner.CombineTextByDelimiter("=", QuoteStyle.None),"Merged1"), Merge2 = Table.CombineColumns(Table.TransformColumnTypes(Merge1, {{"Date_1", type text}, {"Sum_2", type text}}, "en-US"),{"Date_1", "Sum_2"},Combiner.CombineTextByDelimiter("=", QuoteStyle.None),"Merged2"), Merge3 = Table.CombineColumns(Table.TransformColumnTypes(Merge2, {{"Date_3", type text}, {"Sum_4", type text}}, "en-US"),{"Date_3", "Sum_4"},Combiner.CombineTextByDelimiter("=", QuoteStyle.None),"Merged3"), Merge4 = Table.CombineColumns(Table.TransformColumnTypes(Merge3, {{"Date_5", type text}, {"Sum_6", type text}}, "en-US"),{"Date_5", "Sum_6"},Combiner.CombineTextByDelimiter("=", QuoteStyle.None),"Merged4"), UnpivotOther = Table.UnpivotOtherColumns(Merge4, {"Customer", "Cust.Id"}, "Attribute", "Value"), RemAttr = Table.RemoveColumns(UnpivotOther,{"Attribute"}), SplitValues = Table.SplitColumn(RemAttr,"Value",Splitter.SplitTextByDelimiter("=", QuoteStyle.Csv),{"Value.1", "Value.2"}), RenameColumns = Table.RenameColumns(SplitValues,{{"Value.1", "Date"}, {"Value.2", "Sum"}}), ChType = Table.TransformColumnTypes(RenameColumns,{{"Customer", type text}, {"Cust.Id", type text}, {"Date", type datetime}, {"Sum", type number}}), ExtrDate = Table.TransformColumns(ChType,{{"Date", DateTime.Date}}) in ExtrDate |
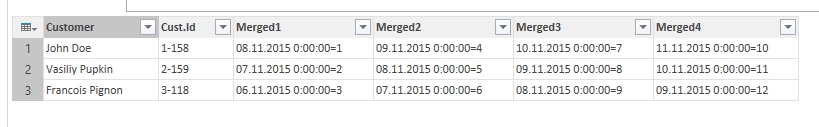
Columns merged and ready to unpivot
Actually this method could be performed with UI only, there are no need to manually edit any string in code editor. And it is fast when refreshing, too.
But this approach also has a limitation, the same as for previous method: if number of columns changed, you need to manually add or remove steps of columns merging. And if number of groups of columns is big, it is kind of boring and need a lot of attention when you manually select two columns and merge, then repeat, then repeat…
Grouping by indexes
This approach I do not peeped and “invented” myself (although I’m sure I’m not the first one), so I proudly present it here.
- Promote headers (note that as columns headers initially has same names, Power Query adds numeric indexes to them because columns in a table should have different names).
- Use “Unpivot other columns” option on source table (all except common columns). When we look at result, we can see that our data from “repeating columns” become “repeating rows”:
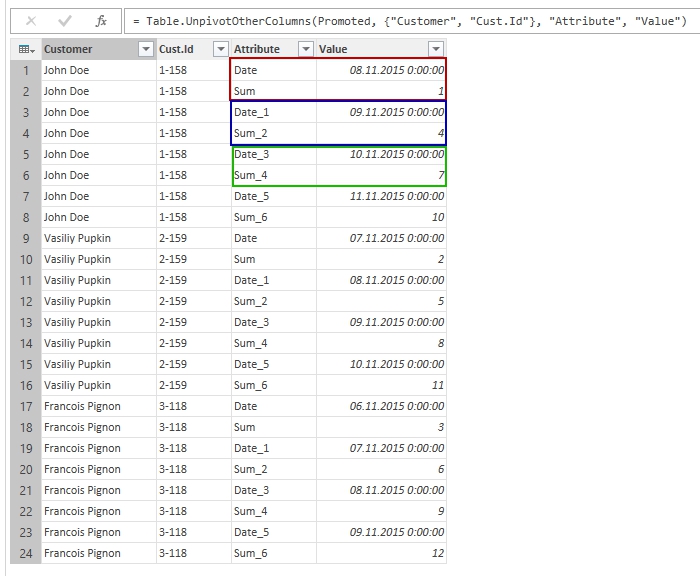
Paired columns unpivoted and became paired rows
Column names moved to “Attribute” column. If they will be the same each time (“Date”, “Sum”) and has not index added to name by Power Query, it will be very easy to pivot this table by these names. Unfortunately, we can’t.
So let us use some trick with index column:
- Remove “Attribute” column
- Add “Index” column
- Add custom column: use Add column – Standard – Integer Divide (divide by 2). We’ve got additional column with the same index for each pair of rows.
- Add another custom column: Add column – Standard – Modulo (divide by 2). We’ve got a column where each row has repeating index 1 or 0 – it will help us to group them.
- Now we can remove “Index” column

Ready for pivoting
- Unpivot “Inserted Modulo” column (select “Value” column as values and do not aggregate).
- That’s almost all:
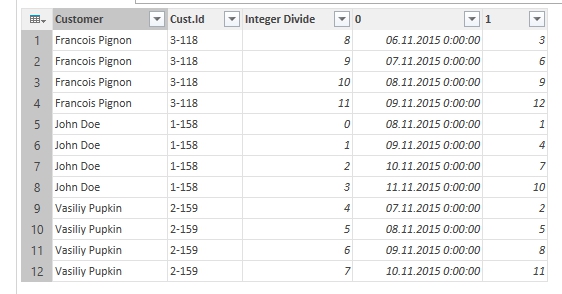
Almost there
- Now we only need to remove “Integer Divide” column and rename columns “0” and “1” to “Date” and “Sum”, and apply appropriate data types.
Here is the full M code of this method from sample workbook:
|
1 2 3 4 5 6 7 8 9 10 11 12 13 14 15 |
let Source = Excel.CurrentWorkbook(){[Name="UglyTable"]}[Content], Promoted = Table.PromoteHeaders(Source), UnpivotDateSum = Table.UnpivotOtherColumns(Promoted, {"Customer", "Cust.Id"}, "Attribute", "Value"), RemAttr = Table.RemoveColumns(UnpivotDateSum,{"Attribute"}), AddIndex = Table.AddIndexColumn(RemAttr, "Index", 0, 1), IntDivide = Table.AddColumn(AddIndex, "Integer Divide", each Number.IntegerDivide([Index], 2), Int64.Type), InsertModulo = Table.AddColumn(IntDivide, "Inserted Modulo", each Number.Mod([Index], 2), type number), RemIndex = Table.RemoveColumns(InsertModulo,{"Index"}), PivotModulo = Table.Pivot(Table.TransformColumnTypes(RemIndex, {{"Inserted Modulo", type text}}, "en-US"), List.Distinct(Table.TransformColumnTypes(RemIndex, {{"Inserted Modulo", type text}}, "en-US")[#"Inserted Modulo"]), "Inserted Modulo", "Value"), RemoveGroups = Table.RemoveColumns(PivotModulo,{"Integer Divide"}), RenameColumns = Table.RenameColumns(RemoveGroups,{{"0", "Date"}, {"1", "Sum"}}), ChType = Table.TransformColumnTypes(RenameColumns,{{"Date", type date}, {"Sum", Int64.Type}, {"Customer", type text}, {"Cust.Id", type text}}) in ChType |
This method could be applied on tables with any number of paired columns. This is main difference form first two approaches: it doesn’t matter whether number of columns increase or decrease, after unpivoting we will work with rows.
Grouping to Records
The first time I saw this trick was on Power Query TechNet forum, when Ehren, another good Microsoft fellow, used it to collect values from one column when grouping by values in another. I adopt it to this case, and it works perfectly.
I love this approach for its use of hidden treasures of M language. The algorithm used is simple, but very interesting. The first five steps is the same as in previous method (only difference that we will not add custom column but transform “Index” column):
- Promote headers
- Unpivot al columns except common columns. Now our repeating columns becomes repeating groups of rows.
- Add “Index” column
- Transform “Index” column with use of Number.IntegerDivide function. This can be done manually or with UI: Select “Index” column, go to Transform – From Number – Standard – Divide (Integer). Our goal is to get whole number of “Index”/2 (as we have two repeating columns).
- Now each pair of row has the same corresponding number.
- And here is some magic: now we’ll group rows by this modified “Index”, but as an aggregate function we’ll use non-standard Records.FromList function. It is not in list of functions available in dialog window, so it should be entered manually or by editing of other aggregate function code:
1Grouping = Table.Group(IntDivide,{"Index", "Customer","Cust.Id"}, {{"Values", each Record.FromList([Value],{"Date","Sum"}), type record}})
How this formula actually works here is really interesting:- it selects rows of one group
- then from contents of column [Value] of these selected rows…
- it creates a Record with two fields: “Date” and “Amount”, taking them sequentially “top-down” from the selected rows.
And what we really have as a result of aggregation is a value of record type for each of grouped rows.
The Record.FromList function itself allows to create a Record from list of values and a list of corresponding fileds names (as a second argument this function can take a value of record type, which allows to apply data types right inside function).
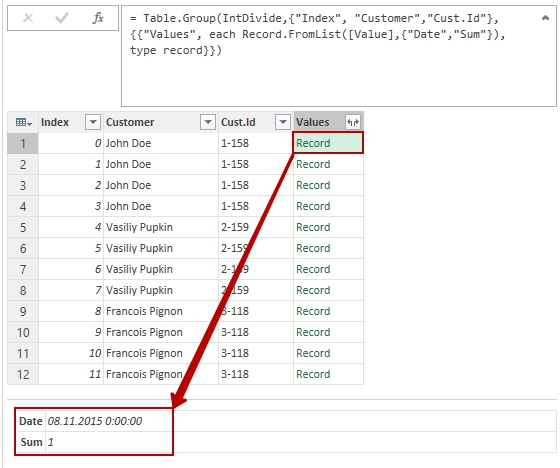
Values from grouped rows collected into Record
- Now we can remove “Index” and expand “Values” column by clicking on double arrow right to column name, and we got the table we need!
- Make sure all data has correct type assigned, close & load.
Here is full M code:
|
1 2 3 4 5 6 7 8 9 10 11 12 13 |
let Source = Excel.CurrentWorkbook(){[Name="UglyTable"]}[Content], Promoted = Table.PromoteHeaders(Source), UnpivotDateSum = Table.UnpivotOtherColumns(Promoted, {"Customer", "Cust.Id"}, "Attribute", "Value"), RemAttr = Table.RemoveColumns(UnpivotDateSum,{"Attribute"}), AddIndex = Table.AddIndexColumn(RemAttr, "Index", 0, 1), IntDivide = Table.TransformColumns(AddIndex, {{"Index", each Number.IntegerDivide(_, 2), Int64.Type}}), Grouping = Table.Group(IntDivide,{"Index", "Customer","Cust.Id"}, {{"Values", each Record.FromList([Value],{"Date","Sum"}), type record}}), RemIndex = Table.RemoveColumns(Grouping,{"Index"}), ExpandValues = Table.ExpandRecordColumn(RemIndex, "Values", {"Date", "Sum"}, {"Date", "Sum"}), ChangeType = Table.TransformColumnTypes(ExpandValues,{{"Customer", type text}, {"Cust.Id", type text}, {"Date", type date}, {"Sum", Int64.Type}}) in ChangeType |
As I told before, this approach is very interesting and useful for understanding some M language concepts. Also for this “group to records” trick doesn’t matter, how many columns we will unpivot and group: 4, 8, 98, etc., so this approach is more versatile than first two.
Resume
Every of these methods is suitable for different cases, but I prefer last two: they are more versatile and could be used on table of any size.
If you not familiar with Power Query “M” language, it is supposed to use third method: modifying indexes for grouping and pivoting.
But “grouping to records” method is more technological and fast, so if you don’t afraid to edit M code, this is recommended approach.
I tested all of four methods on the table with 30 pairs of Date-Sum columns, with 7000 of rows. You can see average results of performance I got:
- Appending queries: 16 sec
- Merging Columns: 8 sec
- Group by indexes: 14 sec
- Group to Records: 6,7 sec
I still don’t sure whether these results are really average. Try it yourself too.
Follow me:Share this: