A joint venture by Russian and Indian technology professionals aims to be the Youtube of data. Knoema which launched last month and is marketed by its creators as "your personal knowledge highway", combines data-gathering with presentation to create an online bank of socioeconomic and environmental data-sets.
The website's homepage shows a selection of the topics on which Knoema has collected data. Among the categories are broad fields such as commodities and energy, but also more specialised collections including sexual exploitation and biofuels.
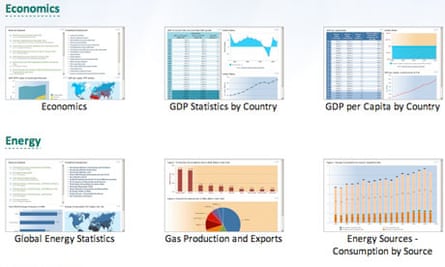
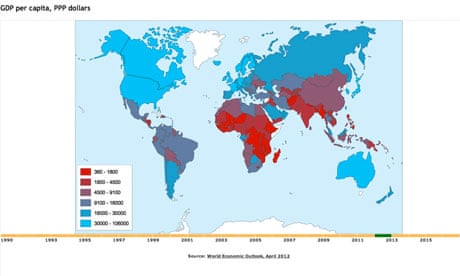
Within each subject-area you can find one or more 'dashboards' - simple yet comprehensive presentations of data for a given topic, with all source-material documented. Knoema also provides choropleth maps for many of the datasets where figures are given for geographical areas.
'Commodity passports' are another format in which Knoema offers some of its data. These give a detailed breakdown of production, consumption, imports, exports and market prices for a diverse range of products and materials including apples, cotton and natural gas.
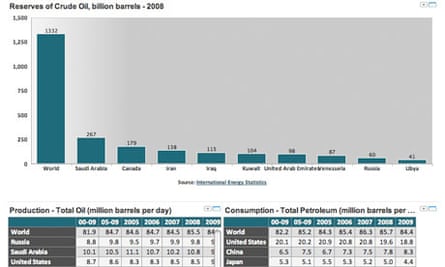
In addition to covering broad themes, Knoema also works with specific studies and institutions to create tailor-made databases. This group of healthcare data-sets, for example, was created specially for a course at Columbia Business School.
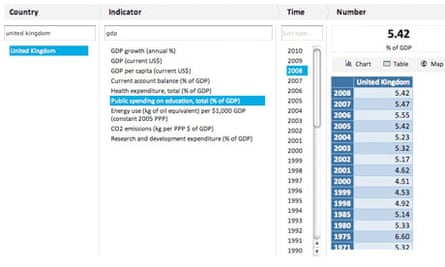
There is also a tool for carrying out searches for data defined either by country, year or indicator. This allows for quick comparisons between related figures without having to search for a new data-set each time.
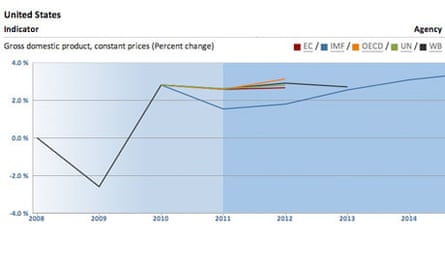
One of the most interesting areas of the site is an inbuilt application which monitors economic forecasting. For each of seven major economies you can compare forecasts from bodies such as the OECD and IMF for any of several economic indicators, and see how they differ from one another.
Knoema is also adding quizzes as a more interactive way of presenting data. Each question relates to a topic on which Knoema has gathered statistics, and after answering you are shown not only the correct answer, but also the data that backs it up.
The team behind Knoema say that the addition of interactive data-based games and customizable visualisation tools are their two current priorities at the moment.
Data summary
Download the data
DATA: download the full spreadsheet
More data
More data journalism and data visualisations from the Guardian
World government data
Search the world's government data with our gateway
Development and aid data
Search the world's global development data with our gateway
Can you do something with this data?
Flickr Please post your visualisations and mash-ups on our Flickr group
Contact us at data@guardian.co.uk
Comments (…)
Sign in or create your Guardian account to join the discussion