
Observability at Twitter: technical overview, part I
Friday, 18 March 2016
The Observability Engineering team at Twitter provides full-stack libraries and multiple services to our internal engineering teams to monitor service health, alert on issues, support root cause investigation by providing distributed systems call traces, and support diagnosis by creating a searchable index of aggregated application/system logs. These are the four pillars of the Observability Engineering team’s charter:
We fulfill this charter for all applications and services running in our owned and operated data center as well as acquired properties that are deployed in external public clouds, such as Amazon AWS and Google Compute.
Twitter services handle a large number of tweets every day. Responsible for providing visibility into the services powering Twitter, our observability services are some of the largest scale internal systems. The request volume and data size on disk have grown tremendously since we last discussed this in a blog post two years ago. Today, our time series metric ingestion service handles more than 2.8 billion write requests per minute, stores 4.5 petabytes of time series data, and handles 25,000 query requests per minute.
This blog is the first in a two-part series. It covers our architecture, metrics ingestion, time series database, and indexing services.
Architecture
Our system architecture has also changed quite a bit over the past two years . Here is our current architecture:
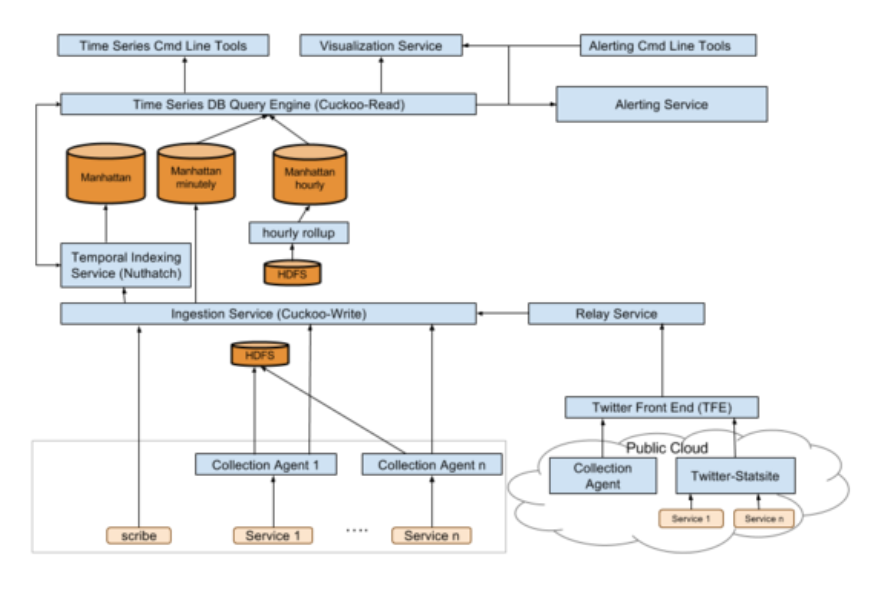
Metric ingestion
Metrics are pushed into the observability infrastructure in three ways. Most Twitter services run a Python collection agent to push metrics to the Time Series Database & HDFS. The Observability team also supports a slightly modified version of a common StatsD server, Statsite, that sends metrics to our main time series metrics ingestion service, Cuckoo-Write, or other ingestion services of choice like Carbon. Finally an HTTP API is provided for scenarios where ease of ingestion is more important than performance. With this breadth of options we are able to support a wide variety of customers from Twitter servers running in Twitter data-centers to acquired companies running in external data-centers like AWS that want to take advantage of the centralized observability stack.
Time series database
All Twitter metrics are sent and stored in Twitter’s time series database, Cuckoo. Cuckoo is actually two services, Cuckoo-Read and Cuckoo-Write, and backed by Twitter’s distributed key-value storage system, Manhattan. Initially Cuckoo-Read and Cuckoo-Write were one service, but they were split into two due to the different nature of the read and write workload, so that each service could be tuned for their specific task.
Cuckoo-Write is the ingestion point for metrics, and exposes an API to which metrics are written. In addition to storing these metrics in Manhattan, Cuckoo-Write also ensures the metrics are sent to the appropriate services for indexing. Data is stored at minutely granularity for two weeks, and at hourly granularity forever.
The time series database query engine, Cuckoo-Read, handles time series data queries from our alerting and dashboarding systems as well as user initiated ad-hoc query traffic. Queries are specified in the Cuckoo query language, CQL.
CQL query engine
Given the scale of our data set, serving all queries with low latency and high availability is technically very challenging. More than 36 million queries are executed every day in real time, and our engineers rely on these queries and the monitoring system to meet their service SLA.
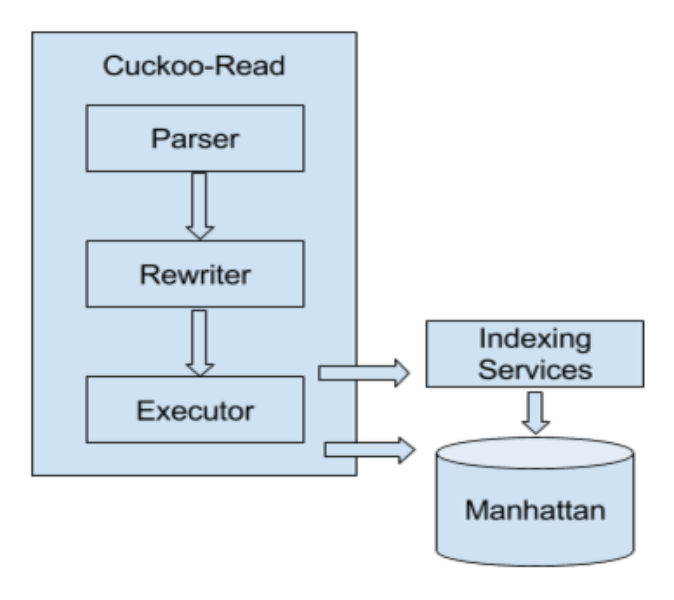
CQL queries are supported natively in Cuckoo-Read. The query engine is composed of three components: parser, rewriter, and executor. The parser is responsible for parsing query strings into internal Abstract Syntax Trees (ASTs); the rewriter then processes AST nodes and replaces some of them with simpler calculations to improve performance; finally the executor fetches data from downstream services and calculates the output.
In CQL, time series are uniquely identified by tuple of service, source, and metric. This structure not only maps directly to how services are organized but also allows us to simplify data partitioning in storage.
Time-based aggregation
Our time series database supports data aggregation based on service host group or time granularity of hour and day. In the past, we used Manhattan counters to accomplish time-based aggregation. We observed two common access patterns in hourly/daily data that helped us redesign our aggregation pipeline. Most notably two are:
Given these observations, we made a few design choices for the new aggregation pipeline, deciding to:
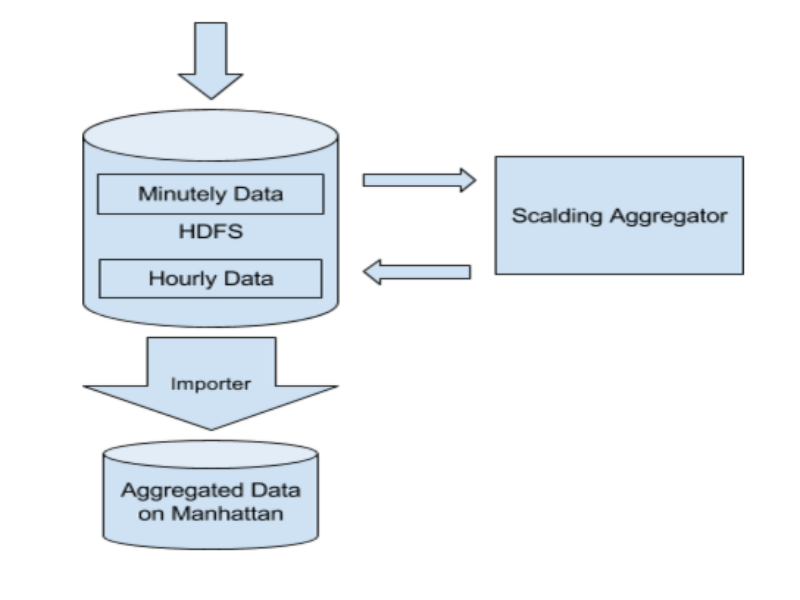
With the new pipeline, we achieved substantial efficiency gain in lower hardware cost. Furthermore, we improved our system reliability by reducing the load on our time series database.
Temporal set indexing service
Temporal set indexing service, Nuthatch, keeps track of metrics metadata and maintains a map of metric keys to members sets (e.g., the map from host group to individual host) as well as timestamps. The browsing tool below shows one use case of the data. Engineers can quickly navigate the services, sources, and metrics available in services.
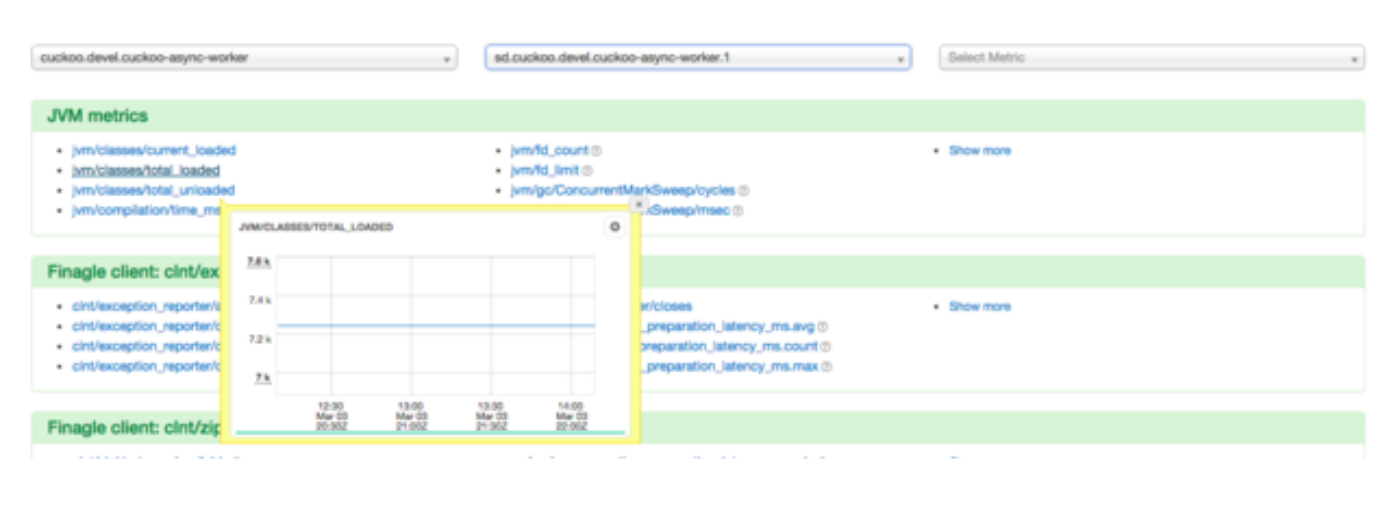
More importantly, Nuthatch provides membership resolution and glob query support for CQL query engine so that engineers can query membership for a given key and then use functions, like sum() and avg(), to aggregate all time series together. In the following query example, Nuthatch is responsible for identifying all the sources for nuthatch.router service as well as the metric keys in the scope of “/update/request/” and providing the data for CQL query engine to fetch specific time series data set from storage.
![]()
The challenges for the Nuthatch service come from the huge amount of the incoming metric sets to be indexed and the members requests from CQL query engine. A general purpose indexing or caching engine would not work well in this scenario because the temporal set data has a few unique properties:
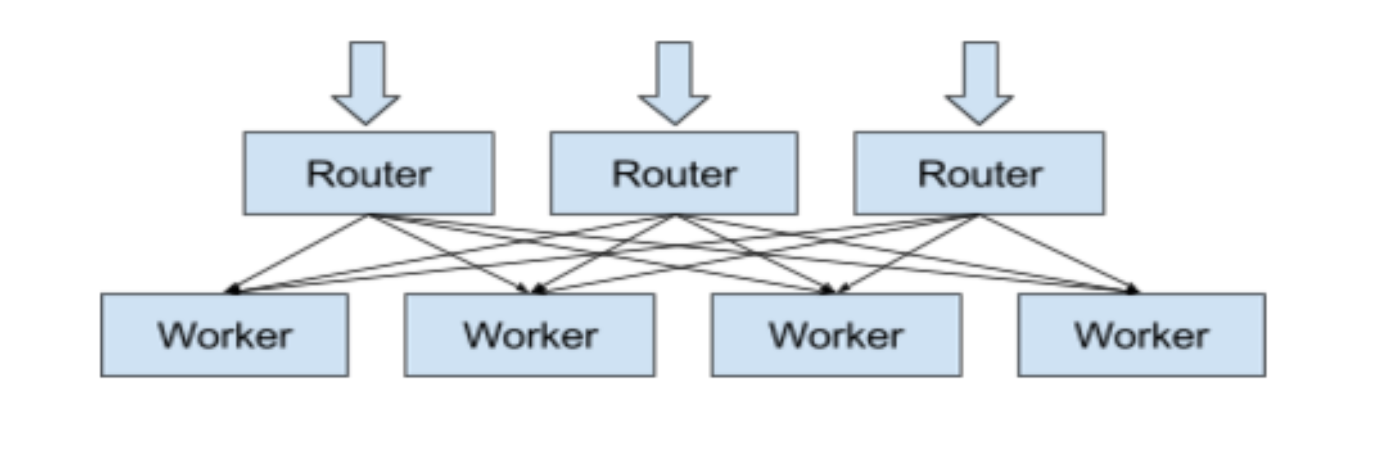
Nuthatch uses an in-process cache to reduce the number of storage operations in order to improve performance and reduce cost. In this design, a stateless router service is responsible for accepting incoming requests and deciding which worker shards the requests should be forwarded to using consistent hashing. A set of dedicated worker shards, each with its own in-memory cache, handles requests by reading from either cache or Manhattan storage.
Acknowledgements
Observability Engineering team: Anthony Asta, Jonathan Cao, Hao Huang, Megan Kanne, Caitie McCaffrey, Mike Moreno, Sundaram Narayanan, Justin Nguyen, Aras Saulys, Dan Sotolongo, Ning Wang, Si Wang
Did someone say … cookies?
X and its partners use cookies to provide you with a better, safer and
faster service and to support our business. Some cookies are necessary to use
our services, improve our services, and make sure they work properly.
Show more about your choices.