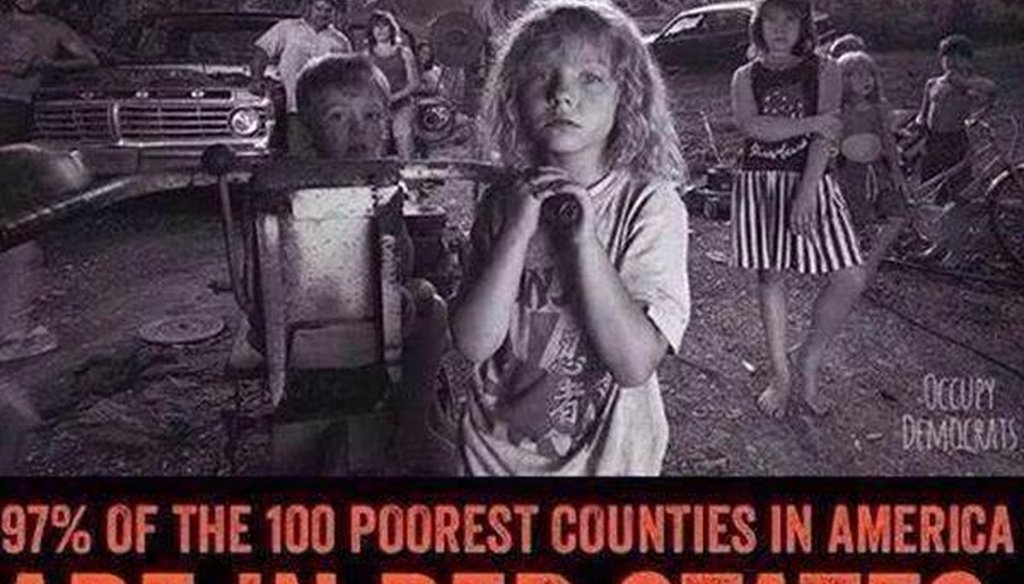
"97 percent of the 100 poorest counties in America are in red states."


Our only agenda is to publish the truth so you can be an informed participant in democracy.
We need your help.
We checked to see whether this meme circulating on social media was accurate.

A meme circulating on Twitter and other social media recently caught our eye. Created by the liberal group Occupy Democrats, it said, "97 percent of the 100 poorest counties in America are in red states. But tell me again how Republican policies grow the economy?"
This was a variation on a few memes we’ve checked previously -- that nine out of the 10 poorest states are red states (we rated this Mostly True) and that Republican-leaning states get more in federal dollars than they pay in taxes (also Mostly True).
While the meme’s suggestion that "Republican policies" are causing poverty is too subjective a question to be fact-checked, we decided to take a closer look at the set-up to the claim -- that "97 percent of the 100 poorest counties in America are in red states."
First, we’ll explain our methodology.
To determine the nation’s 100 poorest counties, we downloaded data from the U.S. Census Bureau’s American Community Survey. This data covers five years ending in 2012, and includes more than 3,000 counties and county equivalents (such as Louisiana parishes). This data enabled us to rank-order these jurisdictions based on two commonly used measurements -- median income, and percentage of the population in poverty.
As for determining whether a state is "red" or "blue," we decided to define it by whether the state voted for President Barack Obama or Mitt Romney in 2012. This means we counted North Carolina and Indiana as red states, since Obama lost them in 2012 after winning them in 2008. (Though either way, the differences would have been marginal.)
So how did the data turn out?
For median income, we found that 95 of the 100 poorest counties were located in red states. Here are the 10 poorest, all of them in red states:
1. Owsley County, Ky.
2. Jefferson County, Miss.
3. Wolfe County, Ky.
4. Brooks County, Texas
5. McCreary County, Ky.
6. Hudspeth County, Texas
7. Hancock County, Tenn.
8. Jackson County, Ky.
9. Clay County, Ky.
10. Holmes County, Miss.
For percentage of residents in poverty, we found that 93 of the 100 poorest counties were in red states.
Here are the 10 with the highest poverty rates, all of them in red states:


1. Shannon County, S.D.
2. Clay County, Ga.
3. East Carroll Parish, La.
4. Sioux County, N.D.
5. Todd County, S.D.
6. Hudspeth County, Texas
7. Holmes County, Miss.
8. Corson County, S.D.
9. Wolfe County, Ky.
10. Humphreys County, Miss.
So there are some differences between the most recent Census data and what the meme said, but they are pretty small. Numerically, we don’t have much to quibble with.
Our bigger question concerns whether it’s significant that a lot of poor counties are located in red states. There’s reason for at least a bit of skepticism.
For starters, the list is dominated by rural areas. Generally speaking, rural areas have a lower cost of living, so the small income you make in a poor, rural Texas county is going to go further than it would if you lived in a poor, urban area like Detroit or Camden, N.J. This raises questions about how comparatively disadvantaged poor Americans are in rural and urban areas.
Also, rural areas are areas where Republicans tend to do well electorally. By contrast, impoverished areas of big cities are big enough population-wise to be balanced by more affluent neighborhoods, and these poor urban areas are often (though not always) in blue states.
It’s also worth pointing out that many of the counties on the list are located in Appalachia, particularly in such states as Kentucky, West Virginia, Mississippi and Georgia. That’s a region that has suffered economically for generations -- long predating the time when Republicans took over from Democrats in most elected offices.
In Appalachia, "it’s clear there’s a regional problem, born of isolation, geographic and political; exploitation, of timber and coal; and poor education," said Al Cross, director of the Institute for Rural Journalism and Community Issues at the University of Kentucky.
Finally, there’s an eccentricity that shaped both of the top-100 lists. Each is dominated by three states: Texas, Georgia and Kentucky. What ties together these three states? They have a lot of counties. In fact, these three states rank first, second and third on the list of states that have the most counties. Texas has 254, Georgia 159 and Kentucky 120.
This means that these three states have lots of rural, small-population counties, so they take up a disproportionate share of the spots on these lists. On each list, these three states collectively account for more than 40 percent of the counties listed.
Importantly, each of these three states are red states. If some of the bigger blue states had been sliced into as many counties as Texas, Georgia and Kentucky were, some of those blue-state counties might have been poor and rural, and that could have changed the complexion of the list. As it is, blue states tend to have smaller numbers of counties. New York has 62, California has 57, Washington state has 39, Oregon has 36, New Jersey has 21 and Massachusetts has just 14.
Our ruling
The meme said that "97 percent of the 100 poorest counties in America are in red states." According to the most recent data, that’s a few percentage points high, but not by much.
However, measuring a county’s lack of affluence this way skews the map of poorest places toward rural states (which tend to be red) and away from big cities (which tend to be blue). This undercuts the simplicity of the meme’s political message.
The statement is accurate but needs clarification or additional information, so we rate it Mostly True.
Occupy Democrats, social media meme, July 27, 2014
U.S. Census Bureau, American Fact Finder (American Community Survey five-year data for 2012, file S1903, median income, and S1701, poverty), accessed July 29, 2014
National Association of Counties, number of counties by state, accessed July 29, 2014
PolitiFact Rhode Island, "Pro-Democrat group says 9 of the 10 poorest states are Republican," March 28, 2014
PolitiFact, "'Red State Socialism' graphic says GOP-leaning states get lion's share of federal dollars," Jan. 26, 2012
Email interview with Al Cross, director of the Institute for Rural Journalism and Community Issues at the University of Kentucky, July 29, 2014
Email interview with Karen A. Woodrow-Lafield, research professor at the University of Maryland’s Population Research Center, July 29, 2014
Email interview with Tom W. Smith, senior fellow at NORC at the University of Chicago, July 29, 2014
Email interview with Douglas Massey, professor at Princeton University's Office of Population Research, July 29, 2014
Interview with Allan Parnell, president of McMillan and Moss Research, Inc., July 29, 2014


In a world of wild talk and fake news, help us stand up for the facts.