:format(webp)/cdn.vox-cdn.com/uploads/chorus_image/image/43480852/458410504.0.jpg)
Yesterday's midterm elections featured races for everything from the US Senate to governor to state legislature and local office, along with a variety of important ballot measures. It's a lot to follow, so we at Vox figured we'd break it down the way we've broken down so many things before: in 40 maps and charts.
-
Republicans deepened their control of the House …
It was never really in question that Republicans would maintain control of the House and likely gain seats — they've ended up gaining at least 10 — but there are still some surprises here. In Georgia's 12th district, Republican Rick Allen upset Rep. John Barrow, one of the last of the conservative Southern Democrats who dominated the House for decades and are now going extinct before our eyes. And Gwen Graham — daughter of former Democratic senator and governor Bob Graham — beat Republican incumbent Steve Southerland in Florida's 2nd district.
-
… and took over the Senate.
Republicans also gained control of the Senate, going from 45 seats to at least 52, with three seats up in the air. Virginia and Alaska are still getting returns back and Louisiana is going to a runoff. Democrats got no surprise victories in states like Iowa and Colorado, and they lost North Carolina, where they were leading in late polls. We still don't know the exact composition of the next Senate, but we do know Republicans will be in the majority.
-
Republican Senate gains were mainly in red states
Iowa and Colorado were the toughest Senate losses for Democrats to explain. Obama won both of those states, twice. The other five confirmed Republican gains are concentrated in red states. Thom Tillis picked up North Carolina's seat, which Kay Hagan won in 2008. Arkansas Democrat Mark Pryor was walloped due to the state's rightward tilt and a national Republican wave; the same thing happened to fellow Arkansan Democratic Sen. Blanche Lincoln in 2010. Meanwhile, popular Democrats retired in three states — South Dakota, Montana, and West Virginia — making all three guaranteed GOP gains.
-
Republicans had a good night in governor's races …
Democrats were optimistic they could unseat some unpopular Republican governors this cycle, but got just one of their wishes: Pennsylvania Gov. Tom Corbett lost to Democrat Tom Wolf. But Republican-turned-Independent-turned-Democratic former Gov. Charlie Crist lost to Republican Florida Gov. Rick Scott, despite leading in late polls. Republican Govs. Scott Walker, Sam Brownback, and Rick Snyder held on in Wisconsin, Kansas, and Michigan, respectively. And some Democratic incumbents, like Illinois Gov. Pat Quinn, had surprise losses too. Charlie Baker beat Martha Coakley to gain the Massachusetts governorship for Republicans. Vermont's Pete Shumlin got less than a majority, meaning the race goes to the state legislature; both chambers are Democrat-controlled, so Shumlin will almost certainly win, but it's still not ideal. Governor's races weren't the silver lining to the Senate results Democrats hoped they'd would be. They were a disaster for Democrats too.
-
… and state legislature elections
State legislature races matter tremendously (ask John Oliver if you don't believe me) but they tend to get much less election coverage. A few states are still coming in as of this writing, but overall it's a very good night for Republicans. Republicans gained the New Mexico, Minnesota, West Virginia, and New Hampshire Houses. The Nevada Senate flipped too. The West Virginia Senate, also formerly in Democratic hands, is tied. While Republicans ran the New York State Senate due to an agreement with moderate Democrats before this election, they now control it outright. After this year's elections, Democrats will control fewer state legislatures than they have since 1860.
-
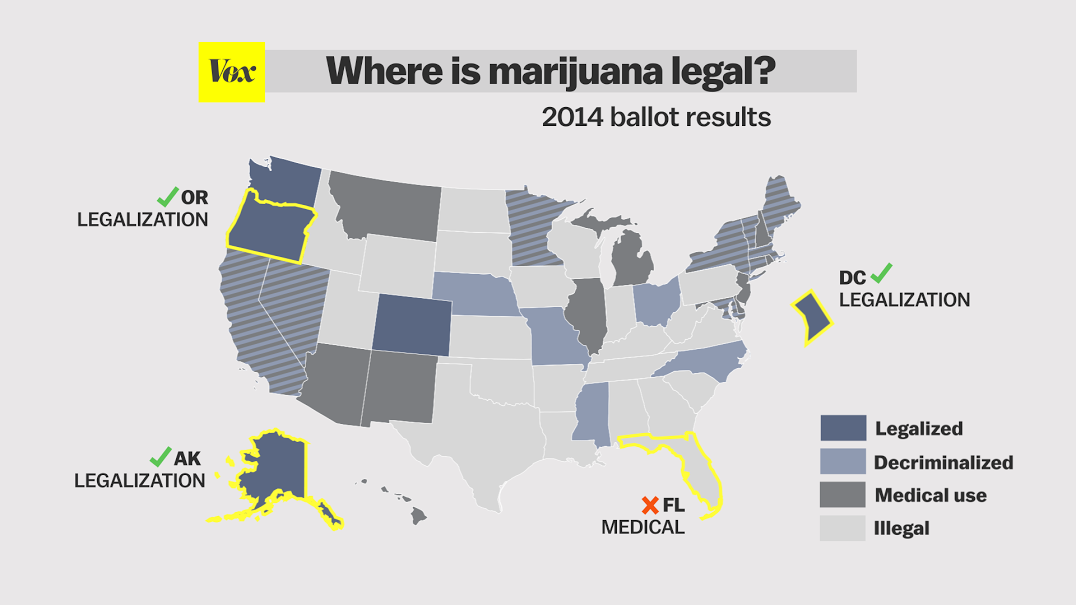
Pot was legalized in Oregon and Alaska (and kind of in DC)
Oregon and Alaska passed outright marijuana legalization last night (yellow outlines indicate states that voted on pot during this election). 90 days after the election in Alaska is certified, adults over 21 will be able to possess up to an ounce of pot (which is quite a bit) and six marijuana plants. After that, the state has a year and a half to set up legal sales. Oregon's measure means that on July 1 of next year, adults over 21 can own up to eight ounces and four plants; the state has until 2016 to implement legal sales. DC passed Initiative 71, legalizing the possession of up to two ounces of marijuana or six plants. Otherwise, DC's law is less permissive: it doesn't create regulated sales, it requires certification from the DC government to possess pot, and it needs to pass congressional review. Guam approved medical marijuana, and while a majority of Florida voters backed a similar measure, they fell short of the 50 percent threshold needed for ballot initiatives.
-
Four states increased their minimum wages
This was an unambiguously great election for minimum wage advocates. Voters in Alaska, South Dakota, Nebraska, and Arkansas approved increases and Illinois voters backed a nonbinding measure in favor of one. They join a number of other states increasing their minimums in the coming years, as shown by this chart. We've highlighted the four ballot measure states with green arrows; purple arrows indicate minimum wages that were already increasing. See here for more why this matters. Arkansas, notably, became the first state to approve a minimum greater than half the median wage.
-
Here's what minimum wages look like across the country
Four states voted on increasing their minimum wage in the 2014 midterms: Alaska, Arkansas, Nebraska, and South Dakota. Illinois also held a non-binding vote on a potential increase. This map shows how those states compared to the rest of the country before the vote. Of the four with binding votes, only Alaska had a minimum wage above the federal minimum of $7.25 per hour prior to the vote. Alabama had no minimum wage law, Arkansas's minimum was below the federal one (meaning the federal one prevailed), and Nebraska's was identical to the federal one.
-
Obamacare is on the line in governor races
Twenty-three states haven't yet signed onto Obamacare's Medicaid expansion, and 15 of those states had governors up for election. Many also had state legislature elections this cycle. That means that midterm election results could have a big impact on the 4.5 million people who'd gain insurance if these states accepted the Medicaid expansion.
-
The economic situation doesn't matter as much as in presidential elections
The economy should have favored Democrats in the midterms, but it didn't — because that's not how midterms work. The unemployment rate has fallen dramatically, to about the same level as in 2002, a year when the incumbent Republicans actually gained seats. Then again, it's also the same level as 2006, when the president's party weathered massive losses. Economic factors just don't play the same, key role in midterms that they do in presidential elections. As UCLA political scientist Lynn Vavreck puts it: "Instead of rewarding or punishing the incumbent president for his handling of the nation’s economy, in midterm years voters address the president more directly — by penalizing his party members, on average, but also by calibrating that punishment based on how the president is doing his job."
-
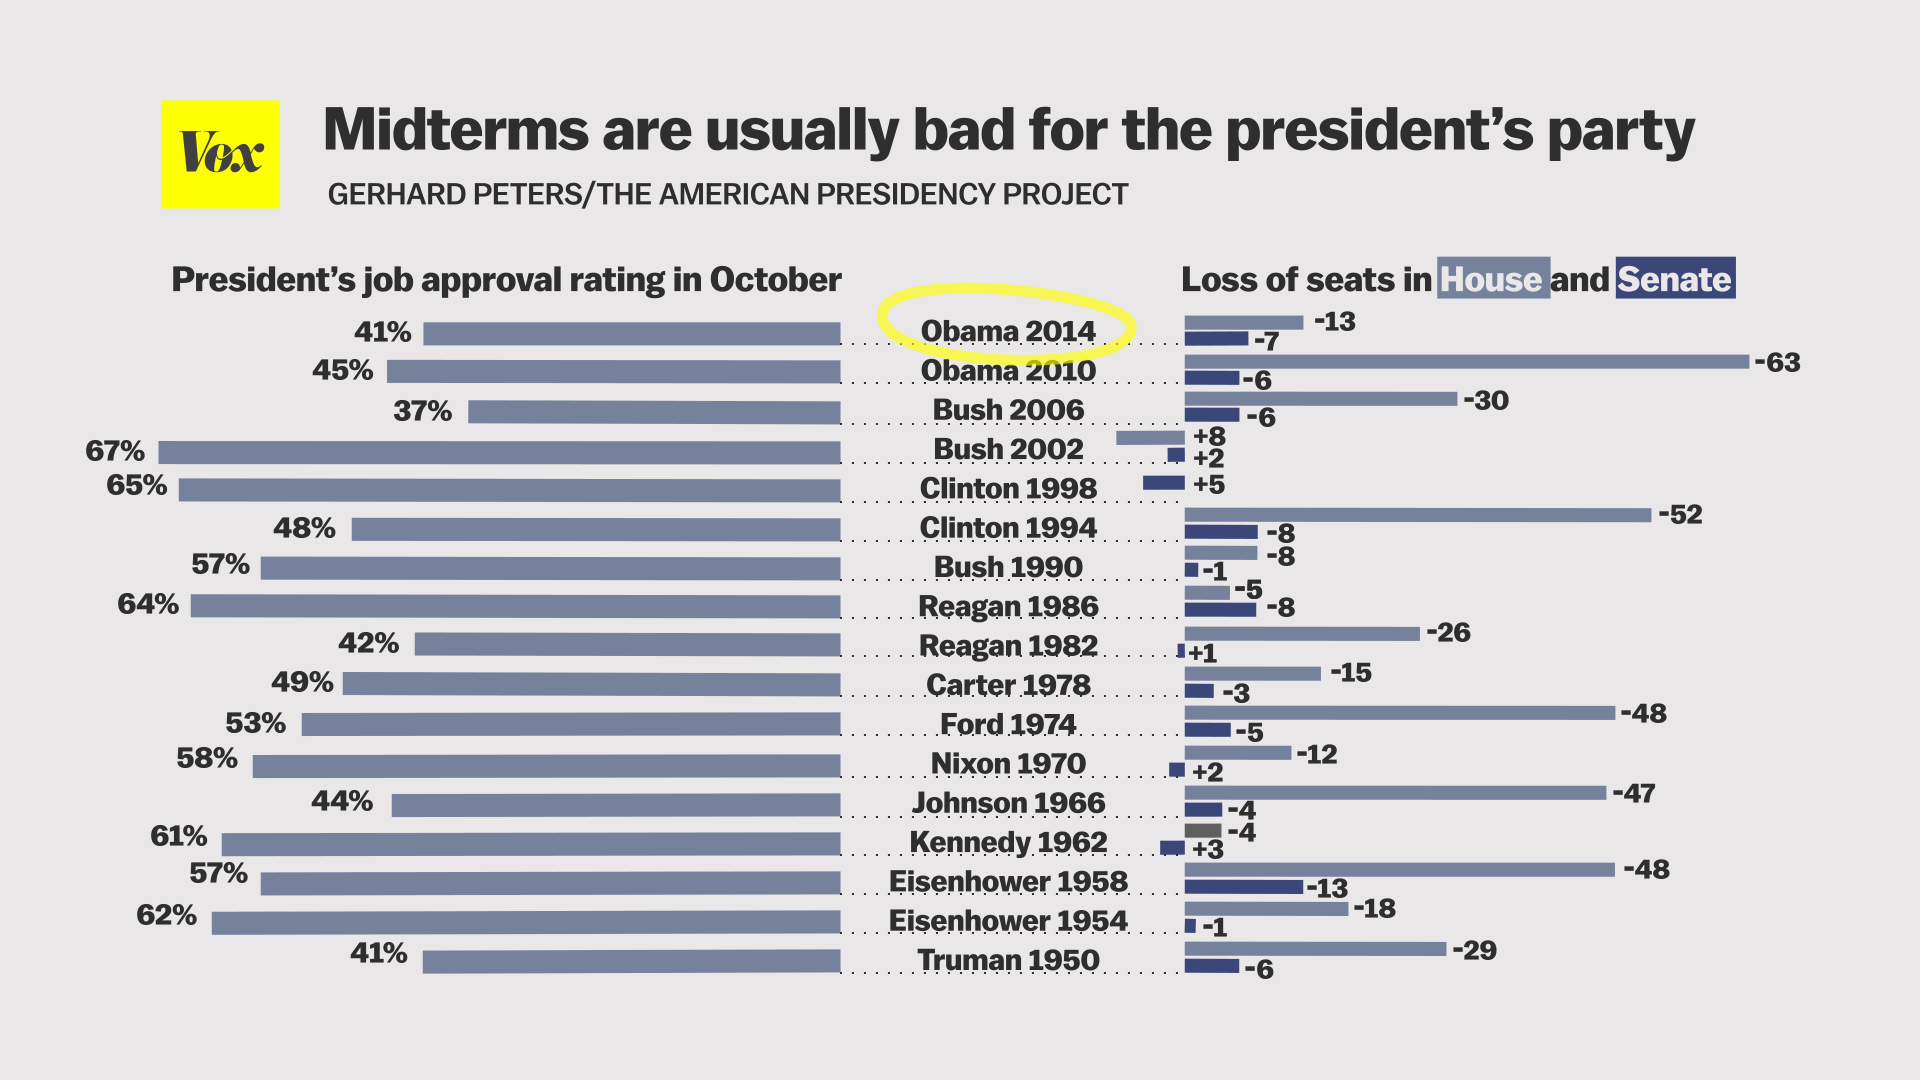
Presidential approval is really important
Presidential approval ratings are a major factor in determining the victor in midterm races. That might seem counteirntuitive, given that the president isn't actually on the ballot, but the chart makes the inverse relationship between presidential approval and losses incurred by his party pretty apparent. Midterms almost never lead to gains for the president's party; that's only happened three times (1934, 1998, and 2002) in the past century, and under extraordinary circumstances in each case (the Great Depression, Bill Clinton's impending impeachment, and 9/11). The losses are worse when the president is personally unpopular. 2014 played into that pattern, as Obama's low approval ratings translated into heavy Democratic losses. Note that not all Senate and House races are in yet, meaning the numbers for this year are incomplete.
-
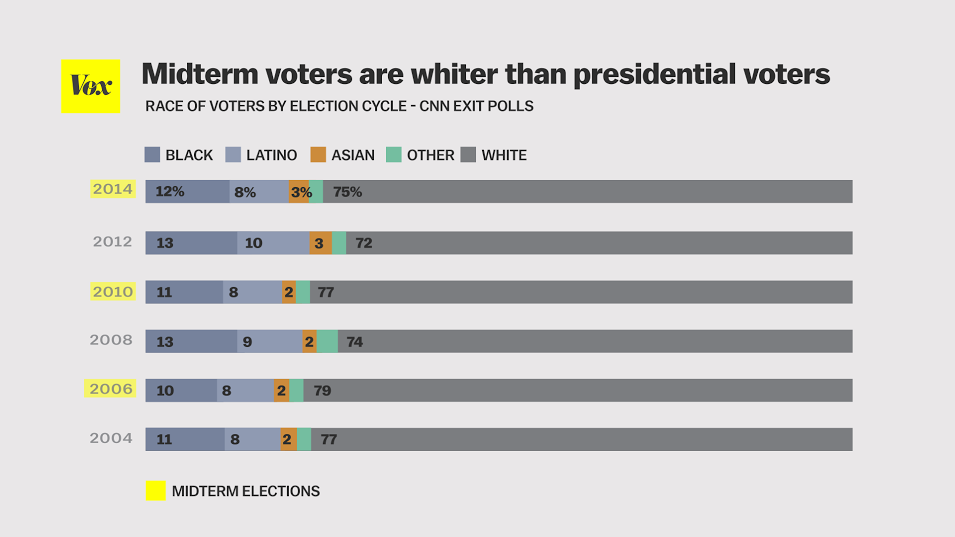
The electorate was whiter than in presidential elections
Midterm electorates are always whiter than presidential ones, and 2014 fit the pattern; 75 percent of voters were white, compared to 72 percent in 2012. That said, you can see in the chart that the electorate overall is getting less white; look at the black share of the vote increasing consistently across the midterm elections.
-
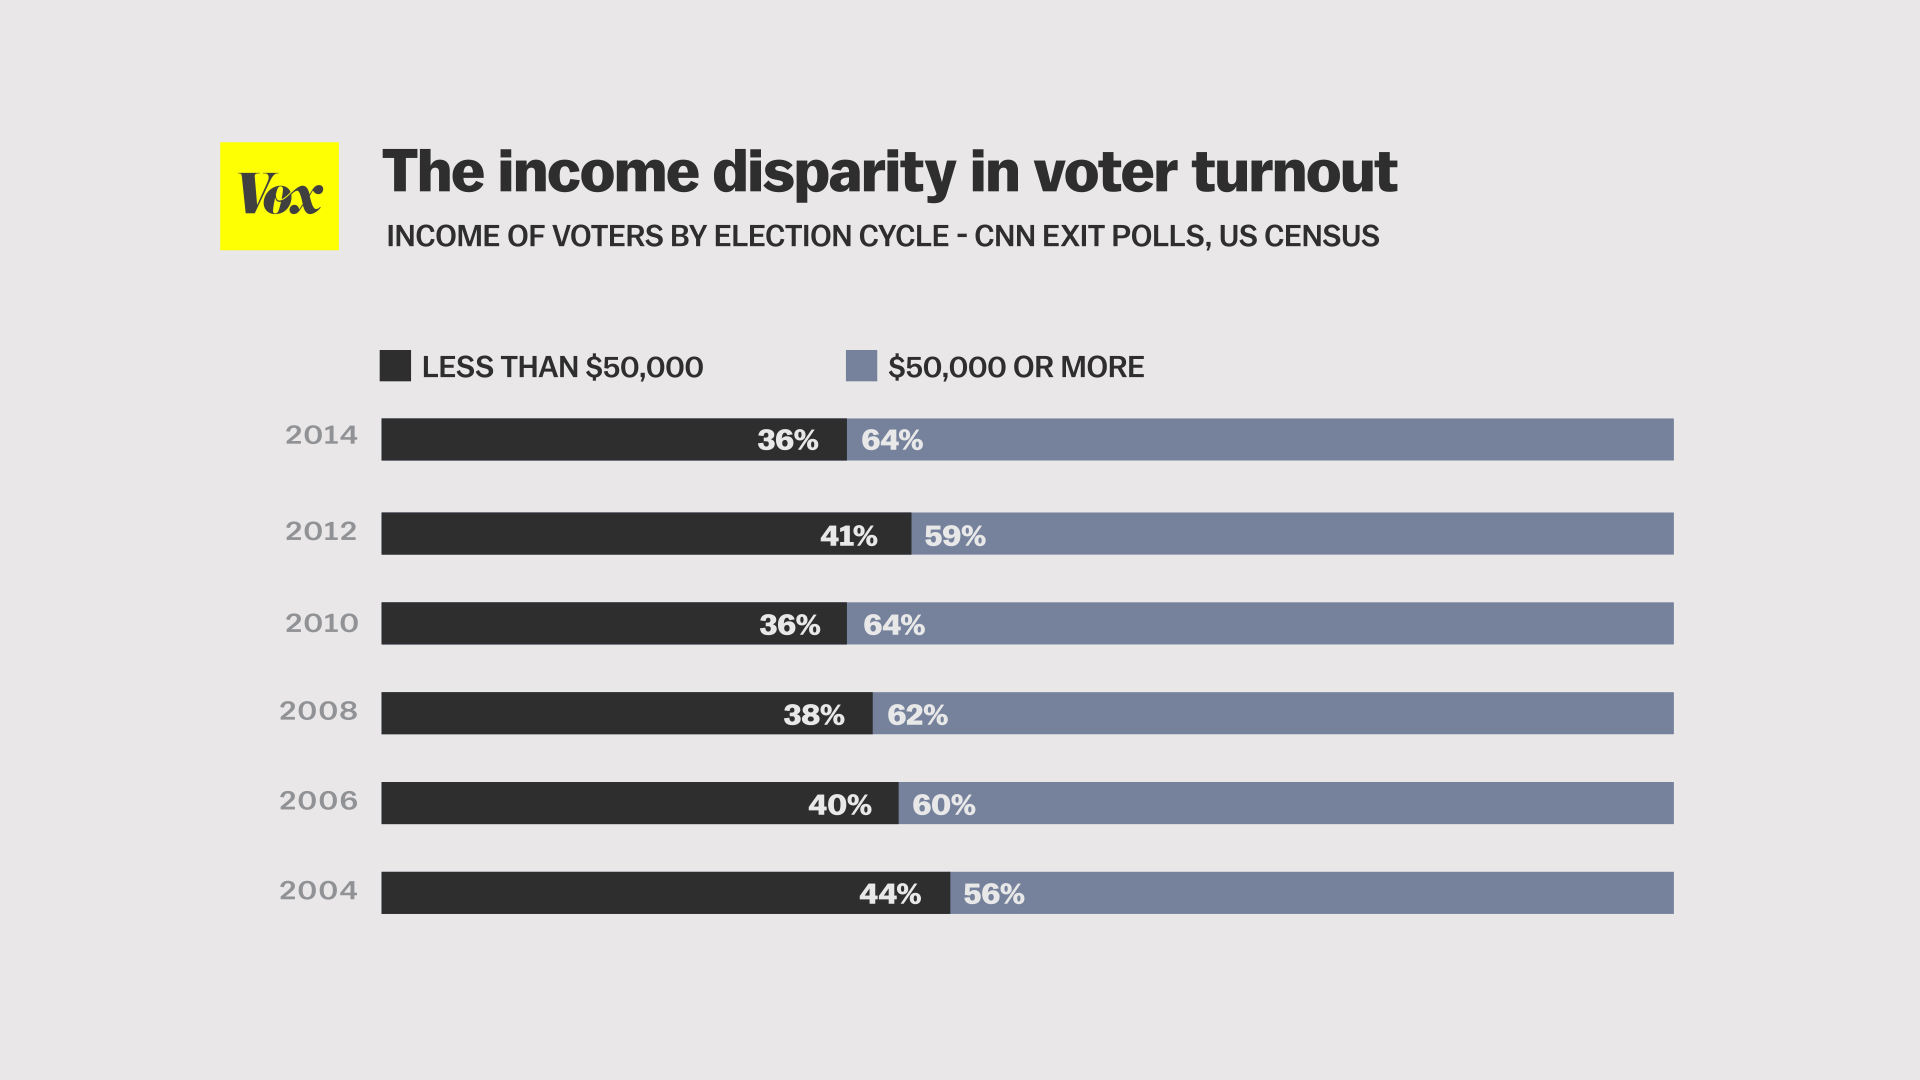
And upper-income people made up more of the electorate than in 2012
This chart seems to suggest a trend of the wealthy being more represented in midterm elections. 64 percent of voters in 2014 make $50,000 or more a year — the same share as in 2010, and greater than that group's 59 percent share in 2012.
-
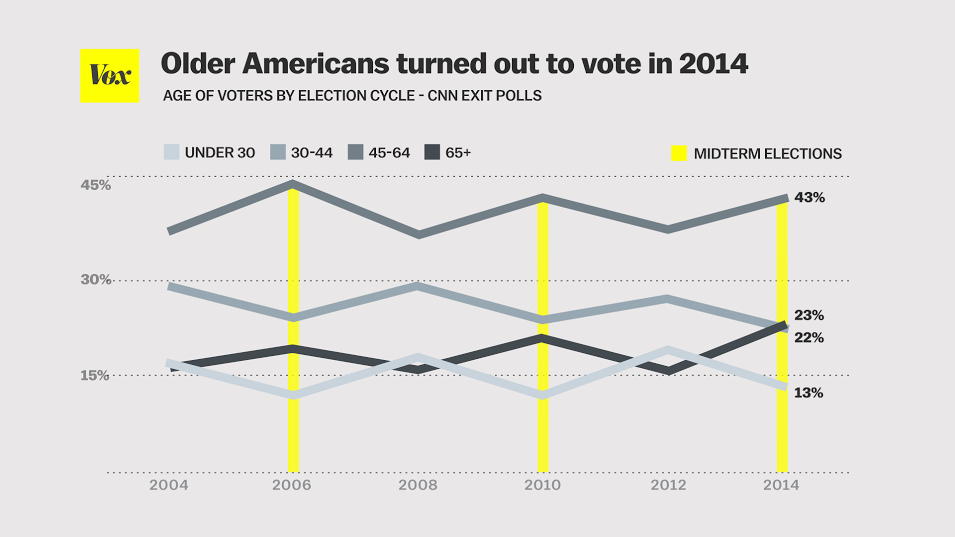
Senior citizens increased their turnout
The midterm electorate is also older than the presidential electorate. Senior citizens, for example, turn out more in midterm elections than presidential ones, but they beat even their 2010 and 2006 turnouts this year.
-
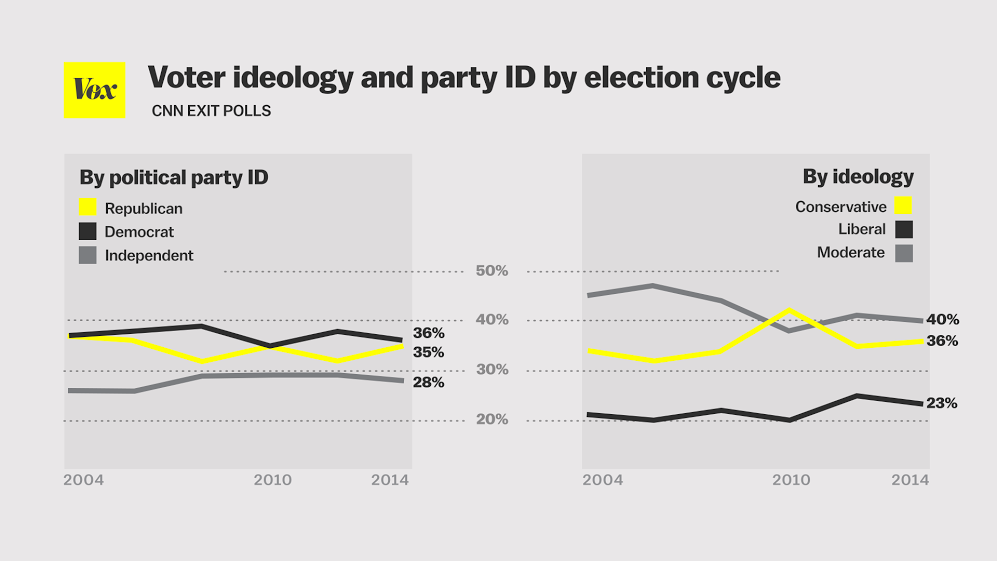
A plurality of voters identified as moderates
One striking difference from 2010: while a plurality of voters identified as conservative, more identified as moderate this time around. Liberal identifiers, as always, trailed.
-
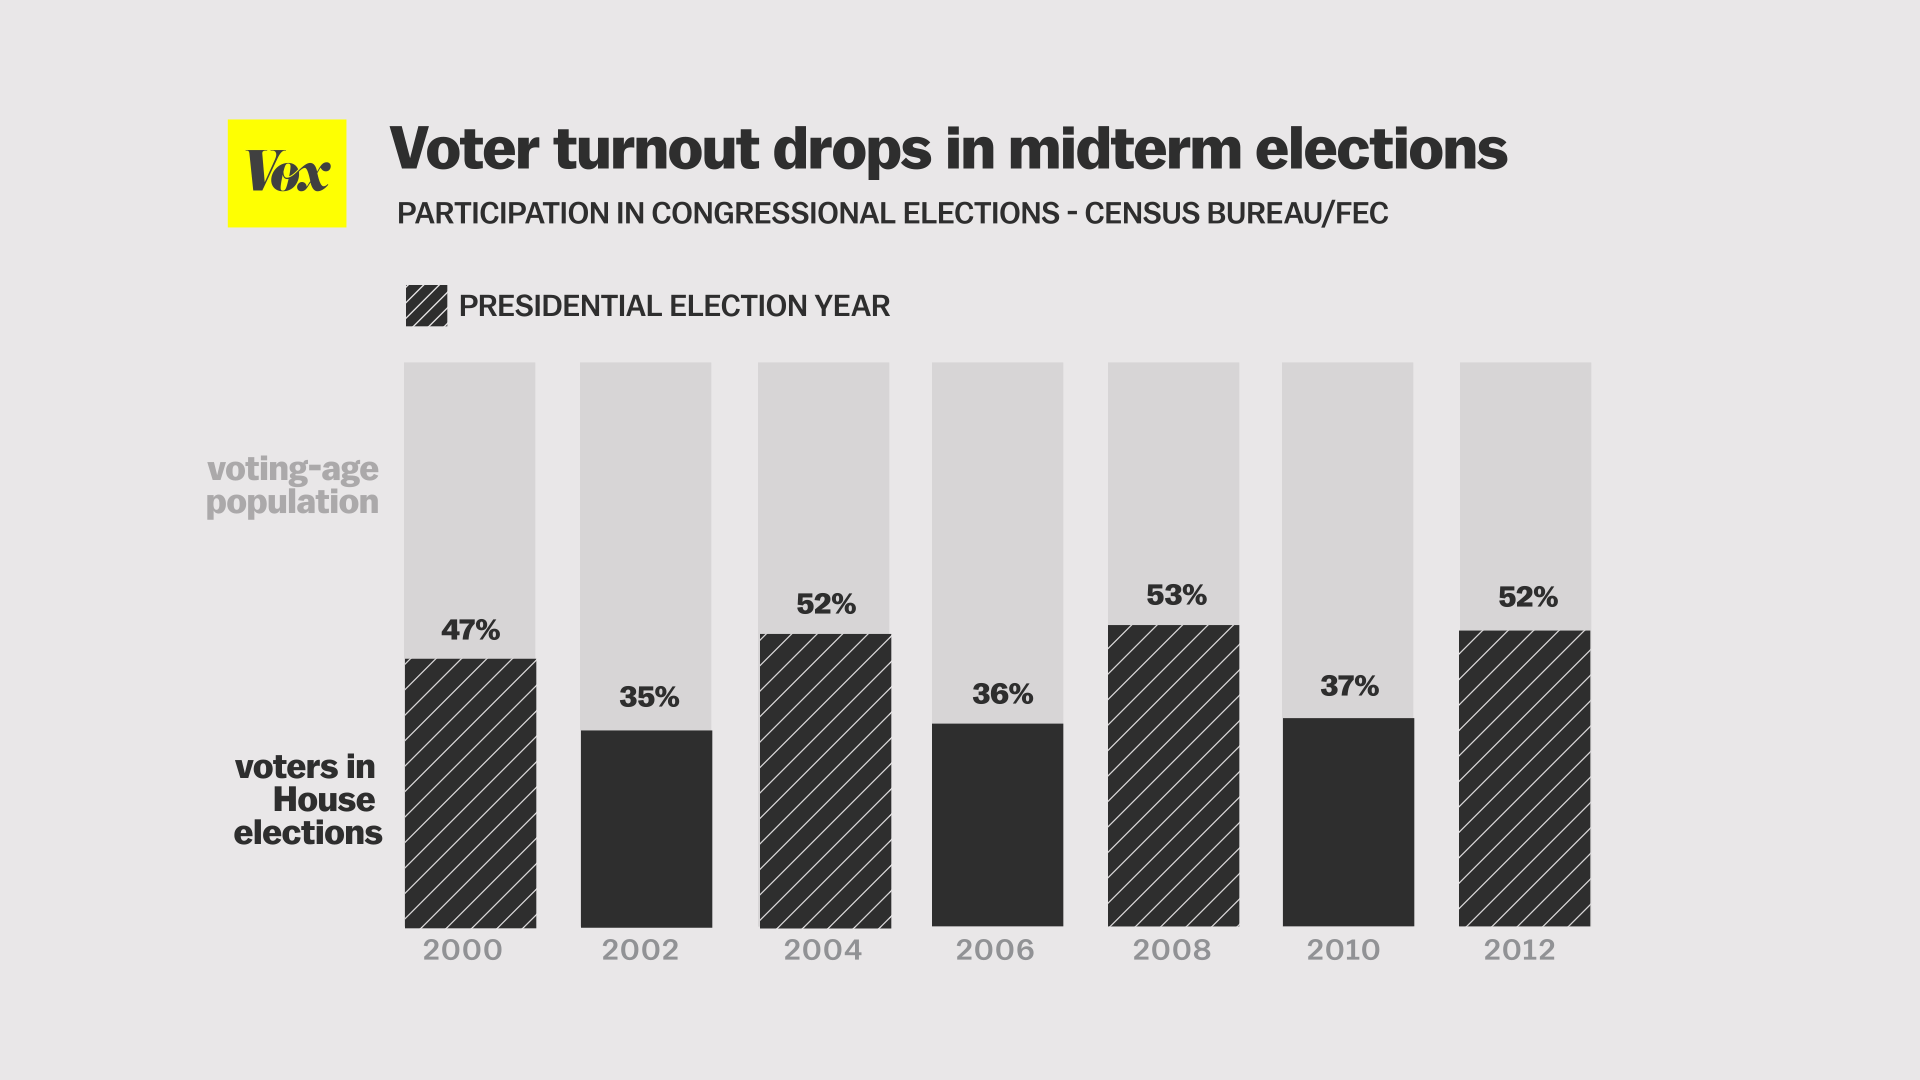
Turnout is lower in midterms
Midterm turnout always runs lower than presidential turnout. We don't have hard numbers yet, but it looks like 2014 won't be an exception.
-
Voting restrictions are expanding rapidly
State legislatures have made a lot of changes to voting procedures since 2010. Thirteen passed more restrictive voter ID laws (more on which below), nine passed laws making it harder to register to vote, eight passed laws cutting back on early voting, and three made it harder for people wtih criminal convictions to vote. All of those states are marked in red on this map. For more, check out Jenée Desmond-Harris's explainer or Wendy Weiser and Erik Opsal's report for the Brennan Center.
-
Here's which states require voter ID — and how strict they are
States' voter ID requirements vary significantly, with many not requiring any documentation, and others strictly enforcing their ID restrictions. Vox's Jenée Desmond-Harris explains: "States with strict voter ID laws require voters who don't have ID to vote using a provisional ballot and then take additional steps after Election Day (for example, returning to the election office with an ID) to ensure that their votes are counted." People without photo IDs are more likely to be racial minorities and senior citizens, meaning these laws could cause significant changes in the makeup of the electorate.
-
By chance, there were more Senate elections in red states
This map shows states that have Senate elections this year, shaded by how they voted in the 2012 presidential election. You'll see a lot of red; it just so happens that states that voted for Romney in 2012 are having a bunch of Senate elections this year. That's a big part of why the Senate elections swung so hard for Republicans.
-
...But there's also a trend of those states getting redder
The GOP advantage in this election isn't totally an anomaly. Generally, every third Senate cycle leans Republican, just because of how Senate elections were scheduled. But that lean didn't always exist, and it's getting more dramatic over time. As the above chart shows, there was barely any GOP advantage in any Senate cycles until the 1990s or so. But since then, the partisan gap in those elections (2002, 2008, 2014; the next is 2020) has grown. Now it's enormous.
-
Reminder: small states are crazily overrepresented in the Senate
California has nearly 66 times as many people as Wyoming — and exactly the same amount of Senate representation. Put another way, Wyoming voters have nearly 66 times as much influence in the Senate as California voters. That's pretty egregious, but there are also inequities at the House levels. States that just missed adding another seat have districts that are significantly larger population-wise than states that just barely qualified for their last seat.
-
Democrats suffered because a lot of their voters are urban
One of the biggest disadvantages Democrats face in House elections is the fact that their candidates tend to win by bigger margins than Republican candidates do. That sounds like a good thing, but it also means they have more wasted votes (that is, votes above the last one needed to win the election). If those wasted votes were distributed in other races, they could theoretically swing some additional seats toward Democrats. A significant factor here is that Democrats tend to cluster geographically in cities. Redistricting tends to lean in favor of keeping geographic regions together, which means heavily Democratic urban districts and less heavily Republican rural distrcts, implicitly advantaging Republicans. To avoid that, you'd need to draw districts that blend together areas with little in common (inner city Pittsburgh with central Pennsylvania, for example). These kinds of districts are, as political scientists Jowei Chen and Jonathan Rodden put it, "unlikely to emerge by chance from a nonpartisan process," and they're definitely unlikely to emerge from a partisan, Republican-led redistricting process. And there were far more nonpartisan or Republican-led redistricting processes than Democrat-run ones. The result is that wasted votes create a significant (~ 6%) advantage for Republicans, as illustrated by the chart above.
-
Gerrymandering helped both parties, but especially Republicans
Political scientists disagree about the degree to which gerrymandering is responsible for Republicans' House majority. But there's general agreement, as Vox's Andrew Prokop put it, that there have been "some egregious partisan gerrymanders" since the 2010 Census. Because Republicans controlled more state governments than Democrats did post-2010, those gerrymanders disproportionately benefited Republicans, but Democratic states got in on the action too. Here's Maryland's map, which divvies up liberal areas (Baltimore, the DC suburbs), then combines them with less liberal portions of the state; that means Democrats have smaller win margins but more seats overall, and only one seat (the one bordering Delaware) is left to be represented by a Republican. Compare that to Pennsylvania, where Republicans did the opposite: packing liberal urban segments into as few districts as possible, and conceding them to the Democrats to maximize Republican chances in the rest of the state. Dave Weigel has a good explanation of the Maryland and Pennsylvania cases, if you're interested.
-
What the forecasters predicted for the Senate
The predictions for how the Senate vote would shake out, as shown here from six different outlets, were pretty unanimous: the GOP was going to take the Senate. The average prediction was a margin of 52 Republicans to 46 Democrats (with two Democratic-caucusing Independents), meaning the forecasts predicted a seven seat gain for the GOP. We're up to a seven-seat gain now, and that could grow as returns from Alaska and Virginia come in.
-
What forecasts predicted for the House
The forecasts for the House predicted on average that Republicans would gain a 242-193 majority, up from 233-199 (with two vacant seats). As of this writing, Republicans are confirmed to have at least 243 seats, meaning the forecasts undershot.
-
What forecasts predicted for the state legislatures
Political scientist Carl Klarner used state-level conditions (which party had more incumbents, votes in past elections, the state economy) and national factors (generic ballot polls on the US House election, presidential approval polls, real income growth) to predict that Republicans would gain nine State Houses and five State Senates. Too many chambers are still not called to see how right he was, but he correctly called the losses of the Minnesota, Nevada, New Hampshire, New Mexico, and West Virginia Houses, as well as the New York and Maine Senates. He incorrectly predicted the Iowa Senate, Maine House, and Kentucky House would flip.
-
The polls consistently underestimated Republicans
This chart shows how off FiveThirty Eight's Senate projections were in various Senate races. The point is not to pick on FiveThirtyEight - most forecasts got these races wrong by roughly these amounts. The point is that the polling in 2014 consistently underestimated the strength of Republican candidates.
-
Election forecasts are always off in midterms
This chart, posted by forecaster Sam Wang two weeks before the election, makes an important point. Senate polls are always off somewhat, and they tend to be off by more in midterm elections. The thing is, we don't know going in which direction they're going to err. This morning, it's clear that they erred by overestimating Democrats and underestimating Republicans.
-
GOP governors outperformed the forecasts
The Senate polls weren't the only ones to underestimate Republicans. Florida Gov. Rick Scott and Illinois's Bruce Rauner won despite being down in late polls. But few surprises were as shocking as Kansas Gov. Sam Brownback's come from behind win after many conservatives had written him off.
-
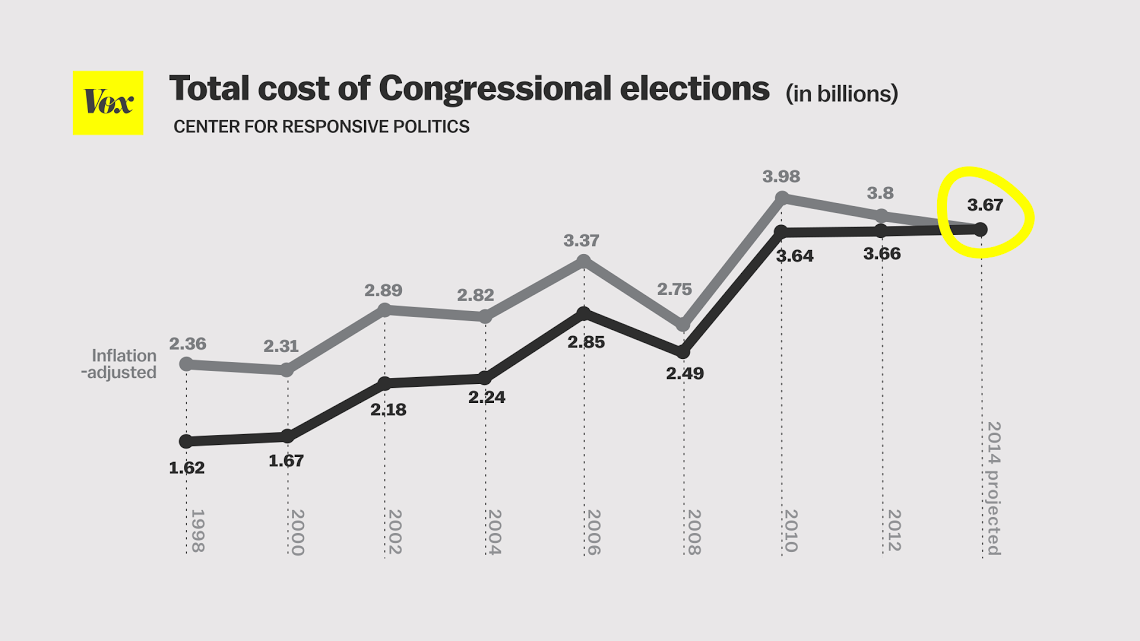
Congressional election are getting more expensive
According to OpenSecrets.org, spending on 2014's congressional elections will easily outpace any other year. This year's is projected to cost $3.9 billion, compared to $3.6 billion in 2012 and 2010. Presidential elections are exceptionally expensive, so the 2004, 2008, and 2012 races were still more expensive overall.
-
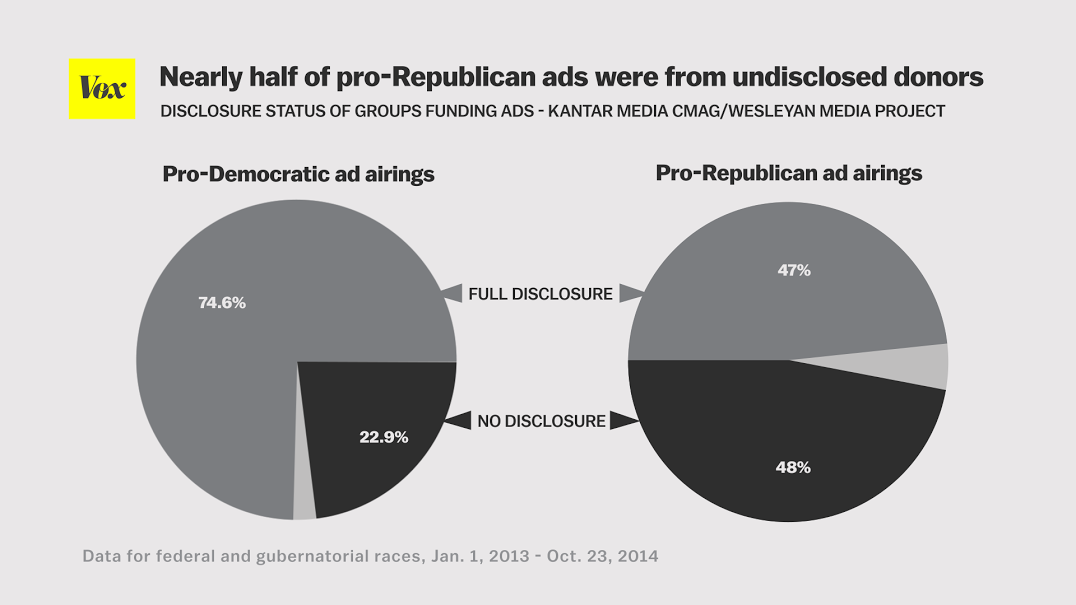
Pro-GOP ads were twice as likely to be funded by dark money
"Dark money," or money spent on "issue ads" that don't endorse specific candidates but are clearly meant to influence the race (and which are funded by way of anonymous 501(c) charitable donations), are an increasingly important part of the campaign finance picture. Almost half of Republican ads this cycle were funded by undisclosed donors.
-
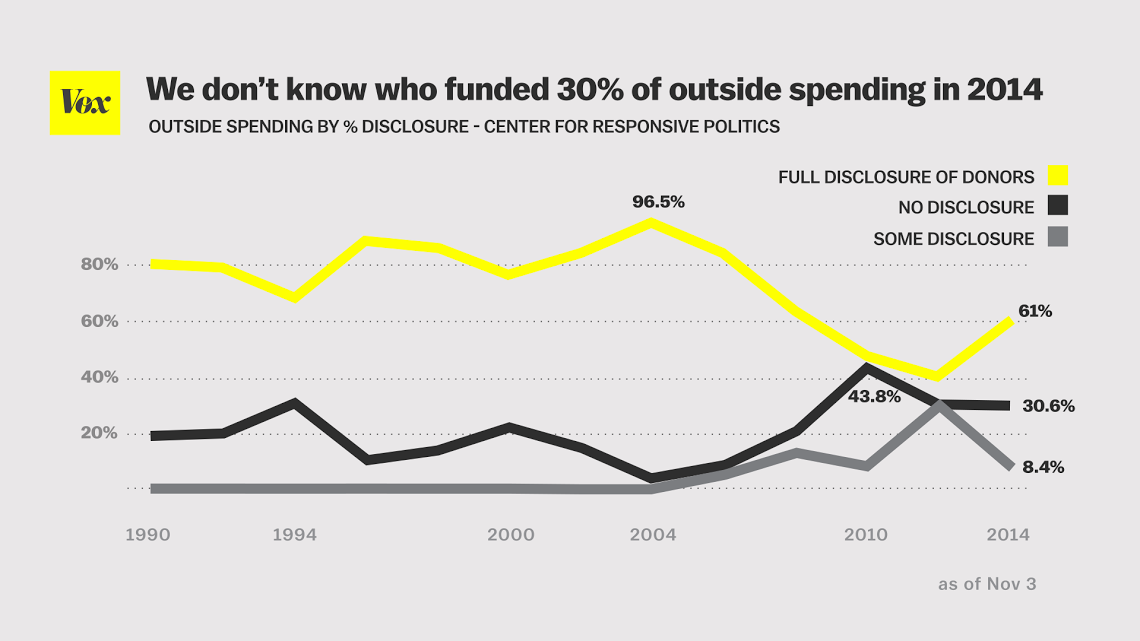
30 percent of outside spending in 2014 came from unknown sources
Dark money made up a significant share of total campaign spending, hitting 30.6 percent this cycle. That's below 2010 levels but in line with 2012. One startling fact: spending funded by disclosed donors made up 96.5 percent of all spending in 2004, and only 61 percent in 2014. Citizens United wasn't the sole cause of this, but it made it clear that nonprofit spending on issue ads was constitutional, after which that spending grew considerably.
-
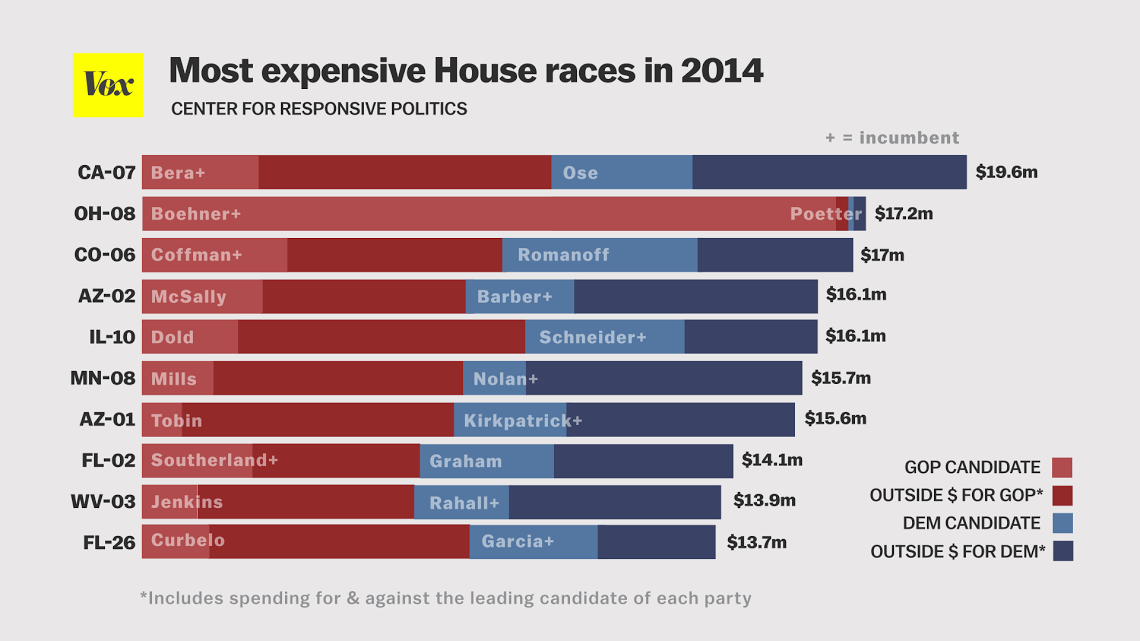
Most expensive House races
The most expensive House races were mostly in swing districts, such as California's 7th (which is still too close to call as of this writing), Colorado's 6th (where Republican Mike Coffman beat Democratic former State House Speaker Andrew Romanoff), and Arizona's 2nd (where Republican candidate Martha McSally is a mere 36 votes ahead of incumbent Ron Barber as of this writing). But there's one big exception: Ohio's 8th, a safe Republican district. The reason is pretty obvious: the seat's held by House Speaker John Boehner. But even if that explains his prodigious fundraising, how can it account for his spending? Simple: the biggest recipient of his campaign funds, by far, was the National Republican Congressional Committee.
-
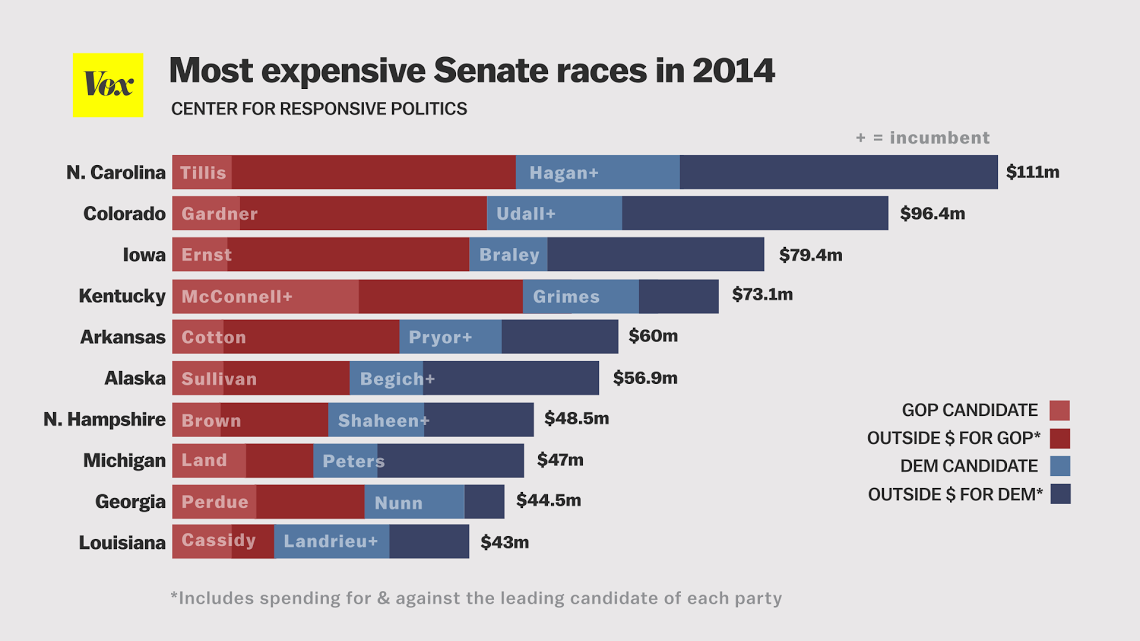
Most expensive Senate races
The top spending races tend to fall into one of two categories: races that are unusually competitive or that involve high-profile party leaders. Senate Minority Leader (soon to be Majority Leader!) Mitch McConnell's race in Kentucky was both. His Democratic opponent Alison Lundergren Grimes was within reach for much of the election, but ultimately lost. So it's hardly a surprise his was among the top-spending Senate campaigns.
-
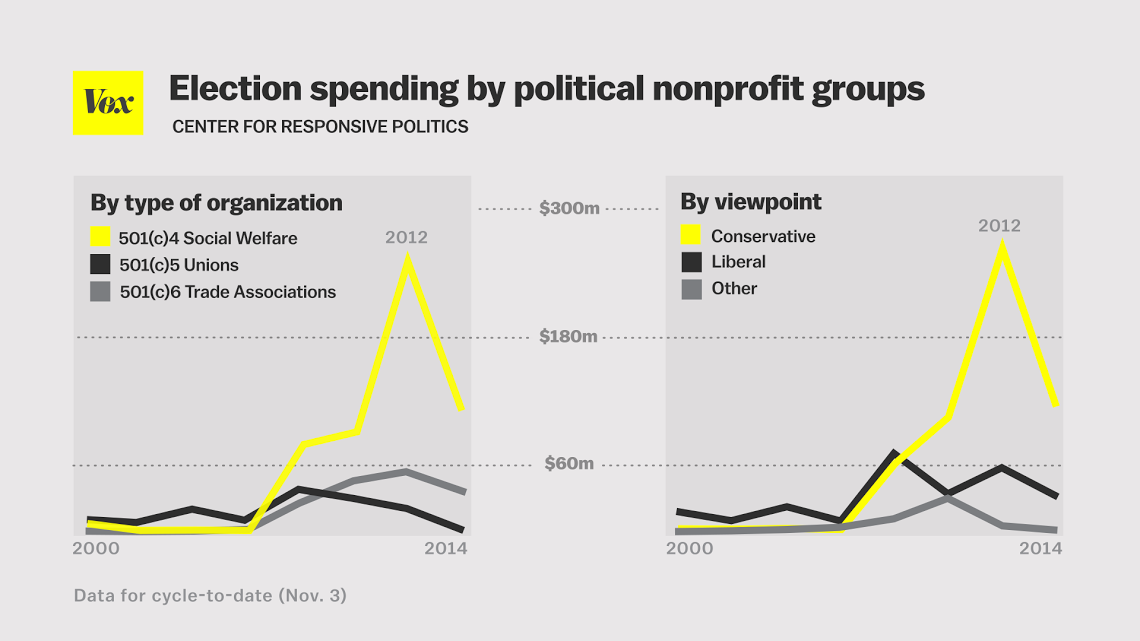
How dark money breaks down
This chart breaks down "dark money" political spending by the type of groups spending it. The vast majority are 501(c)4 charitable organizations; donations aren't tax deductible but can remain anonymous. The chart also shows that dark money spending comes overwhelming from right-of-center groups.
-
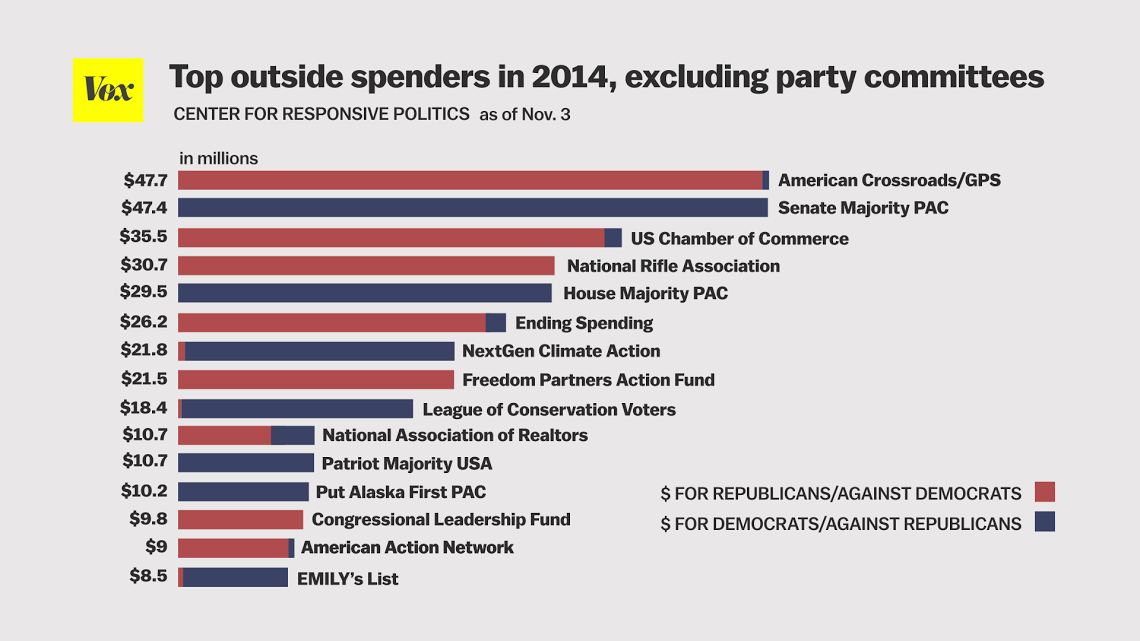
What groups spent the most
This chart shows the top outside spenders — including both Super PACs, which disclose donors, and 501(c)4 advocacy groups, which don't, merging the two in cases where an organization has both — in the 2014 elections. The top Republican spender, the Karl Rove-affiliated American Crossroads/Crossroads GPS, wasn't that far ahead of the Senate Majority PAC, which unofficially exists to support outgoing Senate Majority Leader Harry Reid. But the chart shows that the highest-spending issue-oriented groups — the Chamber of Commerce and the NRA — broke overwhelmingly for Republicans.
-
Where attack ads were most negative
Like any reasonably close election cycle, 2014 got nasty. Slate's Chris Kirk took a look at Senate political ads by state, to see where those ads were the most and least likely to be attack ads. Georgia stands out for having what was, for most the election, a quite close race, where nonetheless on ly 41% of political ads were attack ads. Check out the full interactive here.
-
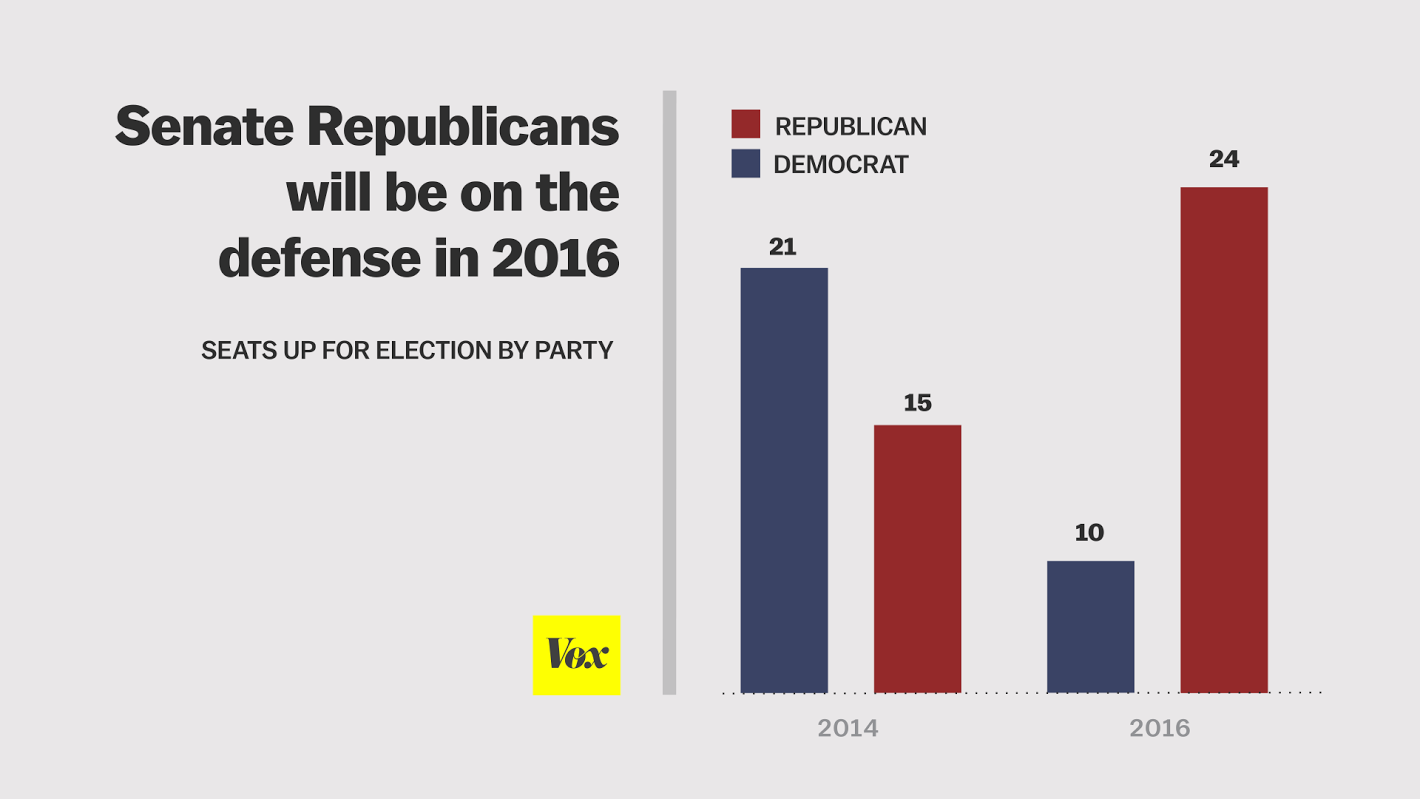
The 2016 Senate elections will be tougher for Republicans
2014 was an unusually tough year for Senate Democrats. But 2016 will be another story. The electorate in the states with Senate elections in 2016 isn't tilted strongly toward either party and Republicans will have to defend their 2010 wave, including seats in blue states like Pennsylvania and Illinois.
-
A bad year for diversity among governors — except for female Republicans
Going into 2014, it looked like governorships were going to get a little more diverse. Maine Democrat Rep. Mike Michaud had a real shot at becoming the first elected openly gay governor. Democratic Maryland Lt. Governor Anthony Brown was thought to be well ahead, and would have been the third elected black governor in American history (after Virginia's Doug Wilder and Massachusetts' Deval Patrick, who retired this year). A number of Democratic female candidates, like Massachusetts' Martha Coakley and Wisconsin's Mary Burke, were in close races in states with male incumbents. But all four of those candidates lost in the Republican wave. Republican women, by contrast, did quite well, with Oklahoma's Mary Fallin and New Mexico's Susana Martinez winning easily.
-
Women in Congress cross the 100 mark
Regardless of your politics, it's worth celebrating the fact that, for the first time ever, more than 100 women are members of the House or Senate.
The results


The issues


/cdn0.vox-cdn.com/uploads/chorus_asset/file/2426614/Coverage_Gap_Finalv2.0.png)

The voters

/cdn0.vox-cdn.com/uploads/chorus_asset/file/2372370/VoterIDLaws.cropped.0.jpeg)
Understanding the vote
/cdn0.vox-cdn.com/uploads/chorus_asset/file/2426018/Slide12-624x468.0.jpg)
/cdn1.vox-cdn.com/uploads/chorus_asset/file/2421530/Screenshot_2014-11-03_11.45.52.0.png)


What polls got right and wrong


/cdn0.vox-cdn.com/uploads/chorus_asset/file/2430292/Poll_error_11-05.0.png)


Money in the 2014 election

Looking forward


Credits
- Writer Dylan Matthews
- Graphics Joe Posner, Joss Fong, Estelle Caswell, Tyson Whiting, Anand Katakam
- Editors Melissa Bell, Lauren Williams, Max Fisher
- Developer Yuri Victor
Correction: The original GIF of gubernatorial election changes had inaccurate coloring for Michigan and Colorado. The chart of voters by income formerly listed national median income figures rather than ones for voters; those have been removed. We regret the errors.