

We did some number crunching on a unique dataset about the MarTech market. Within MarTech, the Data market is growing the fastest. Social & Relationships and Commerce & Sales prepare for ‘consolidation while growing’. Ads & Promotions is the most mature market.
As a MarTech manager, you want to know if you miss out on a certain MarTech trend or tool. And as a MarTech vendor, you want to know what direction your market is moving towards.
If so, then you must have noticed that there is not a lot of research out there. There is of course the Marketing Technology Landscape. As a numbers guy I love this already.

I can imagine this does make you eager to go one level deeper. It surely made me hungry.
All sorts of questions pop up. What happens under this MarTech landscape surface? What about the categories, in the 6 different columns? In my mind, each column is a universe in itself, or call it a MarTech market. Do all MarTech markets behave the same? If not, what are the differences? What is my next “best tool”?
The myth of MarTech consolidation
“The myth of MarTech consolidation is dead. Now what?”, Scott Brinker wrote on May 7, 2018. In total he dedicated three articles to the MarTech Consolidation.
- Marketing technology may never consolidate (but that’s a good thing), april 20, 2017
- The myth of MarTech consolidation is dead. Now what?, May 7, 2018
- The paradox of simultaneous MarTech consolidation and expansion, illustrated, May 20, 2018
Recently in London, he presented his view on MarTech consolidation, about which he published before. Even though the MarTech landscape seems to expand continuously, local consolidations are taking place.

Two light bulb moments
When talking about MarTech consolidation Scott complained in one of his articles: “Man, people sure do find anecdotes more persuasive than data.” And he is right. So while listening to Scott’s presentation it hit me. Twice.
- In the latest version of the Marketing Technology Supergraphic 2018, he and Anand indicate which tools have been “added”, “changed”, “removed” or are “active”, which we can apply to the 6 MarTech markets.
- We have built up a unique data set on Stackies. We collected the Stackies Awards submissions, we analyzed stackies of our client base as well as entries in our own MarTech Benchmark survey. This has led to a database of 184 real-life marketing department stacks (and counting). For each stack we have listed their logos and put it into a database.
Back home we immediately started crunching the numbers from the two datasets. Let’s try to put some numbers in place...or die trying. Here are my 5 cents.
Lightbulb #1. What the MarTech Supergraphic 2018 data is telling us
If you consider the numbers of Marketing Technology Supergraphic of 2018, you can see the following.
- Content & Experience and Social & Relationships are currently the biggest MarTech submarkets They account for 48% of the entire MarTech market.
- The smallest submarket is Management.

We had a look at the Marketing Technology Supergraphics over the years. You can see that the current 6-column categorization materialized as of 2016. The subcategories vary over time, but the 6 markets have remained the same.
We put the data of 2016, 2017 and 2018 in one database. Looking at the 6 MarTech markets, we discovered quite a few interesting things. Let’s see how many tools are out there in every market. In absolute numbers it looks like this.

To spot the trends more easily, we created this graph.
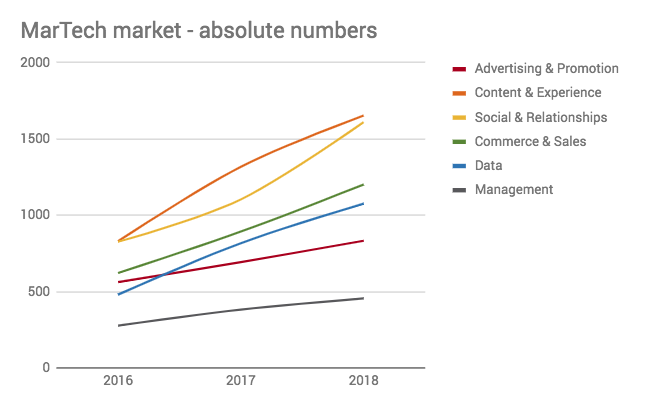
- Content & Experience has almost surpassed by Social & Relationships
- In 2017 Data overtook Ads & Promotions
- The slowest growing categories are Ads & Promotions and Management.
If we compare the number of tools in 2018 to 2016 we can conclude the following.
- Data is growing the fastest (124%)
- Content & Experience (99%), Social & Relationships (95%) and Commerce & Sales (93%) come in second
- Ads & Promotion is the slowest growing market with 48%.

It is interesting to see what made the growth of Ads & Promotion slow down. And what boosts the growth of Data? To find out, we analyzed the number of tools that have been “removed” in a certain market, which is an indicator for reduced growth. We also checked the amount of tools that have been “added”, which represents the growth of a market.

- Ads & Promotions faced the biggest drop off in tools, at 10%. The growth of Ads & Promotions is in the mid-regions of the overall market.
- Management hardly has a drop off (<1%), but also a very moderate growth.
- The most severe changes can be found in the markets of Social & Relationships, Commerce & Sales and Data (both 34%).
Lightbulb #2. What the MarTech Stacks data is telling us
The Stackie Awards take place during a yearly MarTech conference. As a way of expressing gratitude to the contributors, The MarTech Conference organizers make a donation to charity on behalf of every entry.
To give you an impression, here are the 54 entries for the 2018 conference. “Hey mom, we are at the last column, the third row from above. Can you see me?”

Not all submissions show logos (clearly enough) for us to use. Some are just concepts. Most represent what tool set the marketing team is using on a daily basis.

Just a word of caution. A large number of the stacks were sent in by companies that are also MarTech vendors themselves, like Bizible, Microsoft or Cisco. So these tools can be part of other companies’ stacks, while having a stack of their own. And slightly more confusing, the Bizible tool is actually part of Bizible’s stack. But who would blame them for using their own product, right?
The average amount of tools per stack is increasing every year. This supports the growth of the market. Not only more tools are added, also the use of (amount of) tools is growing.

The MarTech Long Tail graph shows which tools are used most often, for all of Martech markets. Eat your heart out!

The MarTech Long Tail shows a concentration of tools. Some tools are represented in almost all stacks, while other tools are mentioned in only one or two marketing technology stacks.To put a number to that, some 8,7% of all vendors mentioned take up 51% of the market (see an impressive graph here). In some markets we see parity in the ratio Tools in use : Tools Mentioned in stacks. Yet other markets show tool usage disparity.

- In Ads & Promotion, Content & Experience and Management a few tools surface in many stacks.
- Data, Social & Relationships and Commerce & Sales have a ratio of around 1:1.
It is interesting to see what the impact is of the tools “removed” from the Supergraphic of 2018 on the company stacks. Do the removed tools surface often in the company stacks or not?
The answer is “not at all”. A remarkably low amount of ‘tools in (high) use’ dropped off. This might imply that when it comes to dropped tools, only the long tail tools are affected, not the short head tools. This might be called a kind of consolidation too.

How about the synchronization of MarTech demand and supply? To what extent does the supply of tools in a specific Landscape category match the demand for tools expressed in the Stackies?
Social & Relationships and Commerce & Sales has a 5% surplus in tools offered compared to how often the tools show up in analyzed stacks.


To explore the MarTech consolidation, we can have a look at what a mature market looks like. It is said that a mature market shows the following market shares.
- The top 3 of companies generate around 50% of the market turnover.
- The next 20 companies generate excluding the top three generate the next 45% of the market turnover.
- The rest of the companies have around 5% of the market turnover.
Caution: This division is based on turnover. But we cannot resist the temptation to plot this model on our stacks. Yes, we do consider coming up with a version based on turnover too. A bit of patience, please.
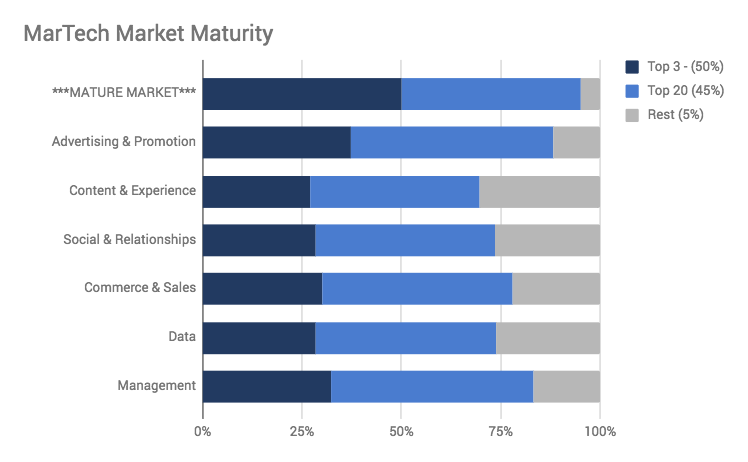
The first layer is showing the benchmark. The 6 layers below are showing the MarTech markets. The Ads & Promotions market is the most mature. The next one is Management.
Some daring conclusions. For the fun of it.
To some up our tentative conclusions on MarTech trends:
Growth
- The Data market is growing the fastest.
- The Management market is the slowest growing market.
Maturity
- Content & Experience is preparing for maturity.
- Ads & Promotions is the most mature market, followed by Management.
Consolidation
- Underneath the growth figures you might say there is a subterranean consolidation taking place.
- Long tail tools drop off. Short head tools are still going strong.
- A good level of consolidation already took place in 2018 in Ads & Promotions. Since this market is the most mature, it is in sync with the demand side and it suffered a large number of tool drop offs.
- The next in line to consolidate might be Social & Relationships and Commerce & Sales. Their maturity is relatively low, their growth is high with a low drop off and a the highest tool surplus.
- Content & Experience is not yet mature, but growth is decreasing. With a low surplus huge shake outs might not be expected.
- Data is growing fast, but the low maturity and parity of tools used versus tools mentioned suggest that growth might continue before a shake out takes place.
- Management is having a life of its own. Hardly a drop off, hardly any growth. The tool usage disparity hints towards a consolidated market, as well as the maturity.
Now, if you're curious about the maturity of your stack, and which tools could improve it, do the MarTech Benchmark survey.

Related posts
Keep reading for more marketing technology information!

57 Integration tools to automate your MarTech stack

A Martech Manifesto - 4 Guiding Principles to Design Martech Stacks Fast

300+ stats to build your Martech Business Case