Cytonn Monthly-January 2021
By Cytonn Research Team, Jan 31, 2021
Executive Summary
Fixed Income
During the month of January, T-bill auctions recorded an undersubscription, with the overall subscription rate coming in at 67.3%, but still an increase from 54.8% recorded in the month of December, 2020. The highest subscription rate was in the 364-day paper, which came in at 115.9%, an increase from 50.4% recorded the previous month. The subscription for the 182-day and 91-day papers declined to 33.1% and 45.5% from 40.2% and 94.5% recorded in the month of December, 2020, respectively. During the week, T-bills subscription rate declined with the overall subscription rate coming in at 66.2%, from 84.5% recorded the previous week. This can be mainly attributed to; the continued tightening of liquidity in the money markets. The highest subscription rate was in the 364-day paper at 134.2% but still a decline from 172.2% recorded the previous week. The subscription for the 182-day paper also declined to 19.7% from 53.7% recorded the previous week, while the 91-day paper increased to 12.7% from 9.2% recorded the previous week;
During the month, the Central Bank of Kenya issued two bonds, FXD1/2021/002 and IFB1/2021/016, having effective tenors of 2 years and 16 years with coupons of 9.5% and 12.3%, respectively. The two issues recorded high demand, with the overall subscription rate coming in at 244.6% and 250.7% respectively , mainly supported by the attractive tax-free nature of the infrastructure bond and improved liquidity in the market, respectively;
The Monetary Policy Committee (MPC) met on Wednesday, 27th January 2021, to review the outcome of its previous policy decisions and recent economic developments, and to decide on the direction of the Central Bank Rate (CBR). The MPC retained the CBR at 7.0% which is in line with our expectations MPC January 2021 Note. This is the sixth straight time that the committee is retaining the rate at 7.0% following the rate cuts in the first half of 2020. According to Kenya National Bureau of Statistics (KNBS) Quarterly Gross Domestic Product Report, the Kenyan economy recorded a 1.1% contraction in Q3’2020 down from a growth of 5.8% recorded in a similar period in 2019 but showed some recovery from 5.5% the contraction recorded in the second quarter. Also, during the week, the Kenya National Bureau of Statistics (KNBS) released inflation data, revealing the y/y inflation for January, 2021 increased to 5.7%, from the 5.6% recorded in December 2020;
Equities
During the month of January, the equities market was on an upward trajectory, with NASI, NSE20 and NSE 25 gaining by 2.3%, 0.7%, and 0.6%, respectively. The equities market performance was driven by gains recorded by large-cap stocks such as BAT, Bamburi, and Safaricom, which gained by 12.5%, 11.1%, and 4.7%, respectively. The gains were however weighed down by losses recorded by banking stocks such as NCBA Group, KCB Group, and Standard Chartered Bank, which declined by 7.5%, 5.9%, and 4.0%, respectively;
During the month, The Insurance Regulatory Authority (IRA), recently released the Q3’2020 Insurance Industry Report highlighting that the industry’s gross premium rose by 2.6% to Kshs 179.4 bn, from Kshs 174.9 bn recorded in Q3’2019, with the general insurance business contributing to 58.6% of the industry’s premium income, a 1.6% points decline from the 60.2% contribution witnessed in Q3’2019;
Real Estate
During the month, the Kenya National Bureau of Statistics (KNBS), released the Quarterly Gross Domestic Product Report-Q3’2020, highlighting that growth in real estate and construction activities came in at 5.3% and 16.2%, respectively, compared to 5.5% and 6.6% growth in Q3’2019;
In the residential sector, British Foreign Secretary Dominic Raab announced that Kenya is expected to receive at least Kshs 8.0 bn from the United Kingdom to finance the construction of approximately 10,000 affordable houses through Acorn Holdings, a local real estate developer;
In the retail sector, Giordano, a Hong Kong clothing retailer, opened its 3rd store in Nairobi at Two Rivers Mall along Kiambu Road, taking up 1,076 SQFT space. French retailer Carrefour, launched a new mobile application that is expected to enhance the online shopping experience for its Kenyan customers while Naivas Supermarket announced plans to open its 70th retail store at Kilifi Complex Centre in Kilifi towards the end of January taking up the 25,000 SQFT space previously occupied by troubled retailer Tuskys;
- Weekly Rates:
- Cytonn Money Market Fund closed the week at a yield of 10.82%. To invest, just dial *809#;
- Cytonn High Yield Fund closed the week at a yield of 13.32% p.a. To invest, email us at sales@cytonn.comand to withdraw the interest you just dial *809#;
- For an exclusive tour of Cytonn’s real estate developments, visit: Sharp Investor's Tourand for more information, email us at sales@cytonn.com;
- We continue to offer Wealth Management Training daily, from 9:00 am to 11:00 am, through our Cytonn Foundation. The training aims to grow financial literacy among the general public. To register for any of our Wealth Management Training, click here;
- If interested in our Private Wealth Management Training for your employees or investment group, please get in touch with us through wmt@cytonn.com;
- We have 10 investment-ready projects, offering attractive development and buyer targeted returns. See further details here: Summary of Investment-ready Projects;
- For recent news about the company, see our news section here.
Money Markets, T-Bills & T-Bonds Primary Auction:
During the month of January, T-bill auctions recorded an under subscription, with the overall subscription rate coming in at 67.3%, a rise from 54.8% recorded in the month of December 2020. The highest subscription rate was in the 364-day paper, which came in at 115.9%, an increase from 50.4% recorded the previous month. The subscription for the 182-day and 91-day papers declined to 33.1% and 45.5% from 40.2% and 94.5% recorded in the month of December 2020, respectively. The yields on the 364-day, 182-day and 91-day papers rose by 0.2% points, 0.3% points and 0.1% points to 8.6%, 7.6% and 7.0%, respectively. The T-bills acceptance rate declined by 0.6% points to 97.6% during the month, compared to 97.1% recorded the previous month, with the government accepting a total of Kshs 78.8 bn of the Kshs 80.8 bn worth of bids received.
During the week, the T-bills subscription rate declined with the overall subscription rate coming in at 66.2%, from 84.5% recorded the previous week. This is attributed to; the continued tightening of liquidity in the money markets. The highest subscription rate was in the 364-day paper which declined to 134.2% from 172.2% recorded the previous week. The subscription for the 182-day paper also declined to 19.7% from 53.7% recorded the previous week, while the 91-day paper increased to 12.7% from 9.2% recorded the previous week. The yields on 364-day and 182-day papers rose by 11.5 bps and 7.0 bps, respectively, to 7.6% and 8.6%, while the 91-day paper declined by 8.6 bps to 7.0%. The government’s accepted all the bids received of Kshs 15.9 bn.
During the month, the Central Bank of Kenya issued two bonds, FXD1/2021/002 and IFB1/2021/016, having effective tenors 2 years and 16 years and with coupons of 9.5% and 12.3%, respectively. The two issues recorded high demand, with the overall subscription rate coming in at 244.6% and 250.7% respectively, mainly supported by the attractive tax-free nature of the infrastructure bond and improved liquidity in the market. In total, the government received bids worth Kshs 186.4 bn, 2.5x higher than the Kshs 75.0 bn offered, and accepted only Kshs 137.0 bn.
For the month of February, the government is seeking to raise Kshs 50.0 bn for budgetary support by reopening two bonds, FXD1/2013/15 and FXD1/2012/20, with a time to maturity of 7.1 and 11.8 years, respectively. The bonds have coupons of 11.3% and 12.0% and are currently trading at a rate of 11.4% and 12.3%, respectively in the secondary market. Given the increased liquidity in the market coupled with the government’s increased appetite for domestic borrowing to bridge the budget deficit, we anticipate an oversubscription and a higher acceptance rate. The bonds will be on offer from 26/01/2021 to 08/02/2021 and we advise the investors to bid at 11.9.0%- 12.2% for FXD1/2013/15 and 12.5%-12.9% for FXD1/2012/20.
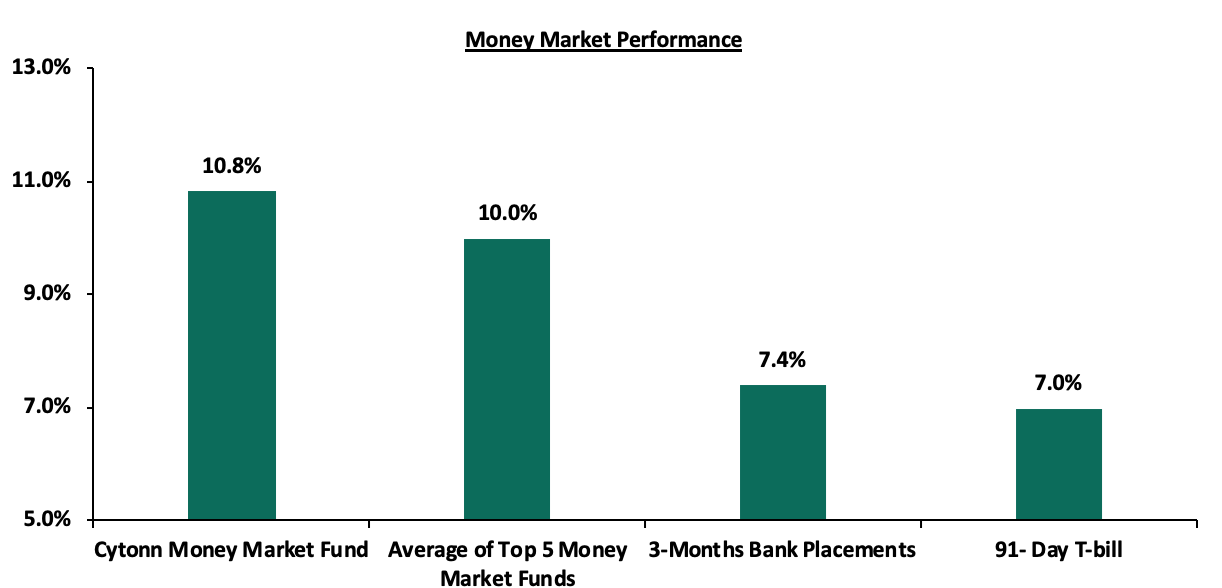
In the money markets, 3-month bank placements ended the week at 7.4% (based on what we have been offered by various banks), while the yield on the 91-day T-bill declined by 8.6 bps to 7.0%. The average yield of the Top 5 Money Market Funds remained unchanged at 10.0% from last week. The yield on the Cytonn Money Market declined marginally by 10.0 bps to 10.8% from the 10.9%, recorded the previous week.
Secondary Bond Market:
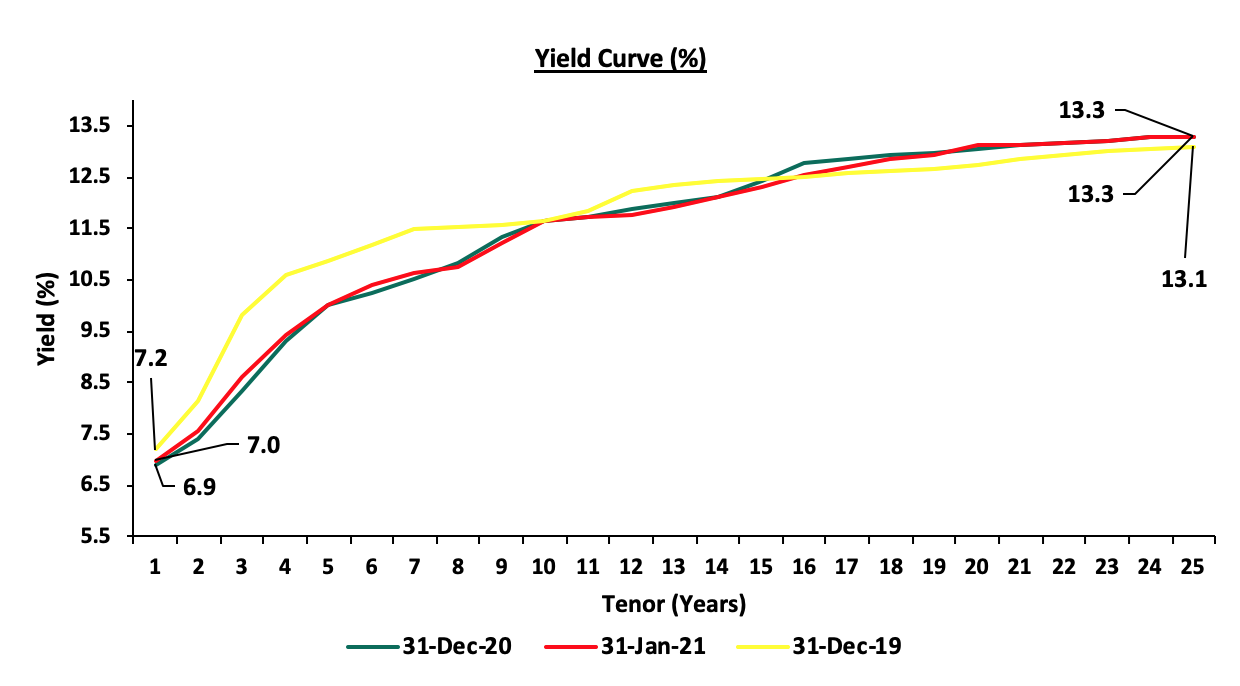
In the Month of January, the yields on government securities in the secondary market remained relatively stable while the bond turnover declined by 17.5% to Kshs 45.5 bn, from Kshs 55.2 bn recorded in December. The FTSE NSE bond index remained unchanged at 98.0 recording a return of 0.0% on YTD.
The chart below is the yield curve movement during the period;
Liquidity:
The liquidity in the money markets tightened during the month of January mainly supported by government payments, with the average interbank rate increasing to 5.7%, from 2.7% recorded in December. During the week, liquidity in the market tightened with the average interbank rate increasing to 5.7% from the 4.3% recorded the previous week, as the government payments were offset by tax remittances. The average interbank volumes increased by 3.1% to Kshs 9.9 bn, from Kshs 9.6 bn recorded the previous week. According to the Central Bank of Kenya’s weekly bulletin, released on 29th January 2021, commercial banks’ excess reserves came in at Kshs 13.7 bn in relation to the 4.25% Cash Reserve Ratio.
Eurobonds performance:
During the month, the yields on all Eurobonds recorded mixed performances. According to Reuters, the yield on the 10-year Eurobond issued in September 2014 declined by 0.3% points to 3.6% in January, from 3.9% in December. The yields on the 10 year Eurobond issued in February 2018 increased marginally by 0.1% points to close at 5.3% in January, from the 5.2% recorded in December. The 30-year Eurobond, on the other hand, increased by 0.2% points to close at 7.2% in January, from the 7.0% recorded in December. The yields on the 2019 issued dual-tranche Eurobond with 7-years declined by 0.1% points to 4.8% in January, from 4.9% in December. The 12-year Eurobond declined by 0.2% points to 6.1% in, from 5.9% in December.
During the week, the yields on Eurobonds recorded mixed performance. According to Reuters, the yields on the 10-year Eurobond issued in June 2014 increased by 0.1% points to 3.6% from 3.7%. On the other hand, , the 10-year bond issued in 2018, the 30-year bond issued in 2018, the 7-year bond issued in 2019, and the 12-year bond issued in 2019 remained unchanged at 5.3%, 7.2%, 4,8%, and 6.1%, respectively.
|
Kenya Eurobond Performance |
|||||
|
|
2014 |
2018 |
2019 |
||
|
Date |
10-year issue |
10-year issue |
30-year issue |
7-year issue |
12-year issue |
|
31-Dec-2020 |
3.9% |
5.2% |
7.0% |
4.9% |
5.9% |
|
22-Jan 2021 |
3.7% |
5.3% |
7.2% |
4.8% |
6.1% |
|
25-Jan-2021 |
3.6% |
5.3% |
7.2% |
4.8% |
6.0% |
|
26-Jan-2021 |
3.6% |
5.3% |
7.1% |
4.8% |
6.0% |
|
27-Jan-2021 |
3.6% |
5.3% |
7.2% |
4.9% |
6.1% |
|
28-Jan-2021 |
3.7% |
5.3% |
7.2% |
4.8% |
6.1% |
|
29-Jan-2021 |
3.6% |
5.3% |
7.2% |
4.8% |
6.1% |
|
Weekly Change |
0.1% |
0.0% |
0.0% |
0.0% |
0.0% |
|
Monthly Change |
(0.3%) |
0.1% |
0.2% |
(0.1%) |
0.2% |
|
YTD Change |
(0.3%) |
0.1% |
0.2% |
(0.1%) |
0.2% |
Source: Reuters
Kenya Shilling:
During the month, the Kenya Shilling depreciated by 0.8% against the US Dollar to close the month at Kshs 110.1, from Kshs 109.2 recorded at the end of December 2020, mostly attributable to the high dollar demand from general importers as businesses resumed following the festive season. During the week, the Kenyan shilling depreciated marginally against the US dollar by 0.3% to Kshs 110.1 from Kshs 109.8 recorded the previous week. On a YTD basis, the shilling has depreciated by 0.9% against the dollar. We expect continued pressure on the Kenyan shilling due to:
- Demand from merchandise traders as they beef up their hard currency positions as businesses reopen following the festive season,
- A slowdown in foreign dollar currency inflows due to reduced dollar inflows from sectors such as tourism and horticulture, and,
- Continued uncertainty globally making people prefer holding dollars and other hard currencies.
However, in the short term, the shilling is expected to be supported by:
- The Forex reserves which are currently at USD 7.7 bn (equivalent to 4.7-months of import cover), which is above the statutory requirement of maintaining at least 4.0-months of import cover, and the EAC region’s convergence criteria of 4.5-months of import cover,
- The improving current account position which narrowed to 4.8% of GDP in the 12 months to December 2020 compared to 5.8% of GDP during a similar period in 2019, and,
- Improving diaspora remittances evidenced by a 19.7% y/y increase to USD 299.6 mn in December 2020, from USD 250.3 mn recorded over the same period in 2019, has cushioned the shilling against further depreciation.
Weekly Highlights
Inflation
The y/y inflation for the month of January 2021 increased to 5.7%, from the 5.6% recorded in December 2020. The increase was due to:
- A 1.3% increase in the Food and Non-Alcoholic Drinks’ Index, mainly contributed by the increase in prices of cooking oil(salad), white bread, and cabbages by 10.4%, 6.6%, and 3.4 %, respectively, among other food items,
- A 0.3% increase in Housing, Water and Electricity, Gas and Other Fuels’ Index, mainly attributed to a 4.2% and 3.2% increase in the cost of kerosene and electricity, respectively, and,
- A 1.1% increase in the Transport Index, mainly driven by a 4.9% and 0.2% increase in pump prices of diesel and petrol, respectively.
The table below shows the key changes in the inflation rates:
|
Major Inflation Changes – January 2021 |
|||
|
Broad Commodity Group |
Price change m/m (January- 20/December -20) |
Price change y/y (January-20/January-19) |
Reason |
|
Food & Non-Alcoholic Beverages |
1.3% |
7.4% |
The m/m increase was mainly contributed by the increase in prices of cooking oil(salad), white bread, and cabbages among other food items |
|
Housing, Water, Electricity, Gas and other Fuel |
0.3% |
3.1% |
The m/m increase was a result of an increase in the cost of kerosene and electricity |
|
Transport Cost |
1.1% |
14.2% |
The m/m increase was mainly on account of an increase in pump prices of diesel and petrol |
|
Overall Inflation |
0.6% |
5.7% |
The m/m increase was due to a 1.3% increase in the food and non-alcoholic drinks’ cost, mainly driven by the increase in prices of food items |
Going forward, we expect the inflation rate to remain within the government’s set range of 2.5% - 7.5% despite the recent increases in fuel prices. Food prices are likely to remain low due to favorable rainfall received.
MPC Meeting January 2021
The Monetary Policy Committee (MPC) met on Wednesday, 27th January 2021, to review the outcome of its previous policy decisions and recent economic developments, and to decide on the direction of the Central Bank Rate (CBR). The MPC retained the CBR at 7.0% which is in line with our expectations MPC January 2021 Note. This is the sixth straight time that the committee is retaining the rate at 7.0% following the rate cut in the first half of 2020. The key highlights from the meeting:
- Inflation remains well anchored, month-on-month overall inflation stood at 5.6% in December 2020 compared to 5.3% in November, and is expected to remain within the target range in the near term, supported by lower food prices and muted demand pressures with the recently introduced tax measures expected to have a modest impact on the overall inflation,
- The banking sector remains stable and resilient, with strong liquidity and good capital adequacy ratios. The ratio of gross non-performing loans (NPLs) to gross loans, however, deteriorated to 14.1% in December compared to 13.6% in October 2020. NPL increases were noted in the transport and communication, trade, real estate and agriculture sectors, mainly due to the disruption of businesses,
- Total loans amounting to Kshs 1.6 tn have been restructured 54.2% of the total banking sector loan book of Kshs 3.0 tn by the end of December. Of the total, restructured loans, personal and household loans amounting to Kshs 333.0 bn (39.6% percent of the gross loans to this sector) have had their repayment period extended. The percentage of loans restructured for the other sectors include trade (21.3%), manufacturing (20.4%), real estate (15.4%) and agriculture (12.4%),
- There has been an increase in lending with cash released following the lowering of the Cash Reserve Ratio (CRR) i.e., Kshs 32.6 bn of the Kshs 35.2 bn has been used to support lending, especially to the tourism, trade and transport and communication, real estate, manufacturing and agriculture sectors, and,
- Private sector credit growth has been recovering having grown by 8.4% in the 12 months to December 2020, as demand recovered with the improved economic activity. Some of the key sectors that benefit from this include manufacturing (12.0%), transport and communications (13.6%), agriculture (15.3%), real estate (8.7%), and consumer durables (18.1%).
- The current account deficit to GDP is estimated to have reduced to 4.8% in 2020 from 5.8% in 2019. Exports of goods have strengthened from the disruptions of COVID-19, growing by 3.3% in 2020 compared to 2019. Receipts from tea exports rose by 10.1% during this period, largely reflecting increased output. Horticulture and flower exports have rebounded, reflecting the normalization of demand in the international market.
The MPC concluded that the current accommodative monetary policies together with the fiscal measures undertaken are still being transmitted to support the economy, and therefore decided to retain the Central Bank Rate (CBR) at 7.0%. The Committee will meet again in March 2021, but remains ready to re-convene earlier if necessary.
Draft 2021 Budget Policy Statement
In line with the process of budget preparation, the National Treasury released on 25th January 2021, the National Treasury released Draft 2021 budget policy statement for public participation. The statement expresses the priority economic policies, structural reforms and the sectoral expenditure programs to be implemented under the Medium Term Expenditure Framework for FY 2021/22– 23/24.
Below is a summary of the major contents as per the BPS 2021 from the revised FY’2020/2021 budget:
|
Comparison of 2020/21 and 2021/22 Fiscal Year Budgets as per The 2021 Budget Policy Statement |
||||
|
FY'2019/2020 Budget Outturn |
FY'2020/2021 Revised Budget |
FY'2021/2022 BPS |
% change 2020/21 to 2021/22 |
|
|
Total revenue |
1,737.0 |
1,829.2 |
1,985.2 |
8.5% |
|
External grants |
19.8 |
48.7 |
46.1 |
(5.3%) |
|
Total revenue & external grants |
1,756.8 |
1,877.9 |
2,031.3 |
8.2% |
|
Recurrent expenditure |
1,645.2 |
1,848.2 |
1,975.2 |
6.9% |
|
Development expenditure & Net Lending |
594.9 |
641.9 |
611.0 |
(4.8%) |
|
County governments + contingencies |
325.3 |
388.0 |
382.6 |
(1.4%) |
|
Total expenditure |
2,565.4 |
2,878.1 |
2,968.8 |
3.2% |
|
Fiscal deficit excluding grants |
(828.5) |
(1,048.9) |
(983.7) |
(6.2%) |
|
Deficit as % of GDP |
8.2% |
9.4% |
7.9% |
(16.0%) |
|
Net foreign borrowing |
340.4 |
427.5 |
345.5 |
(19.2%) |
|
Net domestic borrowing |
450.4 |
572.7 |
592.2 |
3.4% |
|
Total borrowing |
790.8 |
1,000.2 |
937.7 |
(6.2%) |
|
GDP Estimate |
10,156.6 |
11,131.9 |
12,435.7 |
11.7% |
Key take-outs from the table include:
- The 2021 BPS points to a 3.2% increase of the budget, to Kshs 3.0 tn from Kshs 2.9 tn in the FY’ 2020/21 revised budget,
- Recurrent expenditure is set to increase at a higher rate than development expenditure; with recurrent expenditure increasing by 6.9% to Kshs 2.0 tn from Kshs 1.8 tn, while development expenditure is projected to decline by 4.8% to Kshs 611.0 bn from Kshs 641.9 for FY’2020/21 budget,
- The budget deficit is projected to decline to Kshs 983.7 bn (7.9% of GDP) from the projected Kshs 1,048.9 bn (9.4% of GDP) in the FY 2020/21. The reduction is in line with the International Monetary Fund’s (IMF’s) recommendation, in a bid to reduce Kenya’s public debt requirements,
- Total Revenue is projected to increase by 8.2% to Kshs 2.0 tn from Kshs 1.9 tn in FY 2020/21, with measures already in place to work towards increasing the amount of revenue collected in the next fiscal year,
- The total borrowing requirement is expected to decrease by 6.2% to Kshs 937.7 bn from Kshs 1,002.2 bn for the FY 2020/21, in a bid to reduce Kenya’s public debt burden which is estimated at 69.6% of GDP as of December 2020,
- Debt financing of the 2021/22 budget is estimated to consist of 37% foreign debt and 63% domestic debt, which is a slight shift from heavily relying on foreign debt i.e. 43% foreign and 57% domestic for FY’ 2020/21.
Just like governments across the world, the FY'2021/2022 BPS for the next financial year’s budget is projected to be very expansionary as it is expected to steer the country out of the pandemic-driven economic downturn. The budget is however hinged on the premises that the government shall meet the revenue collection targets. It would be however important for the government to factor in the fact that economic recovery is still uncertain. The statement has indicated an increase in government expenditure to key development areas, more so, an increase in allocation to county Governments which will help push the key development agendas. The proposed budget is also set to have a deficit that will be met through a mix of domestic and foreign borrowing which will reach Kshs 937.6 bn with a risk of an even larger figure if the economy does not recover and we result in a revenue collection shortfall. For more analysis please see our Draft 2021 Budget Policy Statement Note
Q3’2020 GDP Growth
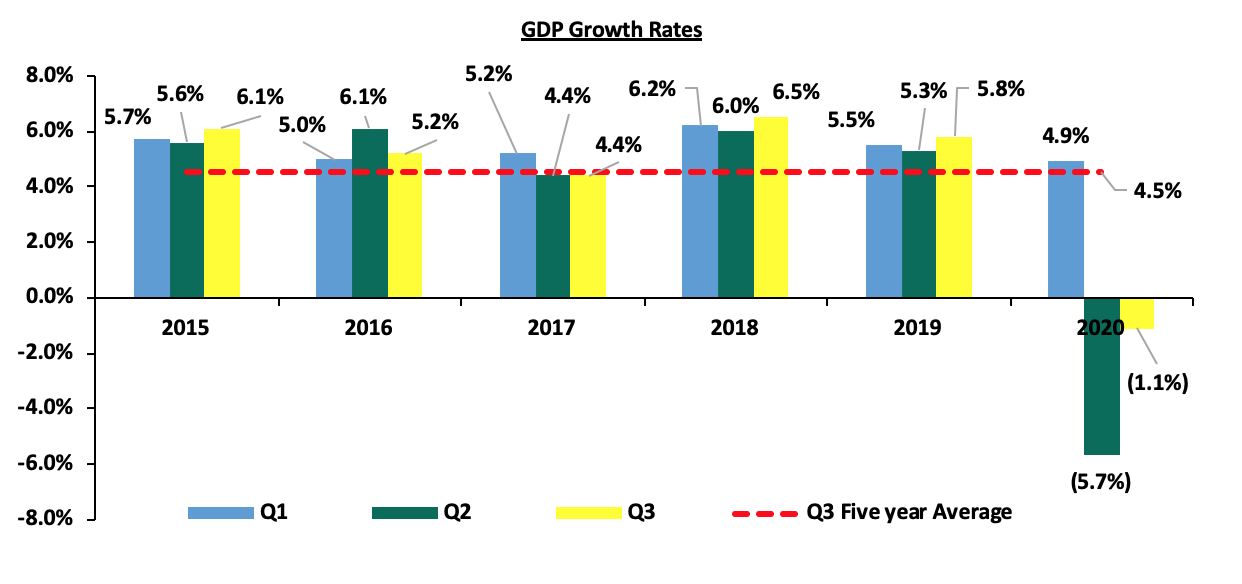
According to the Kenya National Bureau of Statistics (KNBS) Quarterly Gross Domestic Product Report, the Kenyan economy recorded a 1.1% contraction in Q3’2020 down from a growth of 5.8% recorded in a similar period in 2019. This was the second consecutive contraction, following the 5.7% contraction recorded in Q2’2020. Consequently, the average GDP growth rate for the 3 quarters in 2020 is a contraction of 0.6%, a decline from 5.5% recorded during a similar period in 2019. The chart below shows the quarter three GDP growth progression over the last 5 years;
The key take-outs from the report are:
- Accelerated Growth In The Agricultural Sector – Agriculture, Forestry and Fishing activities recorded a growth of 6.3% in Q3’2020 compared to 4.3% in Q3’2019. The sector’s performance was supported by a notable increase in tea production, cane deliveries, milk intake and fruit exports,
- Contraction in the manufacturing sector - The manufacturing sector reported a contraction of 3.2% in Q2’2020 compared to a 4.4% growth in a similar period of review in 2019. The sectoral contribution also declined marginally by 0.2% points to 9.5% from 9.7% in Q3’2019,
- Resilience in the Financial and Insurance sector – The financial and insurance grew by 5.3% compared to 7.6% Q3’2019, as Sectorial Contribution also rose by 0.4% points to 6.9% as at Q3’2020 from 6.5% recorded in Q3’2019,
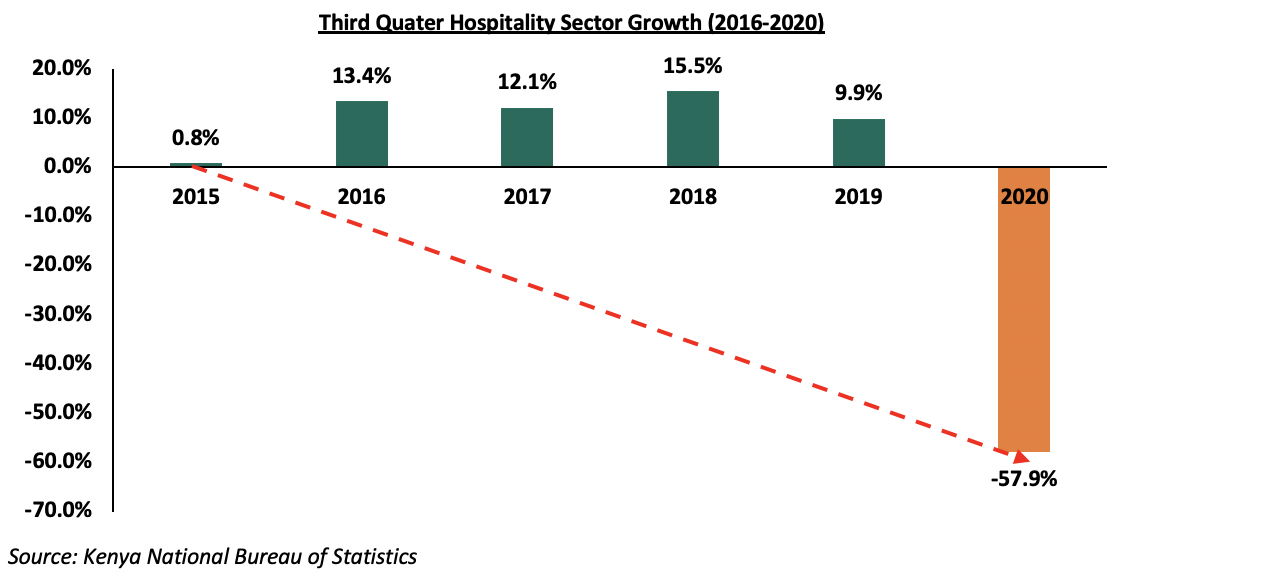
- Huge decline in growth of the Accommodation and food services sector- The sector activities contracted by 57.9% in Q3’ 2020 compared to an expansion of 9.8% in Q3’ 2019. The sectoral contribution fell by 0.8% points to 0.6% from the 1.3% recorded in Q3’2019. This sector was the worst hit by the COVID-19 pandemic as businesses either operated under minimum capacity or completely closed down,
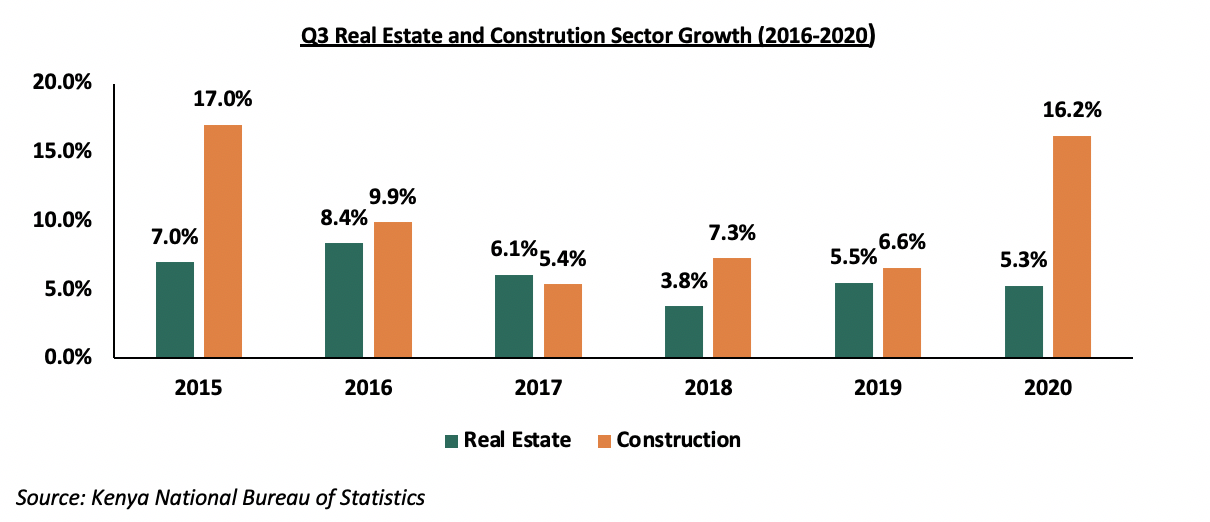
- Growth in the Real Estate and Construction sectors – The real estate and construction sectors recorded growths of 5.3% and 16.2% in Q3’2020 compared to 5.5% and 6.9% in Q3’2019, respectively, cushioning the economic performance from a deeper slump. Key to note the sectoral contribution in Q2’2020 stood at 9.1% and 6.9%, for the real estate and construction sector, respectively, compared to 8.6% and 5.8% in a similar period of review in 2019, and,
- Moderate Growth in the Transport and Storage Sector – The transportation and storage sector grew by 2.9% in Q3’ 2020 compared to 7.2% in Q3’2019. The sector’s contribution to GDP declined marginally to 7.9% from 7.6% recorded in Q3’2019. The improvement in performance was weighed down by air transport and Standard Gauge Railway (SGR) passenger transport which had not picked despite the easing of containment measures, the number of passengers by SGR declined by 77.5%.
Even though the latest GDP figures point to a recession, there was a huge improvement during the quarter in some of the sectors including construction and real estate, as well as the financial and insurance sector. However, some sectors like manufacturing are still feeling the effects of the pandemic as seen in a marginal increase in the December 2020 PMI to 51.4 from the 51.3 recorded in November 2020. Considering the recent reopening of some of the sectors, like education and transport, we expect them to record better performance. Key to note is that agriculture continues to be the main driver of economic growth and as observed in the figures released by the MPC, exports, mostly agricultural produce have rebounded in the later months of 2020, pointing to even larger growth in the coming quarters. A surge in infection and the discovery of new strains of the virus has led to the imposition of new restriction measures in some of the trading partners and is a potential risk. For more analysis please see our Q3’2020 GDP Note.
Q3’2020 Balance of Payment:
The Kenya National Bureau of Statistics released the Quarterly Balance of Payments report for Q3’2020. Kenya’s balance of payments deteriorated in Q3’2020, coming in at a deficit of Kshs 178.0 bn from a surplus of Kshs 13.2 bn in Q3’2019, translating to a balance of payment deficit equivalent to 14.5% of GDP in Q3’2020 from a deficit equivalent to 1.1% of GDP recorded in Q3’2019. The decline was mainly due to the 73.5% decline in the Financial Account balance. The table below shows the breakdown of the various balance of payments components, comparing Q3’2020 and Q3’2019:
|
Q3’2020 Balance of Payments |
|||
|
Item |
Q3’ 2019 |
Q3’2020 |
% Change |
|
Current Account Balance |
(157.9) |
(141.1) |
(10.6%) |
|
Capital Account Balance |
2.8 |
3.9 |
39.7% |
|
Financial Account Balance |
120.9 |
32.1 |
(73.5%) |
|
Net Errors and Omissions |
47.4 |
(72.9) |
|
|
Balance of Payments |
13.2 |
(178.0) |
|
|
GDP at Current Prices (Q3’2020 Quarterly GDP Report by KNBS) |
1,239.4 |
1,226.0 |
(1.1%) |
|
Balance of Payments as a % of GDP |
1.1% |
(14.5%) |
15.6% |
All values in Kshs bns
Key take-outs from the table include;
- The current account deficit (value of goods and services imported exceeds the value of those exported) improved by 10.6% to Kshs 141.1 bn, from Kshs 157.9 bn in Q3’2019, largely due to the narrowing of the Merchandise Trade Balance by 16.1% to Kshs 229.0 bn from Kshs 273.1 bn recorded in Q3’2019,
- The financial account deficit ( a measure of the net capital investments into the country) declined by 73.5% to a surplus of Kshs 32.1 bn, from a surplus of Kshs 120.9 bn in Q3’2019 while the stock of gross official reserves declined by 2.8% to stand at Kshs 951.0 bn from 977.6 bn, and,
- Consequently, the Balance of Payments (BoP) position deteriorated to a deficit of Kshs 178.0 bn from a surplus of Kshs 13.2 bn in Q3’2019, mainly due to the 73.5% decrease in the financial account balance.
Despite the narrowing of the current account position during Q3’2020, the Kenya shilling remained under pressure deteriorating by 4.4% y/y to close the quarter at Kshs 108.5 from Kshs 103.9 at the end of Q3’2019. The forex reserves held by the Central Bank of Kenya declined in the same period to close the quarter at USD 8.6 bn, from USD 9.0 bn recorded at the end of Q3’2019. We expect relative stability in the business environment in the coming quarter given the easing of the lockdown measures by Kenya’s trading partners, promising vaccines, continued support from the tea, coffee and horticulture exports due to the normalized demand in Kenya’s export markets and an improvement in earnings from the tourism sector. For more analysis please see our Q3’2020 BOP Note.
Monthly Highlights
- During the month, Stanbic Bank released the Monthly Purchasing Managers’ Index (PMI) for December 2020, which came in at 51.4, a marginal increase from the 51.3 recorded in November 2020. Output rose at the slowest rate in six months, although new orders growth quickened slightly, expansion was softer than those seen from July to October as the economy recovered from the COVID-19-led downturn. Key to the expansion is the reported improvement in cash flow, looser restrictions, and higher customer orders. The month recorded stronger sales leading to a renewed increase in backlogs of work at the end of the year, which supported a third successive monthly rise in employment. For more information, see our, Cytonn Weekly 01#/2021.
Rates in the fixed income market have remained relatively stable due to the high liquidity in the money markets, coupled with the discipline by the Central Bank as they reject expensive bids. The government is 14.5% ahead of its prorated borrowing target of Kshs 271.2 bn having borrowed Kshs 310.4 bn. In our view, due to the current subdued economic performance brought about by the effects of the COVID-19 pandemic, the government will record a shortfall in revenue collection with the target having been set at Kshs 1.9 tn for FY’2020/2021 thus leading to a larger budget deficit than the projected 7.5% of GDP, ultimately creating uncertainty in the interest rate environment as additional borrowing from the domestic market may be required to plug the deficit. Owing to this uncertain environment, our view is that investors should be biased towards short-term to medium-term fixed income securities to reduce duration risk.
Markets Performance
During the month of January, the equities market was on an upward trajectory, with NASI, NSE20 and NSE 25 gaining by 2.3%, 0.7% and 0.6%, respectively. The equities market performance was driven by gains recorded by large cap stocks such as BAT, Bamburi and Safaricom, which gained by 12.5%, 11.1% and 4.7%, respectively. The gains were however weighed down by losses recorded by banking stocks such as NCBA Group, KCB Group and Standard Chartered Bank, which declined by 7.5%, 5.9% and 4.0%, respectively.
During the week, the equities market was on a downward trajectory, with NSE 20 declining by 2.0% while both NASI and NSE 25 declined by 1.6%, taking their YTD performance to gains of 2.3%, 0.5%, and 0.7%, for NASI, NSE 20 and NSE 25, respectively. The equities market performance was mainly driven by losses recorded by large-cap stocks such as Bamburi, NCBA Group, Equity Group and ABSA Bank of 8.7%, 2.6%, 1.9%, and 1.5%, respectively. The losses were however mitigated by gains recorded by large-cap stocks such as Diamond Trust Bank (DTB-K), BAT and Safaricom, which gained by 4.1%, 2.1% and 0.8%, respectively.
Equities turnover declined by 12.7% during the month to USD 80.5 mn, from USD 92.3 mn recorded in December 2020. Foreign investors turned net buyers during the month, with a net buying position of USD 5.6 mn, compared to December’s net selling position of USD 3.2 mn.
During the week, equities turnover declined by 5.0% to USD 22.9 mn, from USD 24.1 mn recorded the previous week, taking the YTD turnover to USD 80.5 mn. Foreign investors remained net buyers, with a net buying position of USD 0.7 mn, from a net buying position of USD 0.2 mn recorded the previous week, taking the YTD net buying position to USD 5.6 mn.
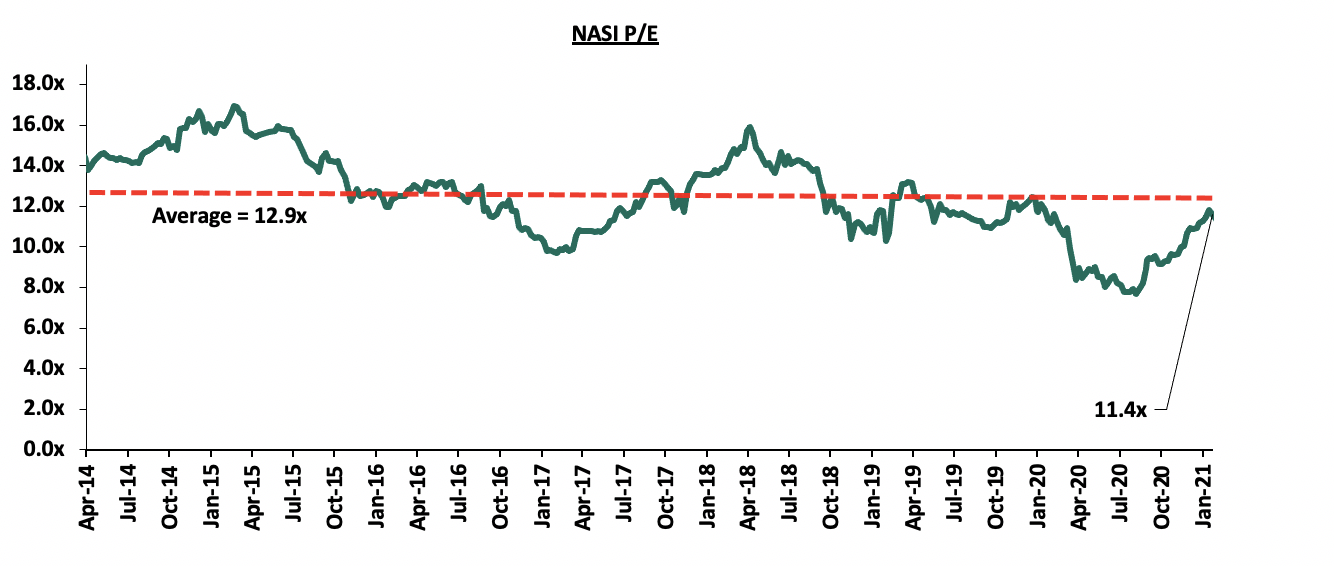
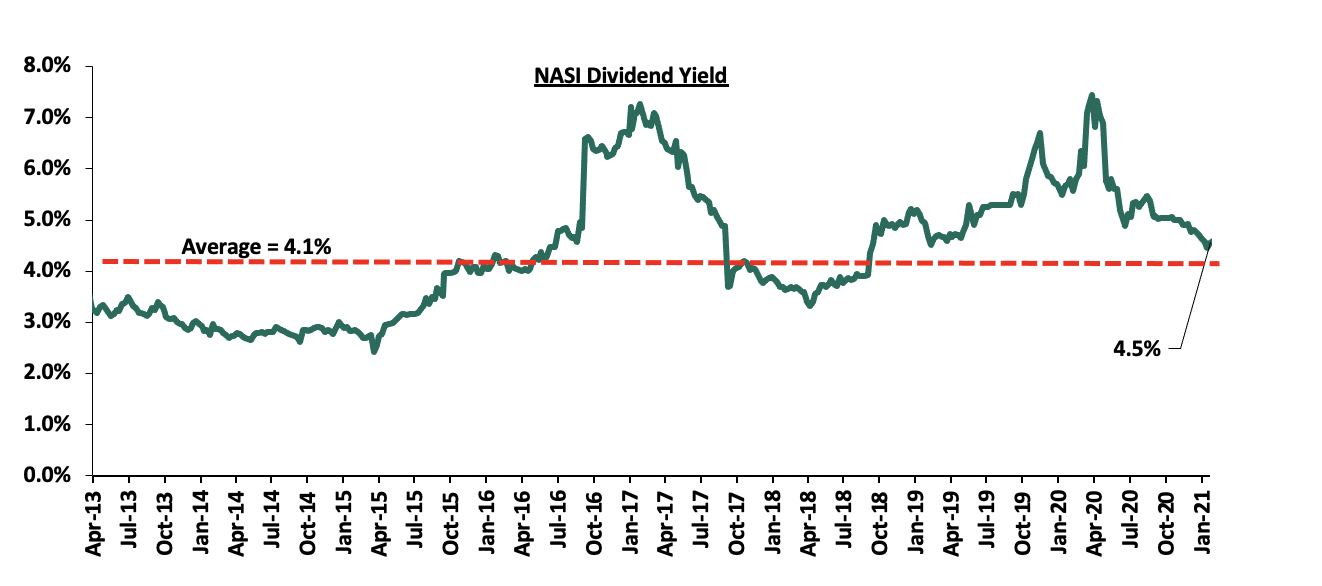
The market is currently trading at a price to earnings ratio (P/E) of 11.4x, 12.0% below the 11-year historical average of 12.9x. The average dividend yield is currently at 4.5%, 0.1% points below what was recorded the previous week, and 0.4% points above the historical average of 4.1%.
With the market trading at valuations below the historical average, we believe there are pockets of value in the market for investors with higher risk tolerance and are willing to wait out the pandemic. The current P/E valuation of 11.4x is 47.7% above the most recent trough of 7.7x experienced in the first week of August 2020. The charts below indicate the historical P/E and dividend yields of the market.
Monthly Highlight:
- The Insurance Regulatory Authority (IRA), recently released the Q3’2020 Insurance Industry Report highlighting that the industry’s gross premium rose by 2.6% to Kshs 179.4 bn, from Kshs 174.9 bn recorded in Q3’2019, with the general insurance business contributing to 58.6% of the industry’s premium income, a 1.6% points decline from the 60.2% contribution witnessed in Q3’2019. The regulator noted that the COVID-19 pandemic had impacted the insurance sector mainly through reduced returns from the capital markets and a rise in insurance claims in the long term insurance business class. For more information, please see Cytonn Weekly#03/2021.
Universe of Coverage
|
Company |
Price at 22/01/2021 |
Price at 29/01/2021 |
w/w change |
YTD Change |
Year Open |
Target Price* |
Dividend Yield |
Upside/ Downside** |
P/TBv Multiple |
Recommendation |
|
Diamond Trust Bank*** |
73.0 |
76.0 |
4.1% |
(1.0%) |
76.8 |
105.1 |
3.6% |
41.8% |
0.3x |
Buy |
|
KCB Group*** |
36.0 |
35.9 |
(0.4%) |
(6.6%) |
38.4 |
46.0 |
9.8% |
38.1% |
1.0x |
Buy |
|
Kenya Reinsurance |
2.5 |
2.5 |
(1.6%) |
6.9% |
2.3 |
3.3 |
4.5% |
38.1% |
0.3x |
Buy |
|
I&M Holdings*** |
46.0 |
47.0 |
2.2% |
4.8% |
44.9 |
60.1 |
5.4% |
33.3% |
0.7x |
Buy |
|
Liberty Holdings |
7.4 |
7.5 |
1.1% |
(2.6%) |
7.7 |
9.8 |
0.0% |
30.7% |
0.6x |
Buy |
|
Sanlam |
14.0 |
13.0 |
(7.1%) |
0.0% |
13.0 |
16.4 |
0.0% |
26.2% |
1.1x |
Buy |
|
ABSA Bank*** |
9.5 |
9.3 |
(1.5%) |
(2.1%) |
9.5 |
10.5 |
11.8% |
24.5% |
1.2x |
Buy |
|
Equity Group*** |
37.2 |
36.5 |
(1.9%) |
0.7% |
36.3 |
43.0 |
5.5% |
23.3% |
1.1x |
Buy |
|
Co-op Bank*** |
12.6 |
12.6 |
0.0% |
0.4% |
12.6 |
14.5 |
7.9% |
23.0% |
1.0x |
Buy |
|
Standard Chartered*** |
138.8 |
138.5 |
(0.2%) |
(4.2%) |
144.5 |
153.2 |
9.0% |
19.6% |
1.1x |
Accumulate |
|
Britam |
7.5 |
7.5 |
(0.8%) |
6.6% |
7.0 |
8.6 |
3.4% |
18.6% |
0.8x |
Accumulate |
|
Jubilee Holdings |
280.0 |
280.0 |
0.0% |
1.5% |
275.8 |
313.8 |
3.2% |
15.3% |
0.7x |
Accumulate |
|
Stanbic Holdings |
77.8 |
80.0 |
2.9% |
(5.9%) |
85.0 |
84.9 |
8.8% |
14.9% |
0.8x |
Accumulate |
|
NCBA*** |
25.4 |
24.8 |
(2.6%) |
(7.0%) |
26.6 |
25.4 |
1.0% |
3.6% |
0.7x |
Lighten |
|
CIC Group |
2.2 |
2.1 |
(3.7%) |
(1.9%) |
2.1 |
2.1 |
0.0% |
1.4% |
0.8x |
Lighten |
|
HF Group |
3.9 |
3.9 |
(0.8%) |
22.9% |
3.1 |
3.0 |
0.0% |
(22.3%) |
0.1x |
Sell |
|
*Target Price as per Cytonn Analyst estimates **Upside/ (Downside) is adjusted for Dividend Yield ***Banks in which Cytonn and/ or its affiliates are invested in |
||||||||||
We are “Neutral” on the Equities markets in the short term. We expect the recent discovery of a new strain of COVID-19 coupled with the introduction of strict lockdown measures in major economies to continue dampening the economic outlook. However, we maintain our bias towards a “Bullish” equities markets in the medium to long term. We believe there exist pockets of value in the market, with a bias on financial services stocks given the resilience exhibited in the sector. The sector is currently trading at historically cheaper valuations and as such, presents attractive opportunities for investors.
- Industry Reports
During the month, the Kenya National Bureau of Statistics (KNBS), released the Quarterly Gross Domestic Product Report-Q3’2020, highlighting that;
- Growth in real estate and construction activities came in at 5.3% and 16.2%, respectively, compared to 5.5% and 6.6% growth in 2019 same period under review. In our view, the growth was supported by increased development activities on the affordable housing front by both the government and private developers, and the gradual reopening of the economy in Q3’2020. The growth of the real estate and construction sector is also evidenced by the 23.5% increase in the volume of cement consumed from 1.5 mn metric tonnes in Q3’2019 to 1.9mn metric tonnes in Q3’2020. The chart below shows the sectors’ five-year performance,
- The hospitality sector growth declined by 57.9% in Q3’2020 compared to an expansion of 9.9% during the same period in 2019. This is mainly attributed to the adverse effects of the COVID-19 pandemic which saw the implementation of measures to contain the spread of the virus leading to hospitality facilities scaling down operations and complete closure in some facilities, and,
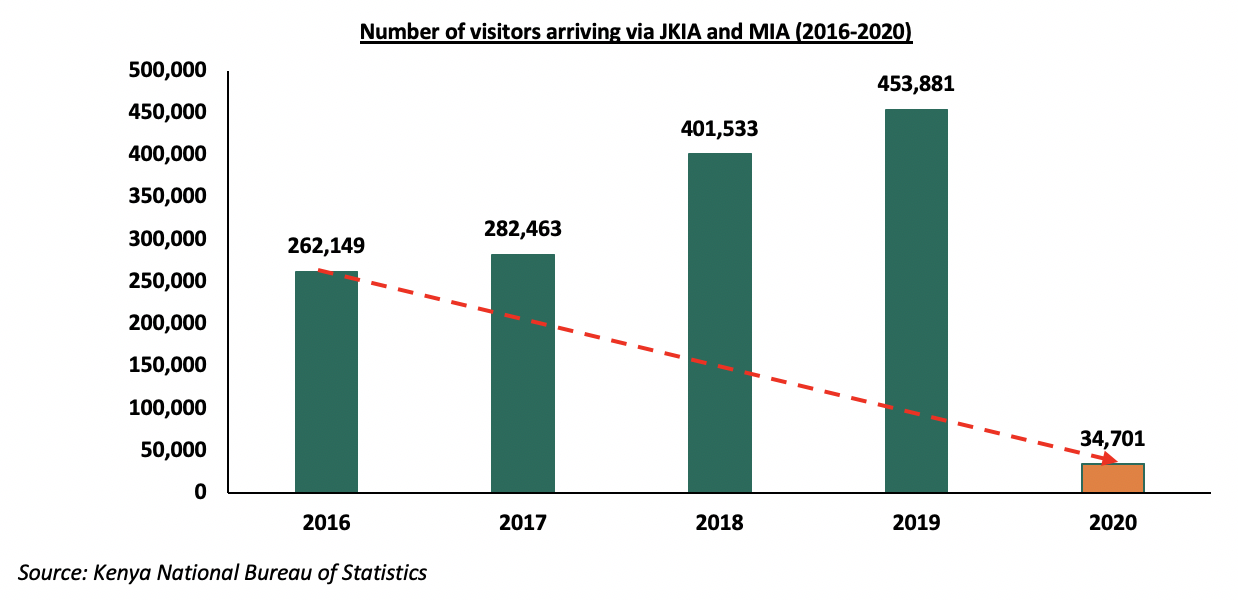
- The total number of visitors arriving through Jomo Kenyatta International Airport (JKIA) and Moi International Airport (MIA) declined by 92.4% from 453,881 passengers in Q3’2019 to 34,701 passengers in Q3’2020, attributable to minimal international flights in a bid to minimize the spread of the virus during the period under review,
- Residential Sector
- British Foreign Secretary Dominic Raab announced that Kenya is expected to receive at least Kshs 8.0 bn from the United Kingdom to finance the construction of approximately 10,000 affordable houses through Acorn Holdings, a local real estate developer. The funds which will be released in tranches will consist of Kshs 1.0 bn from UK funded InfraCo and another Kshs 7.0 bn from private investors. The investment affirms UK’s government’s support for the Big Four Agenda on affordable housing that is aimed at delivering affordable homes for Kenyans. For more analysis, please see Cytonn Weekly #03/2021.
The continued focus on the affordable housing sector is expected to shape the performance of the residential sector. Nevertheless, the COVID-19 pandemic continues to constrain the sector’s performance.
- Retail Sector
Giordano, a Hong Kong clothing retailer, opened its 3rd store in Nairobi at Two Rivers Mall along Kiambu Road, taking up 1,076 SQFT space. The two other outlets by the retailer which were opened in 2020 are located at the Garden City Mall along Thika Road and at the Junction Mall along Ngong Road. The retailer aims to capitalize on the growing Kenyan luxury-goods consumer market. The decision to open the branch at Two Rivers Mall being supported by; i) the strategic positioning of the mall with affluent neighborhoods such as Ridgeways and Gigiri hosting middle to high-income earners with relatively high purchasing power, ii) relatively good infrastructure as the area is mainly served by the Northern-by pass, Kiambu Road and Limuru road, and, iii) high footfall into the mixed-use development.
French retailer Carrefour launched a new mobile application that is expected to enhance the online shopping experience for its Kenyan customers. The MAF (Majid Al Futtaim) Carrefour application is intended to provide Carrefour customers with a seamless shopping experience with a focus on convenience giving them the opportunity to quickly and conveniently purchase items through a digital platform. The application is expected to offer more than 8,000 items including groceries, fresh food, and household products among others. The step taken by Carrefour signals the growing popularity of e-commerce and reduced demand for physical shopping spaces as businesses scale down in the wake of the COVID-19 pandemic. Retailers are embracing online shopping and this is evident by the 8.6% growth in internet subscription rates according to Economic Survey 2020. This has further been enabled by mobile wallets gaining popularity, hence making online shopping more convenient.
Some of the factors expected to cushion the retail sector’s growth in Kenya despite the declines in performance include; i) continued improvement of infrastructure opening up areas for investment, ii) rapid urbanization and population growth rates of around 4.0% and 2.2%, respectively against a global average of 1.9% and 1.1%, iii) investor confidence due to the ease of doing business in Kenya, having been ranked position #56 by World Bank in the ease of doing business, and, iv) the growing middle class with increased purchasing power.
A notable highlight in the sector during the month;
- Naivas Supermarket announced plans to open its 70th retail store at Kilifi Complex Centre in Kilifi towards the end of January taking up the 25,000 SQFT space previously occupied by troubled retailer Tuskys. This follows the opening of other outlets such as Ananas Mall in Thika, Hazina Towers, and Prestige Plaza among others. For more analysis, please see Cytonn Weekly #03/2021.
The table below shows the summary of the number of stores of the key local and international retail supermarket chains in Kenya;
|
Main Local and International Retail Supermarket Chains |
||||||
|
Name of Retailer |
Initial number of branches |
Number of branches opened in 2021 |
Closed branches |
Current number of Branches |
Branches expected to be opened / closed |
Projected total number of branches 2021 |
|
Naivas Supermarket |
69 |
0 |
0 |
69 |
1 |
70 |
|
Tuskys |
52 |
0 |
14 |
52 |
27 |
25 |
|
QuickMart |
35 |
0 |
0 |
35 |
0 |
35 |
|
Chandarana Foodplus |
20 |
0 |
0 |
20 |
0 |
20 |
|
Carrefour |
8 |
0 |
0 |
8 |
3 |
11 |
|
Uchumi |
37 |
0 |
33 |
4 |
0 |
4 |
|
Game Stores |
3 |
0 |
0 |
3 |
0 |
3 |
|
Choppies |
15 |
0 |
13 |
2 |
0 |
2 |
|
Shoprite |
4 |
0 |
2 |
2 |
0 |
2 |
|
Nakumatt |
65 |
0 |
65 |
0 |
0 |
0 |
|
Total |
308 |
0 |
127 |
195 |
31 |
172 |
Source: Online Research
We expect the continued entry and expansion of local and international retailers to support the performance of the retail sector, however, the growing focus on e-commerce is expected to negatively impact the sector exacerbating the reduced demand for physical retail spaces in the wake of the pandemic.
- Statutory Reviews
During the month, Kenya’s National Treasury announced plans to draft a national property rating legislation to replace the outdated Valuation for Rating Act of 1956 and the Rating Act of 1963. The agency seeks to overhaul the 1956 property valuation laws in a bid to determine new land rates and ensure the inclusion of more property owners into the tax bracket. For more analysis, please see Cytonn Weekly #01/2021.
- Infrastructure
During the month, the National Treasury proposed an allocation of Kshs 200 bn to the State Department of Infrastructure, which is in charge of the development of roads, railways, and other infrastructure. The proposal is expected to increase the budget allocation to the infrastructure sector by 16.0% from Kshs 172.4 bn allocated in the financial year 2020/2021. The current budget allocation of Kshs 172.4 bn was the lowest in the last 10 financial years and this was mainly due to the expected revenue shortfall due to the COVID-19 pandemic which prompted diversion of funds towards the mitigation of the pandemic.
The graph below shows the budget allocation to the infrastructure sector over the years;

We expect the proposed increase in the infrastructure budget allocation to fuel the launch of new infrastructural projects thus opening up areas for development hence boosting the real estate sector. This will be in line with the country’s economic expansion goals to make Kenya the African hub for transportation, industrial, and services sectors. Despite the reduced budget allocation to the sector during the 2020/2021 financial year, the government has continued to launch infrastructural projects with some of the notable projects being; i)the Nairobi Expressway, ii) Nairobi Western Bypass, iii) Lamu Port Access Road, and, iv) the Mombasa Port Development Project among others.
- Listed Real Estate
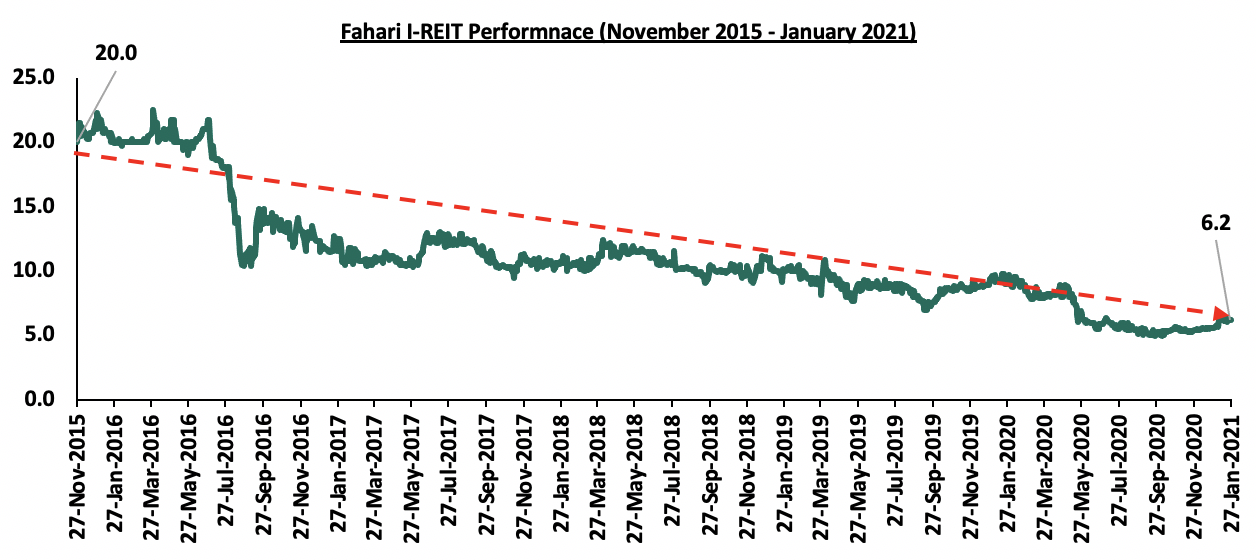
During the month of January, the Fahari I-REIT closed the month at Kshs 6.2 per share, trading at an average of Kshs 6.2 during the month, a 35.4% loss of value from Kshs 9.6 recorded during the same period in 2020, and 69.0% drop from its initial price of Kshs 20.0 in November 2015. The REIT is expected to continue recording subdued performance due to; i) declining performance of the real estate market, ii) insufficient institutional-grade real estate assets, iii) lack of investor appetite in the instrument, and iv) negative investor sentiments.
We expect real estate sector performance to be supported by; i) increased activities in the residential sector in support of the affordable housing agenda, ii) entry and expansion by local and international retailers, iii) statutory reforms streamlining the land sector transactions, and, iv) expected improvements in the implementation of infrastructure projects.
Disclaimer: The views expressed in this publication are those of the writers where particulars are not warranted. This publication, which is in compliance with Section 2 of the Capital Markets Authority Act Cap 485A, is meant for general information only and is not a warranty, representation, advice or solicitation of any nature. Readers are advised in all circumstances to seek the advice of a registered investment advisor.
- Talk to us
- Kenya
- P.O Box 20695 - 00200, Nairobi, Kenya
- Cell +254(0) 709 101 000
- Tel +254(0) 20 3929 000
- WhatsApp +254(0) 748 070 000
- United States
- +1 (240) 368-6217
- DOWNLOAD OUR APP
-


- Kenya
- Cysuites work spaces, Church Rd, Westlands, Nairobi, Kenya
- USA
- Suite 1150, 1775 Eye Street NW, USA, Washington DC 20006, USA
- Investments
- High Yield
- Private Equity
- Real Estate
- Real Estate
- RiverRun Estates
- Cytonn Towers
- The Ridge
- Taraji Heights
- The Alma