


FXOpen
Both Bitcoin and Litecoin and slowly inching closer to the top of their respective ranges. Big brother bitcoin advanced by just over $8 dollars since our last update. Meanwhile Litecoin clocked gains of 18 cents or 6% in percentage terms.
Bitcoin Rallies by $8 Dollars
Bitcoin rallied slightly by $8 dollars or 3.6 percent since last Tuesday. In today’s trading session, a new multi-day high of $237.69 was reached. But soon after the congestion curse struck again with BTC/USD falling to a daily low of $234. We are currently quoted at $236.50 dollars.
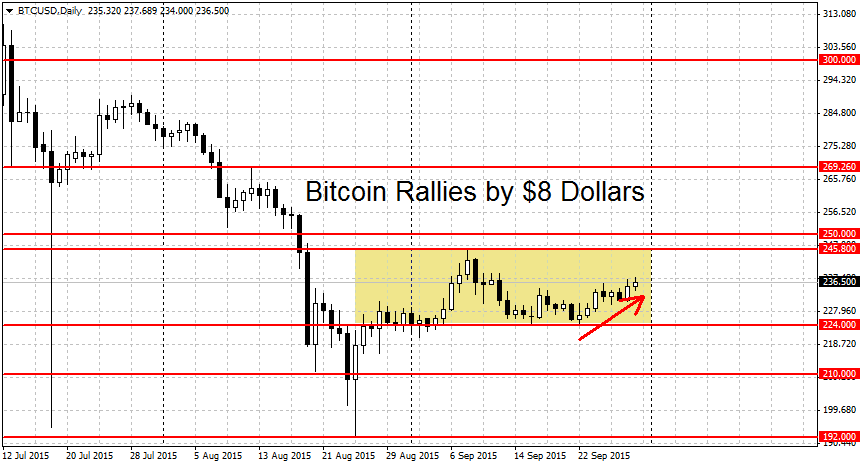
But as can be seen on the chart above, despite the gains, we are still firmly in a range (marked with the yellow rectangle). The bounds of this congestion area are loosely set at $224 and $246 dollars per coin. Note that these are not breakout bounds. Due to the propensity of range-bound markets to generate false breaks, it’s a good idea to add some buffer.
At the top, a better level for a breakout is the round $250 level. This was the starting point for both the previous rally and the subsequent decline. It’s probably still relevant and a clean break above here may start a new BTC rally. On the lower end, we have several weaker support levels below $224, at $220 and $216. But even lower we find the previous double bottom for bitcoin at $210 dollars. A decisive breakdown below this figure may jump-start a new downtrend in prices.
Litecoin Gains 6 Percent
Alternative cryptocurrency Litecoin gained 6 percent since our last update. We bottomed out at $2.70 on September 16th and since then it has been a slow but steady grind higher. Today we peaked at $3.1223, almost breaking the previous swing high at $3.1241. This high marks the top of the range for LTC/USD.
However same as with bitcoin, soon after the highs were reached we saw heavy selling. This type of behavior is normal during congestion phases as market participants start to sell the tops and buy the bottoms. Litecoin has fallen substantially by 12 cents, or just under 4 percent since today’s peak.
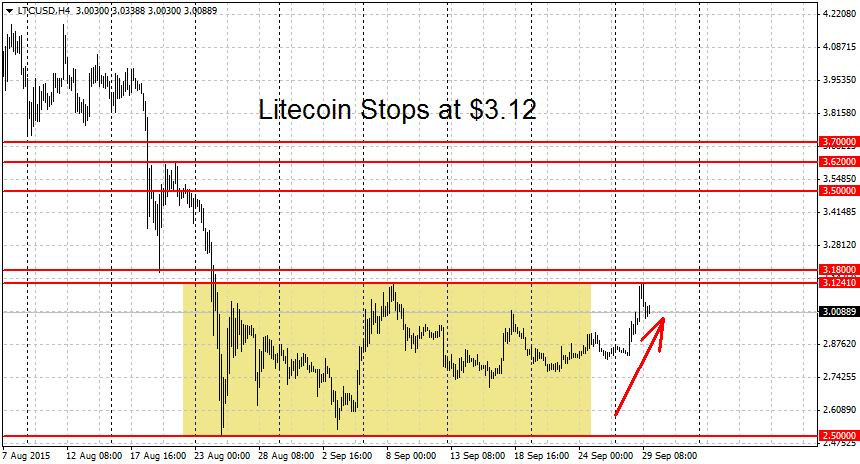
As we can see on the chart above, the rough outlines of the range are at $2.50 and $3.1241. But like we mentioned above, it’s a good idea to add some buffer. For Litecoin, a better breakout point of the upside is the $3.17-$3.1840 area. Here we have a cluster of previous support and resistance levels. A clean move above $3.19 may end the current range and start a LTC rally. Higher up, resistance can be found at the round $3.50 handle, followed by the previous swing high at $3.62.
On the bottom, while the low of the range is at $2.50, right after we find another important support at $2.40 dollars per coin. A decisive break below this level may lead to more losses. Further down, we have support at $2.05, followed by the round $2 dollars figure.
FXOpen offers the world's most popular cryptocurrency CFDs*, including Bitcoin and Ethereum. Floating spreads, 1:2 leverage — at your service. Open your trading account now or learn more about crypto CFD trading with FXOpen.
*At FXOpen UK and FXOpen AU, Cryptocurrency CFDs are only available for trading by those clients categorised as Professional clients under FCA Rules and Professional clients under ASIC Rules respectively. They are not available for trading by Retail clients.
This article represents the opinion of the Companies operating under the FXOpen brand only. It is not to be construed as an offer, solicitation, or recommendation with respect to products and services provided by the Companies operating under the FXOpen brand, nor is it to be considered financial advice.
Latest articles

Anchored VWAP and How You Can Use It in Forex Trading
In the world of forex trading, understanding the nuanced tools at your disposal can significantly enhance decision-making processes. One such sophisticated tool is the Anchored Volume-Weighted Average Price (Anchored VWAP), which refines the standard VWAP by allowing traders to set

META Share Price Collapses after Publication of Quarterly Report
Just yesterday, META's stock price closed at USD 493.50, up approximately 40% since the start of 2024 and up nearly 300% since the start of 2023.
However, following the release of Meta's quarterly report, its shares plummeted to USD

USD/JPY Analysis: The Rate Exceeds The Level of 155 Yen Per US Dollar
Today, the price of USD/JPY once again renewed its 34-year high, exceeding the level of 155 yen per dollar, which put pressure on the current authorities.
According to Reuters, officials are trying to maintain calm in the market.
"We