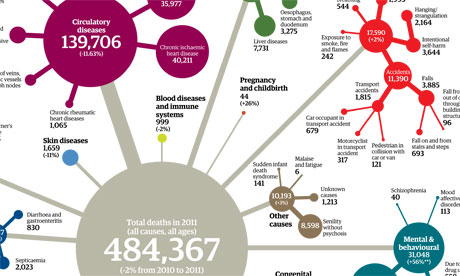

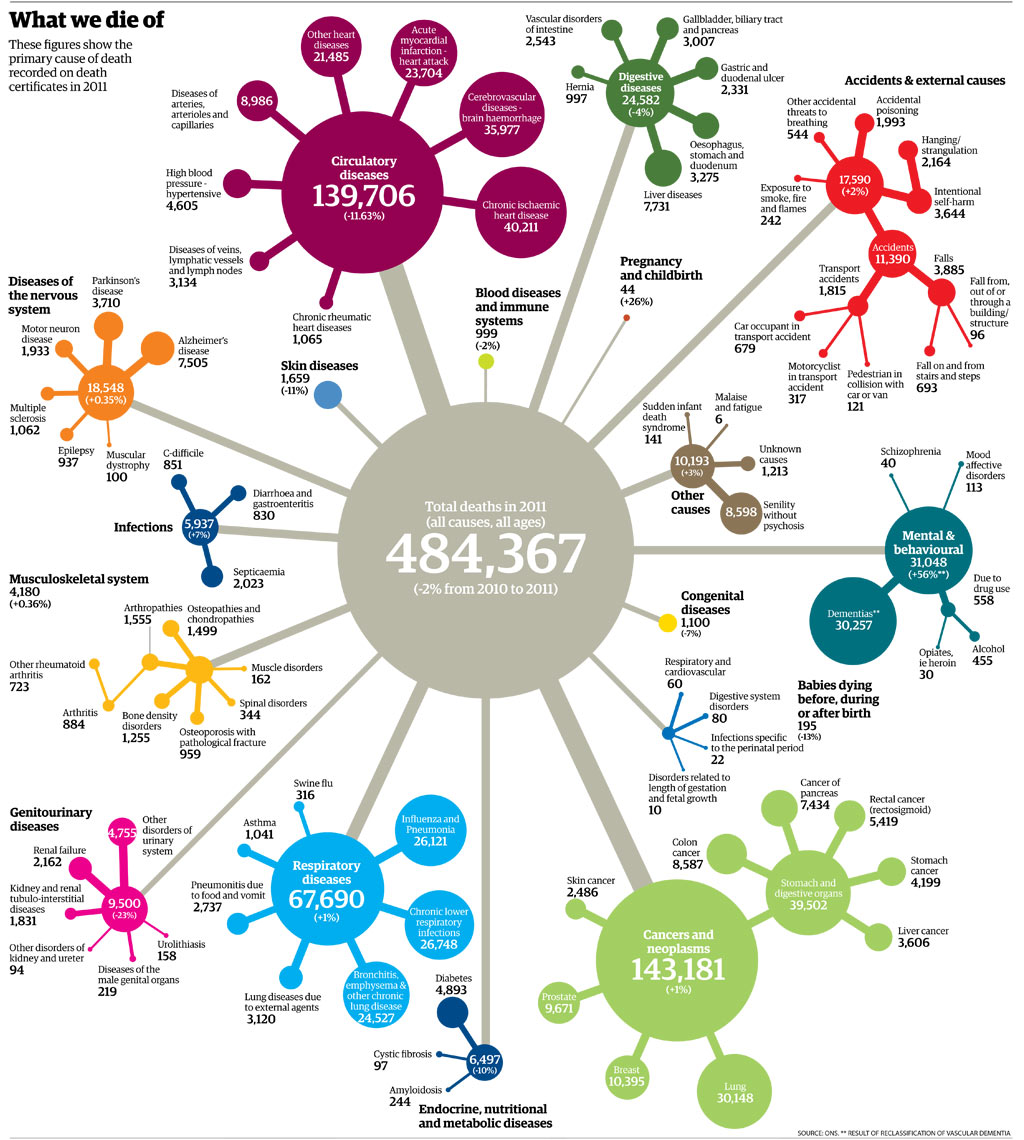
It may happen to all of us eventually, but fewer of us are dying right now than at any time since mortality data was collected. In a dramatic report the latest figures also show that more people are dying of cancer than of circulatory diseases, for the first time since the data was recorded.
The latest figures from the Office for National Statistics show there were 484,367 deaths registered in England and Wales in 2011, a fall of 1.8% compared with 2010. The age-standardised mortality rates (which takes account of aging population) in 2011 were the lowest ever recorded for England and Wales, at 6,236 deaths per million population for males and 4,458 deaths per million population for female.
Cancer death rates have fallen by 14% for men and 10% for women in the previous decade.
And between 2001 and 2011, the death rates for circulatory diseases fell by 44% to 1,803 deaths per million population for males and 1,110 deaths per million population for females.
We may worry about murders or swine flu, but the big killers of heart disease and cancer are much more significant in terms of public health. What is also striking is how constant many of these numbers of deaths are - why do around 17,000 people die each year in accidents, for instance? Why do around 200 people accidentally drown every year?
Besides the graphic above (which you can download as a PDF), we've summarised two of the datasets below: major causes of death and deaths from external causes - ie, accidents or assaults. If you want to find out how many people died after being bitten by dogs or falling off ladders, this is the place to look.
And, whatever we may worry about, this is one of the safest times to be alive, ever - as the chart below shows.
The data itself comes from death certificates and records the primary cause of death - which is why the influenza numbers are lower than other estimates. If you get flu, which then lowers your resistance enough for pneumonia to kill you, for instance, pneumonia would be the main cause of death recorded.
The data also includes regional figures too:
• The north east had a 12% higher mortality rate than the rest of the country using the standardised mortality ratio (SMR) calculation
• Levels were lowest in London and the south east, where they were 7% below the nation
• Manchester was the local authority with the highest SMR, at 32% above the national, while South Cambridgeshire's was 26% below
• In Wales, Blaenau Gwent had the highest SMR, 29% above the national level, while Monmouthshire had the lowest, at 10% below.
• The West Midlands had the highest regional infant mortality rate, with 6.0 deaths per thousand live births, and the south east had the lowest, with 3.5 deaths per thousand live births
• Wales had an infant mortality rate of 3.9 deaths per thousand live births
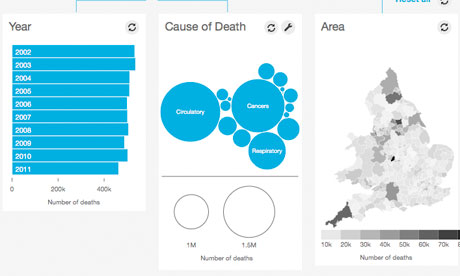 Mortality interactive
Dataseed has visualised each years' data with its interactive guide.
Can you do something better? The full data is below for you to download.
Data summary
Major causes of death, 2011
Click heading to sort table. Download this data
|
Cause of death
|
2011 TOTAL
|
MALE
|
FEMALE
|
% change, 2010-11
|
% change, 2007-11
|
|
|
| All causes, all ages |
484,367 |
234,660 |
249,707 |
-2 |
-4 |
| All causes, ages under 28 days |
2,203 |
1,288 |
915 |
3 |
-3 |
| All causes, ages 28 days and over |
482,164 |
233,372 |
248,792 |
-2 |
-4 |
| Cancers and neoplasms |
143,181 |
75,323 |
67,858 |
1 |
2 |
| Circulatory diseases |
139,706 |
69,587 |
70,119 |
-12 |
-18 |
| Respiratory diseases |
67,690 |
32,033 |
35,657 |
1 |
-2 |
| Mental and behavioural disorders** |
31,048 |
10,088 |
20,960 |
56 |
87 |
| Digestive diseases |
24,582 |
11,909 |
12,673 |
-4 |
-4 |
| Diseases of the nervous system |
18,548 |
8,398 |
10,150 |
0.35 |
13 |
| Death not caused by disease |
17,590 |
11,013 |
6,577 |
2 |
1 |
| Other causes |
10,193 |
2,624 |
7,569 |
3 |
-8 |
| Genitourinary diseases |
9,500 |
3,935 |
5,565 |
-23 |
-16 |
| Endocrine, nutritional and metabolic diseases |
6,497 |
2,989 |
3,508 |
-10 |
-10 |
| Infectious and parasitic diseases |
5,410 |
2,392 |
3,018 |
7 |
-34 |
| Musculoskeletal system |
4,180 |
1,391 |
2,789 |
0.36 |
-3 |
| Skin diseases |
1,659 |
553 |
1,106 |
-11 |
-9 |
| Congenital diseases and chromasomal abnormalities |
1,100 |
558 |
542 |
-7 |
-11 |
| Blood diseases and immune systems |
999 |
442 |
557 |
-2 |
-3 |
| Babies dying before, during or after birth |
195 |
117 |
78 |
-13 |
8 |
| Pregnancy and childbirth |
44 |
|
44 |
26 |
-6 |
| Diseases of the ear and mastoid process |
23 |
12 |
11 |
15 |
77 |
| Diseases of the eye and adnexa |
19 |
8 |
11 |
73 |
171 |
Accidents and external causes
Click heading to sort table. Download this data
|
Cause
|
Type
|
MALE
|
FEMALE
|
2011
|
2007
|
% change, 2007-2011
|
|
|
| External causes of morbidity |
TOTAL |
11,013 |
6,577 |
17,590 |
17,420 |
0.98 |
| Death from injury or poisoning, not known if deliberate or not |
TOTAL |
268 |
102 |
370 |
420 |
-11.90 |
| Accidents total |
Acc. |
6,452 |
4,938 |
11,390 |
11,809 |
-3.55 |
| Transport accidents total |
Acc., transport |
1,380 |
435 |
1,815 |
2,968 |
-38.85 |
| Pedestrian injured in transport accident |
Acc., transport, pedest. |
261 |
104 |
365 |
645 |
-43.41 |
| Pedestrian in collision with cycle |
Acc., transport, pedest. |
2 |
1 |
3 |
6 |
-50.00 |
| Pedestrian in collision with motorbike |
Acc., transport, pedest. |
7 |
3 |
10 |
23 |
-56.52 |
| Pedestrian in collision with car or van |
Acc., transport, pedest. |
78 |
43 |
121 |
275 |
-56.00 |
| Pedestrian in collision with lorry or bus |
Acc., transport, pedest. |
34 |
7 |
41 |
89 |
-53.93 |
| Pedestrian injured hit by train |
Acc., transport, pedest. |
18 |
1 |
19 |
45 |
-57.78 |
| Cyclist in transport accident |
Acc., transport, cycle |
81 |
17 |
98 |
136 |
-27.94 |
| Cyclist injured in collision with car or van |
Acc., transport, cycle |
31 |
3 |
34 |
41 |
-17.07 |
| Motorcyclist in transport accident |
Acc., transport, m' cycle |
303 |
14 |
317 |
517 |
-38.68 |
| Motorcyclist in collision with car or van |
Acc., transport, m' cycle |
84 |
3 |
87 |
176 |
-50.57 |
| Car occupant injured in transport accident |
Acc., transport, car |
474 |
205 |
679 |
1,305 |
-47.97 |
| Car occupant injured in collision with car or van |
Acc., transport, car |
41 |
27 |
68 |
206 |
-66.99 |
| Car occupant in collision with stationary object |
Acc., transport, car |
141 |
37 |
178 |
334 |
-46.71 |
| Water transport accidents |
Acc., transport |
15 |
3 |
18 |
26 |
-30.77 |
| Air and space transport accidents |
Acc., transport |
23 |
3 |
26 |
23 |
13.04 |
| Falls total |
Acc., Fall |
1,938 |
1,947 |
3,885 |
3,318 |
17.09 |
| Fall on and from stairs and steps |
Acc., Fall |
369 |
324 |
693 |
620 |
11.77 |
| Fall on and from ladder |
Acc., Fall |
51 |
1 |
52 |
57 |
-8.77 |
| Fall from, out of or through building/structure |
Acc., Fall |
83 |
13 |
96 |
104 |
-7.69 |
| Fall from cliff |
Acc., Fall |
5 |
5 |
10 |
17 |
-41.18 |
| Inanimate objects |
Inan. Obj |
76 |
24 |
100 |
111 |
-9.91 |
| Struck by thrown, projected or falling object |
Inan. Obj |
26 |
7 |
33 |
50 |
-34.00 |
| Animate objects total |
Animals, people |
24 |
6 |
30 |
18 |
66.67 |
| Hit, struck, kicked, twisted, bitten or scratched by another |
Animals, people |
5 |
|
5 |
4 |
25.00 |
| Bitten by rat |
Animals |
|
|
0 |
1 |
-100.00 |
| Bitten by dog |
Animals |
|
3 |
6 |
|
|
| Bitten or struck by other mammals |
Animals |
4 |
3 |
9 |
10 |
-10.00 |
| Accidental drowning total |
Acc. Drown |
170 |
47 |
175 |
193 |
-9.33 |
| In bath tub |
Acc. Drown |
9 |
20 |
16 |
18 |
-11.11 |
| Drowning in swimming pool, or falling in |
Acc. Drown |
3 |
|
8 |
9 |
-11.11 |
| Drowning in natural water |
Acc. Drown |
58 |
10 |
53 |
61 |
-13.11 |
| Other accidental threats to breathing |
Acc. Suff |
383 |
244 |
544 |
502 |
8.37 |
| Accidental suffocation in bed |
Acc. Suff |
2 |
3 |
8 |
8 |
0.00 |
| Accidental hanging/strangulation |
Acc. Suff |
169 |
45 |
116 |
118 |
-1.69 |
| Inhalation of stomach contents |
Choking |
59 |
54 |
110 |
119 |
-7.56 |
| Inhalation and ingestion of food |
Choking |
100 |
103 |
210 |
180 |
16.67 |
| Exposure to electric current, radiation and extreme ambient air temperature and pressure total |
Atmos |
35 |
2 |
30 |
30 |
0.00 |
| Exposure to smoke, fire and flames |
Atmos |
123 |
114 |
242 |
227 |
6.61 |
| Contact with heat and hot substances |
Atmos |
6 |
11 |
26 |
29 |
-10.34 |
| Contact with hornets, wasps and bees |
Atmos, insects |
3 |
2 |
2 |
4 |
-50.00 |
| Exposure to forces of nature |
Atmos, nature |
68 |
61 |
79 |
109 |
-27.52 |
| Exposure to excessive natural cold |
Atmos, nature, cold |
68 |
61 |
76 |
99 |
-23.23 |
| Victim of lightning |
Atmos |
|
|
0 |
2 |
-100.00 |
| Accidental poisoning total |
Acc. Poison |
1,076 |
447 |
1,993 |
1,207 |
65.12 |
| Exposure to narcotics and hallucinogens |
Acc. Poison |
508 |
115 |
814 |
483 |
68.53 |
| Accidental alcohol poisoning |
Acc. Poison |
130 |
58 |
381 |
167 |
128.14 |
| Lack of food |
Starv- ation |
3 |
3 |
3 |
4 |
-25.00 |
| Intentional self-harm |
Suicide, harm |
2,613 |
764 |
3,644 |
3,165 |
15.13 |
| Hanging/strangulation |
Suicide, harm |
1,664 |
347 |
2,164 |
1,812 |
19.43 |
| Assault |
TOTAL |
211 |
108 |
329 |
369 |
-10.84 |
| Complications of medical and surgical care |
TOTAL |
218 |
215 |
489 |
414 |
18.12 |
• DATA: download the full spreadsheet
NEW! Buy our book
• Facts are Sacred: the power of data (on Kindle)
More open data
Data journalism and data visualisations from the Guardian
World government data
• Search the world's government data with our gateway
Development and aid data
• Search the world's global development data with our gateway
Can you do something with this data?
• Flickr Please post your visualisations and mash-ups on our Flickr group
• Contact us at data@guardian.co.uk
• Get the A-Z of data
• More at the Datastore directory
• Follow us on Twitter
• Like us on Facebook

 Mortality interactive
