
Wave Visualizer: Turning Threads into Trees
Friday, July 30, 2010 | 4:45 PM
Labels: Wave Developer Blog
Two years ago, I discovered the JavaScript InfoVis Toolkit, a really cool library for doing visualizations in Javascript, like force-directed graphs, hypertree, treemaps, sunbursts, and more. Since then, I've been looking for an excuse to use the library in conjunction with a Google API, and after our latest API release, I found the perfect use.
A few weeks ago, we released a new feature in the data and robot APIs: threads. This feature means that developers can render threaded waves in alternative clients and export waves to other formats while retaining their true structure. It also means that I can finally use the InfoVis Toolkit, in order to visualize the threads in a wave as a structured tree.
To create the visualization, I started with the code for the Inbox Checker sample, a Python App Engine app that asks a user to authenticate (via OAuth), and then shows them their inbox and any wave they click on. I modified that app to output JSON instead of HTML for each wave, and I piped that JSON into the SpaceTree class from the toolkit.
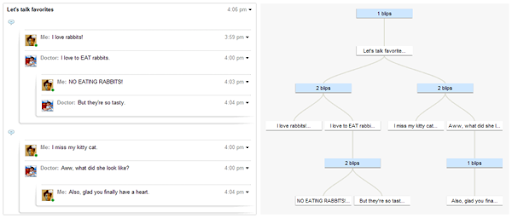
Here's an side-by-side example of how a wave might look like in the client, and what it looks like as a SpaceTree:
You can try the app out for yourself here: Wave Visualizer. After granting access to the app, you can click each of the waves in your inbox and browse the tree for it. As you mouse over each blip, you'll see a snippet of the content of the blip in the tooltip. When you click on a blip, you'll be taken to that exact blip in the Wave client, utilizing our other new feature: blip linking.
(You can also try out the "Timeline" view, which shows the sequence of blips over time, using the Google Visualization API).
This app shows off one of my favorite features of Wave - flexibly structured conversations. Some waves are very flat long trees, and others are wide and deeply nested, and they are all made possible by the Wave conversation model. And now, thanks to the new Wave data APIs, apps like this are possible.
Enjoy playing around with the visualizer, and if you have any questions about building apps like it, stop by the Wave API forum and let us know!