Kenya Listed Banks Q1'2021 Report, & Cytonn Weekly #23/2021
By Research Team, Jun 13, 2021
Executive Summary
Fixed Income
During the week, T-bills remained oversubscribed, with the overall subscription rate coming in at 181.8%, an increase from the 162.5% recorded the previous week. The demand for the 364-day paper persisted, as it recorded the highest bids worth Kshs 24.3 bn against the offered Kshs 10.0 bn, translating to a subscription rate of 243.0%, a decline from the 276.3% recorded the previous week. The continued interest in the 364-day paper is mainly attributable to investors rushing to lock in the paper’s attractive return of 8.6% given that the rates have been declining over the past few weeks. The subscription rate for the 182-day paper increased to 109.3%, from 100.0% recorded the previous week, receiving bids worth Kshs 10.9 bn against the offered amounts of Kshs 10.0 bn while the subscription rate for the 91-day paper increased to 209.7%, from 34.3% recorded the previous week, with the paper receiving bids worth Kshs 8.4 bn against the offered amounts of Kshs 4.0 bn. The yields on the three papers ended the week at 7.1%, 7.7% and 8.6%, for the 91-day, 182-day and 364-day papers, respectively;
The Stanbic Purchasing Managers’ Index (PMI) for the month of May, 2021 increased to 52.5 from the 41.5 recorded in April 2021, attributable to the lifting of the partial restrictions imposed earlier in March 2021. During the week, the Cabinet for National Treasury tabled the FY’2021/2022 Budget Statement before parliament indicating that the total FY’2021/22 budget is estimated at Kshs 3.6 tn, a 12.5% increase from the Kshs 3.2 tn final FY’2020/21 budget. Additionally, the World Bank approved a USD 750.0 mn (Kshs 80.0 bn) loan facility to the Kenyan Government, with the funds being intended for use in budgetary support and assistance in the economic recovery from the negative effects of the COVID-19 pandemic;
Equities
During the week, the equities market was on an upward trajectory, with NSE 20 gaining by 0.2%, while NASI and NSE 25 both gained by 1.4%, taking their YTD performance to gains of 2.1%, 13.3% and 9.8% for NSE 20, NASI and NSE 25, respectively. The equities market performance was mainly driven by gains recorded by large-cap stocks such as ABSA Bank Kenya, Equity Group and Safaricom of 3.3%, 2.8%, and 1.9%, respectively. The gains were however weighed down by losses recorded by stocks such as Bamburi which declined by 6.2%;
Real Estate
In the FY’2021/22 Budget Statement, infrastructure, housing and tourism sectors were allocated Kshs 182.5 bn, Kshs 21.8 bn and Kshs 18.1 bn, respectively, representing 4.9%, 0.6% and 0.5% of the Kshs 3.6 tn total budget respectively. Additionally, the Central Bank of Kenya released the Monetary Policy Committee Hotel Survey-May 2021, highlighting that the number of operating hotels registered a 16.0% increase to 94.0% in May from 81.0% in April. In the infrastructure sector, the upgrading of the Kshs 10.8 bn Garsen- Minjilla- Mokowe road project linking Lamu and Tana River County was concluded;
Focus of the Week
Following the release of Q1’2021 results by Kenyan listed banks, this week we analyse the performance of the 10 listed local banks (previously 11, before the acquisition of National Bank by KCB Group Plc), identify the key factors that influenced their performance, and give our outlook for the banking sector.
Investment Updates:
- Weekly Rates:
- Cytonn Money Market Fund closed the week at a yield of 10.40%. To invest, just dial *809#;
- Cytonn High Yield Fund closed the week at a yield of 14.90% p.a. To invest, email us at sales@cytonn.com and to withdraw the interest you just dial *809#;
- We continue to offer Wealth Management Training daily, from 9:00 am to 11:00 am, through our Cytonn Foundation. The training aims to grow financial literacy among the general public. To register for any of our Wealth Management Trainings, click here;
- If interested in our Private Wealth Management Training for your employees or investment group, please get in touch with us through wmt@cytonn.com;
- Cytonn Insurance Agency acts as an intermediary for those looking to secure their assets and loved ones’ future through insurance namely; Motor, Medical, Life, Property, WIBA, Credit and Fire and Burglary insurance covers. For assistance, get in touch with us through insuranceagency@cytonn.com;
Real Estate Updates:
- For an exclusive tour of Cytonn’s real estate developments, visit: Sharp Investor's Tour, and for more information, email us at sales@cytonn.com;
- Phase 3 of The Alma is now ready for occupancy. To rent please email properties@cytonn.com;
For recent news about the group, see our news section here.
Money Markets, T-Bills & T-Bonds Primary Auction:
During the week, T-bills remained oversubscribed, with the overall subscription rate coming in at 181.8%, an increase from the 162.5% recorded the previous week. The demand for the 364-day paper persisted, as it recorded the highest bids worth Kshs 24.3 bn against the offered Kshs 10.0 bn, translating to a subscription rate of 243.0%, a decline from the 276.3% recorded the previous week. The continued interest in the 364-day paper is mainly attributable to investors rushing to lock in the paper’s attractive return of 8.6% given that the rates have been declining over the past few weeks. The subscription rate for the 182-day paper increased to 109.3%, from 100.0% recorded the previous week, receiving bids worth Kshs 10.9 bn against the offered amounts of Kshs 10.0 bn. The subscription rate for the 91-day paper increased to 209.7%, from 34.3% recorded the previous week, with the paper receiving bids worth Kshs 8.4 bn against the offered amounts of Kshs 4.0 bn. The yields on all the three papers declined; with the 91-day, 182-day and 364-day paper declining by 3.3 bps, 8.7 bps and 32.5 bps, to 7.1%, 7.7% and 8.6%, respectively. The government continued to reject expensive bids, accepting Kshs 18.5 bn out of the Kshs 43.6 bn worth of bids received, translating to an acceptance rate of 42.4%.
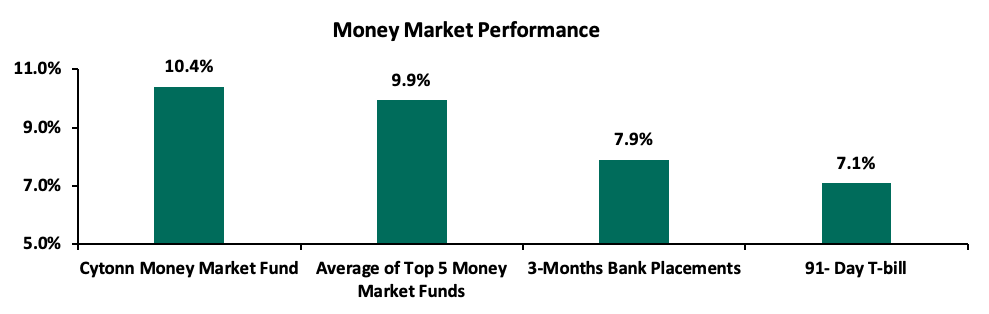
In the money markets, 3-month bank placements ended the week at 7.9% (based on what we have been offered by various banks), while the yield on the 91-day T-bill declined by 3.3 bps to 7.1%. The average yield of the Top 5 Money Market Funds declined to 9.9% from the 10.0% recorded the previous week. The yield on the Cytonn Money Market Fund remained unchanged at 10.4% during the week.
The table below shows the Money Market Fund Yields for Kenyan Fund Managers as published on 11th June 2021:
Money Market Fund Yield for Fund Managers as published on 11th June 2021 | |||
Rank | Fund Manager | Daily Yield | Effective Annual Rate |
1 | Cytonn Money Market Fund | 9.89% | 10.40% |
2 | Nabo Africa Money Market Fund | 9.52% | 9.95% |
3 | Zimele Money Market Fund | 9.56% | 9.91% |
4 | GenCapHela Imara Money Market Fund | 9.36% | 9.81% |
5 | Alphafrica Kaisha Money Market Fund | 9.22% | 9.62% |
6 | CIC Money Market Fund | 9.08% | 9.41% |
7 | Sanlam Money Market Fund | 8.82% | 9.22% |
8 | Co-op Money Market Fund | 8.50% | 8.87% |
9 | Madison Money Market Fund | 8.31% | 8.66% |
10 | Dry Associates Money Market Fund | 8.30% | 8.63% |
11 | Apollo Money Market Fund | 8.51% | 8.57% |
12 | NCBA Money Market Fund | 8.00% | 8.31% |
13 | British-American Money Market Fund | 7.98% | 8.28% |
14 | ICEA Lion Money Market Fund | 7.95% | 8.28% |
15 | Old Mutual Money Market Fund | 7.50% | 7.76% |
16 | AA Kenya Shillings Fund | 6.13% | 6.31% |
Liquidity:
During the week, liquidity in the money market eased, with the average interbank rate declining to 4.5% from 4.8% recorded the previous week, partly attributable to government securities maturities and redemptions worth Kshs 40.8 bn. The average interbank volumes declined by 24.7% to Kshs 10.2 bn, from Kshs 13.6 bn recorded the previous week.
Kenya Eurobonds:
During the week, the yields on Eurobonds recorded mixed performance. The yields on the 10-year bond issued in 2018, 30-year bond issued in 2018, 7-year bond issued in 2019 and the 12-year bond issued in 2019 declined to 5.1%, 7.2%, 4.5% and 6.1%, respectively, from 5.2%, 7.3%, 4.6% and 6.2% recorded the previous week. On the other hand, the yields on the 10-year Eurobond issued in June 2014 remained unchanged at 3.0%. Below is a summary of the performance:
Kenya Eurobond Performance | |||||
| 2014 | 2018 | 2019 | ||
Date | 10-year issue | 10-year issue | 30-year issue | 7-year issue | 12-year issue |
31-Dec-2020 | 3.9% | 5.2% | 7.0% | 4.9% | 5.9% |
31-May-21 | 3.1% | 5.3% | 7.3% | 4.7% | 6.2% |
03-June-21 | 3.0% | 5.2% | 7.3% | 4.6% | 6.2% |
04-June-21 | 3.0% | 5.3% | 7.3% | 4.6% | 6.2% |
07-June-21 | 3.0% | 5.2% | 7.3% | 4.6% | 6.2% |
08-June-21 | 3.0% | 5.2% | 7.2% | 4.6% | 6.1% |
09-June-21 | 3.0% | 5.1% | 7.2% | 4.5% | 6.1% |
10-June-21 | 3.0% | 5.1% | 7.2% | 4.5% | 6.1% |
Weekly Change | 0.0% | (0.2%) | (0.1%) | (0.1%) | (0.1%) |
MTD Change | (0.1%) | (0.2%) | (0.1%) | (0.2%) | (0.1%) |
YTD Change | (0.9%) | (0.1%) | 0.2% | (0.4%) | 0.2% |
Source: Reuters
Kenya Shilling:
During the week, the Kenyan shilling depreciated against the US dollar by 0.2% to close the week at Kshs 107.9, from Kshs 107.7 recorded the previous week, mainly due to dollar demand from commodity importers outweighing the supply of dollars from exporters. On a YTD basis, the shilling has appreciated by 1.2% against the dollar, in comparison to the 7.7% depreciation recorded in 2020. Despite the recent appreciation, we expect the shilling to remain under pressure in 2021 as a result of:
- Rising uncertainties in the global market due to the Coronavirus pandemic, which has seen investors continue to prefer holding their investments in dollars and other hard currencies and commodities, and,
- Demand from merchandise traders as they beef up their hard currency positions in anticipation for more trading partners reopening their economies globally.
The shilling is however expected to be supported by:
- The Forex reserves, currently at USD 7.5 bn (equivalent to 4.6-months of import cover), which is above the statutory requirement of maintaining at least 4.0-months of import cover, and the EAC region’s convergence criteria of 4.5-months of import cover,
- The stable current account position which is estimated to remain at a deficit of 5.2% of GDP in 2021, and,
- Improving diaspora remittances evidenced by a 43.8% y/y increase to USD 299.3 mn in April 2021, from USD 208.2 mn recorded over the same period in 2020, which have cushioned the shilling against further depreciation.
Weekly Highlights:
- Stanbic PMI Index May 2021
The headline Purchasing Managers’ Index (PMI) for the month of May 2021 increased to 52.5 from the 41.5 recorded in April 2021, attributable to the lifting of the partial restrictions that had been imposed in March 2021. There was a reported improvement in the new order demand, output and stock purchases, which consequently led to an increase in the number of new jobs created. See below a chart summarizing the evolution of the PMI over the last 24 months:
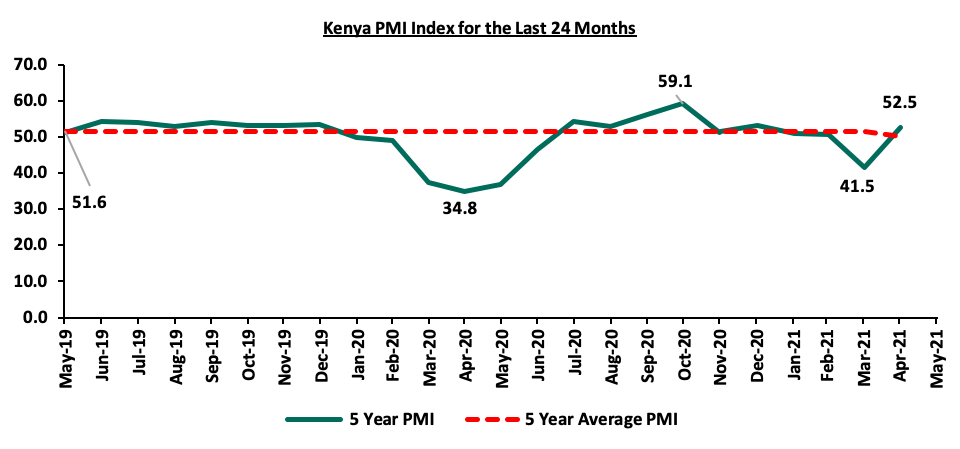
*** Key to note, a reading above 50.0 signals an improvement in business conditions, while readings below 50.0 indicate a deterioration
Despite the 11.0 points improvement in last month’s reading, we still maintain a cautious outlook in the short term owing to the lag in procurement and slowdown in the inoculation of more COVID-19 vaccines. The discovery of new variants that are more easily transmissible might lead to another wave of infections and more restrictions that will affect the business environment.
- FY’2021/2022 Budget Statement
During the week the Cabinet Secretary for National Secretary presented the FY’2021/2022 Budget Statement before parliament. Some of the highlights from the budget included;
- The total FY’2021/22 budget is estimated at Kshs 3.6 tn, a 12.5% increase from the Kshs 3.2 tn final FY’2020/21 budget. Additionally, the government projects that total revenue will increase by 10.5% to Kshs 2.1 tn from the Kshs 1.9 tn in FY’2020/2021. The increase is mainly due to a 12.5% increase in ordinary revenue to Kshs 1.8 tn from the Kshs 1.6 tn collected in FY’2020/21,
- Total expenditure is set to increase by 4.8% to Kshs 3.0 tn (equivalent to 24.5% of GDP), from Kshs 2.9 tn (equivalent to 25.8% of GDP) in the FY’2020/21 Budget. The Treasury indicated that it had set aside an additional Kshs 23.1 bn for the continuation of the post-COVID-19 Economic Stimulus Package, and,
- Public debt is expected to continue growing in FY’2021/22, as the approximate Kshs 929.7 bn fiscal deficit will be financed through both domestic and foreign debts.
- The fiscal deficit (excluding grants) as a share of GDP, is expected to come in at 7.5% in FY’2021/2022, from 8.7% in FY 2020/2021.
The FY'2021/2022 budget points to an expansionary budget which is meant to steer the economy towards a gradual recovery. However, with the fiscal deficit estimated to reduce to 7.5% of GDP mainly as a result of an expected decline in recurrent expenditure and an improvement in revenues, debt sustainability remains a key concern, with the country’s public debt–to-GDP ratio having increased considerably over the past five years to 69.6% as at December 2020, from 44.3% as at the end of 2013 with half of the debt being external. In our view, there are still concerns on how the government will be able to meet its revenue collection targets given that the country is still facing risks of additional waves of the pandemic. We shall be focusing on this fiscal year’s budget in the coming week.
- World Bank Loan Facility
During the week, the World Bank approved a USD 750.0 mn (Kshs 80.0 bn) loan facility to the Kenyan Government, with the funds being intended for use in budgetary support and assistance in the economic recovery from the negative effects of the COVID-19 pandemic. The facility will attract an annual interest rate of 3.1% which is line with the government’s intention to move away from expensive commercial loans to cheaper multi-lateral borrowing. Below is a summary of the loan facilities acquired by the Kenyan government in 2021;
Facility provider | Date of Issue | Amounts in Kshs bn | Purpose of the facility |
International Monetary Fund (IMF) | April, 2021 | 255.9 | Assisting Kenya to stabilize its economy and create a sustainable growth path |
The World Bank | June, 2021 | 81.0 | Budgetary support and assistance in economic recovery from the effects of the COVID-19 pandemic |
Total | 336.9 |
| |
Rates in the fixed income market have remained relatively stable due to the high liquidity in the money markets, coupled with the discipline by the Central Bank as they reject expensive bids. The government is 6.9% behind its prorated borrowing target of Kshs 528.6 bn having borrowed Kshs 492.2 bn. In our view, due to the current subdued economic performance brought about by the effects of the COVID-19 pandemic, the government will record a shortfall in revenue collection having collected Kshs. 1,190.6 bn in the first 10 months to April 2021, compared to Kshs 1,224.8 bn prorated target collection for FY’2020/2021, thus leading to a budget deficit of 8.7% larger than the projected 7.5% of GDP. The high deficit and the lower credit rating from S&P Global to 'B' from 'B+' will mean that the government might be forced to borrow more from the domestic market which might create uncertainty in the interest rate environment. In our view, investors should be biased towards short-term fixed income securities to reduce duration risk.
Markets Performance
During the week, the equities market was on an upward trajectory, with NSE 20 gaining by 0.2%, while NASI and NSE 25 both gained by 1.4%, taking their YTD performance to gains of 2.1%, 13.3% and 9.8% for NSE 20, NASI and NSE 25, respectively. The equities market performance was mainly driven by gains recorded by large-cap stocks such as ABSA Bank Kenya, Equity Group and Safaricom of 3.3%, 2.8%, and 1.9%, respectively. The gains were however weighed down by losses recorded by stocks such as Bamburi which declined by 6.2%.
During the week, equities turnover increased by 107.9% to USD 44.7 mn, from USD 21.5 mn recorded the previous week, taking the YTD turnover to USD 575.5 mn. Foreign investors remained net sellers, with a net selling position of USD 7.2 mn, from a net selling position of USD 1.7 mn recorded the previous week, taking the YTD net selling position to USD 24.7 mn.
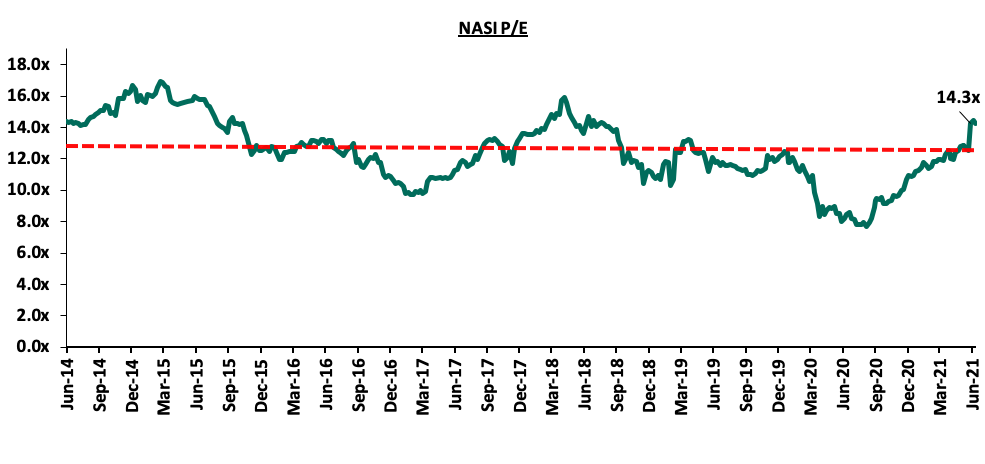
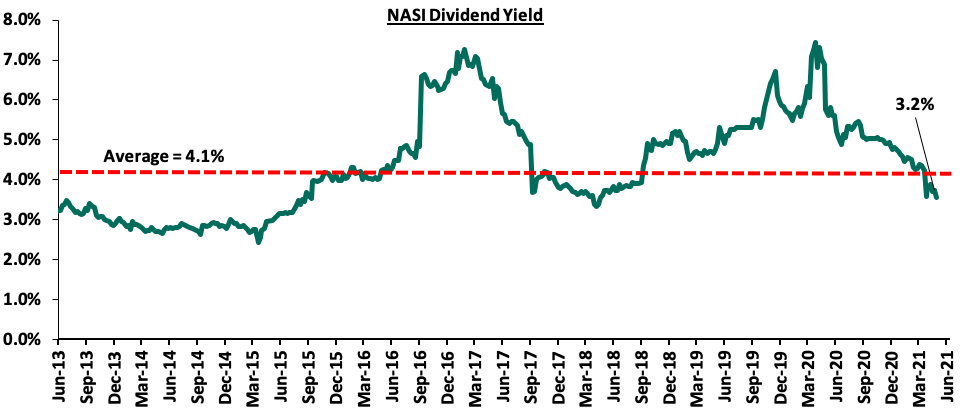
The market is currently trading at a price to earnings ratio (P/E) of 14.3x, 10.4% above the historical average of 12.9x, and a dividend yield of 3.2%, 0.9% points below the historical average of 4.1%. Key to note, NASI’s PEG ratio currently stands at 1.6x, an indication that the market is trading at a premium to its future earnings growth. Basically, a PEG ratio greater than 1.0x indicates the market may be overvalued while a PEG ratio less than 1.0x indicates that the market is undervalued. Excluding Safaricom, the market is trading at a P/E ratio of 12.4x and a PEG ratio of 1.4x. The current P/E valuation of 14.3x is 85.2% above the most recent trough valuation of 7.7x experienced in the first week of August 2020. The charts below indicate the historical P/E and dividend yields of the market.
Universe of Coverage
Below is a summary of our universe of coverage and the recommendations:
Company | Price at 04/06/2021 | Price as at 11/06/2021 | w/w change | YTD Change | Year Open 2021 | Target Price* | Dividend Yield | Upside/ Downside** | P/TBv Multiple | Recommendation |
I&M Holdings*** | 22.0 | 21.5 | (2.3%) | (52.1%) | 44.9 | 29.8 | 10.5% | 49.1% | 0.3x | Buy |
Sanlam | 10.5 | 9.3 | (11.4%) | (28.5%) | 13.0 | 12.4 | 0.0% | 33.3% | 0.8x | Buy |
Kenya Reinsurance | 2.5 | 2.5 | (0.4%) | 7.8% | 2.3 | 3.1 | 4.0% | 28.5% | 0.3x | Buy |
Liberty Holdings | 7.0 | 6.8 | (2.6%) | (11.4%) | 7.7 | 8.4 | 0.0% | 23.2% | 0.5x | Buy |
Co-op Bank*** | 12.3 | 12.3 | 0.4% | (2.0%) | 12.6 | 13.8 | 8.1% | 20.3% | 0.9x | Buy |
Diamond Trust Bank*** | 60.0 | 59.0 | (1.7%) | (23.1%) | 76.8 | 70.0 | 0.0% | 18.6% | 0.3x | Accumulate |
Stanbic Holdings | 80.0 | 80.0 | 0.0% | (91.5%) | 85.0 | 90.5 | 4.8% | 17.9% | 0.8x | Accumulate |
NCBA*** | 26.1 | 26.3 | 0.8% | (1.1%) | 26.6 | 29.5 | 5.7% | 17.9% | 0.7x | Accumulate |
KCB Group*** | 42.3 | 42.6 | 0.8% | 10.9% | 38.4 | 48.6 | 2.3% | 16.4% | 1.0x | Accumulate |
Equity Group*** | 42.9 | 44.1 | 2.8% | 21.5% | 36.3 | 51.2 | 0.0% | 16.2% | 1.3x | Accumulate |
Standard Chartered*** | 130.0 | 130.0 | 0.0% | (10.0%) | 144.5 | 134.5 | 8.1% | 11.5% | 0.9x | Accumulate |
Jubilee Holdings | 280.0 | 306.3 | 9.4% | 11.1% | 275.8 | 330.9 | 2.9% | 11.0% | 0.6x | Accumulate |
ABSA Bank*** | 9.8 | 10.1 | 3.3% | 6.1% | 9.5 | 10.7 | 0.0% | 5.9% | 1.1x | Hold |
Britam | 7.1 | 7.3 | 2.0% | 3.7% | 7.0 | 6.7 | 0.0% | (7.7%) | 1.3x | Sell |
HF Group | 3.7 | 3.8 | 3.0% | 19.7% | 3.1 | 3.2 | 0.0% | (14.9%) | 0.2x | Sell |
CIC Group | 2.1 | 2.1 | 2.4% | 0.5% | 2.1 | 1.8 | 0.0% | (15.1%) | 0.7x | Sell |
*Target Price as per Cytonn Analyst estimates **Upside/ (Downside) is adjusted for Dividend Yield ***For Disclosure, these are stocks in which Cytonn and/or its affiliates are invested in Key to note, I&M Holdings YTD share price change is mainly attributable to counter trading ex-bonus issue. | ||||||||||
We are “Neutral” on the Equities markets in the short term. With the market currently trading at a premium to its future growth (PEG Ratio at 1.6x), we believe that investors should reposition towards companies with a strong earnings growth and are trading at discounts to their intrinsic value. Additionally, we expect the recent discovery of new strains of COVID-19 coupled with the introduction of strict lockdown measures in major economies to continue dampening the economic outlook.
I. Industry reports
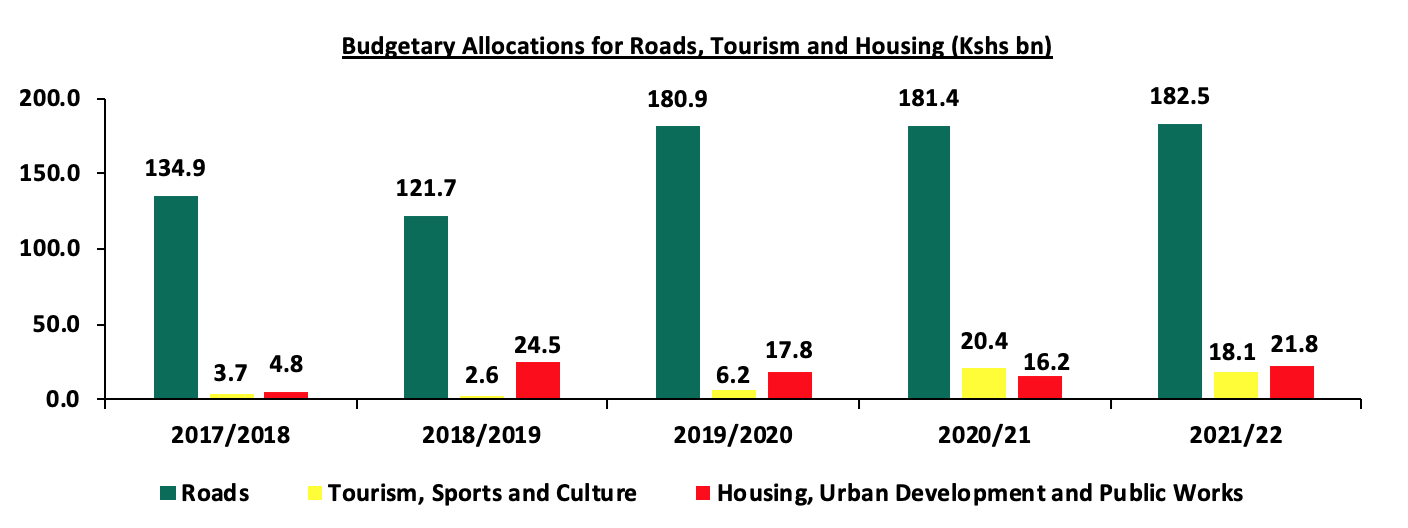
In the FY’2021/22 Budget Statement there was an allocation of Kshs 222.4 bn for key themes in the real estate and real estate related sector as highlighted below;
- Infrastructure sector received a total of Kshs 182.5 bn in FY’2021/22 to support construction of roads and bridges as well as the rehabilitation and maintenance of roads, which is a 0.6% increase from Kshs 181.4 bn in FY’2020/21.,
- Housing, Urban Development and Public Works were allocated a total of Kshs 21.8 bn, a 33.9% increase from FY’2020/21 with Kenya Mortgage Refinance Company (KMRC) receiving Kshs 3.5 bn to enhance company’s capital and lending to primary mortgage lenders. Other key areas in the residential sector including construction of affordable housing units, urban housing units and Kenya Informal Settlement Improvement Phase II, received an allocation of Kshs 8.2 bn, Kshs 0.7 bn, and Kshs 3.5 bn, respectively, and,
- The tourism sector was allocated a total of Kshs 18.1 bn with the Tourism Promotion Fund (TPF) receiving Kshs 0.6 bn and Tourism Fund receiving Kshs 1.7 bn. With the government rationalizing funds towards the negatively affected sector while giving more priority to entities that received less allocation in FY’2020/21 budget allocation, the allocation to the tourism sector was decreased by 11.3% from Kshs 20.4 bn in FY’2020/21. The funds allocated are aimed towards the sector’s recovery after being one the hardest hit sector by the COVID-19 pandemic, evidenced by the flight restrictions imposed on the country to curb the pandemic effects hence leading to reduced passenger arrivals into the country.
The graph below shows comparison among road, tourism and housing budgetary allocations in the last five fiscal years;
Source: National Treasury of Kenya
With the improved budget allocation for the infrastructure and housing sectors, we expect increased development activities attributable to government’s aggressiveness to implement and conclude select infrastructure projects despite the pandemic. However, we expect the hospitality sector performance to continue being affected negatively due to the reduced budgetary allocation and overreliance on the tourism sector which has also been affected by reduced number of passenger arrivals.
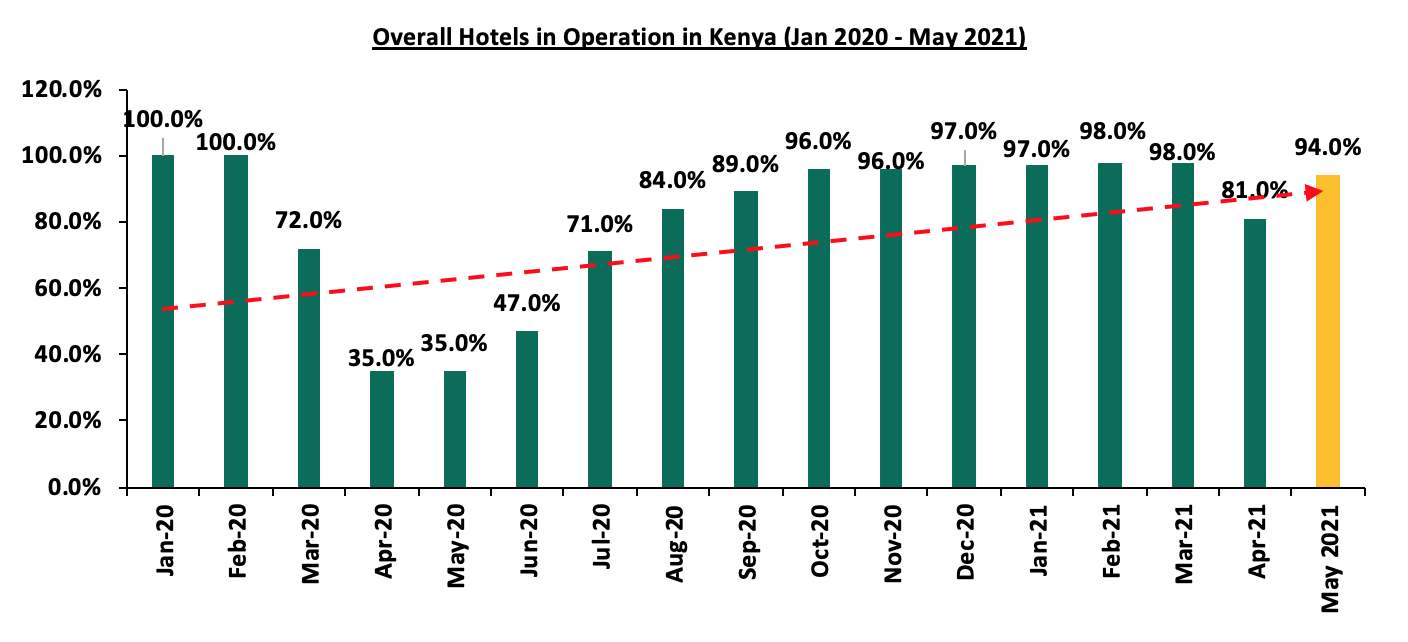
Also, during the week, the Central Bank of Kenya released the Monetary Policy Committee Hotel Survey-May 2021, a survey that was intended to assess the extent of the recovery of the hospitality industry as a result of COVID-19 pandemic. Some of the key take outs from the report include:
- The number of operating hotels registered a 16.0% increase to 94.0% in May from 81.0% in April highlighting that the COVID-19 containment measures in March 2021 had an impact on the operations of hotels. The graph below shows the overall percentage of the number of operating hotels in Kenya between January 2020 – May 2021;
Source: Central Bank of Kenya
- The hospitality sector has remained dependent on local guests and this accounted for 84.0% and 85.0% of accommodation and restaurant services, respectively in May 2021 compared to 62.0% and 69.0% respectively during the Pre-COVID period, mainly attributed to the decline in the number of international tourism arrivals as people limit their traveling options to avoid the spread of the virus, health advisories to Kenya mainly from the United States of America, and Kenya issuing travel bans to the United Kingdom which account for a largest percentage source of tourists, and,
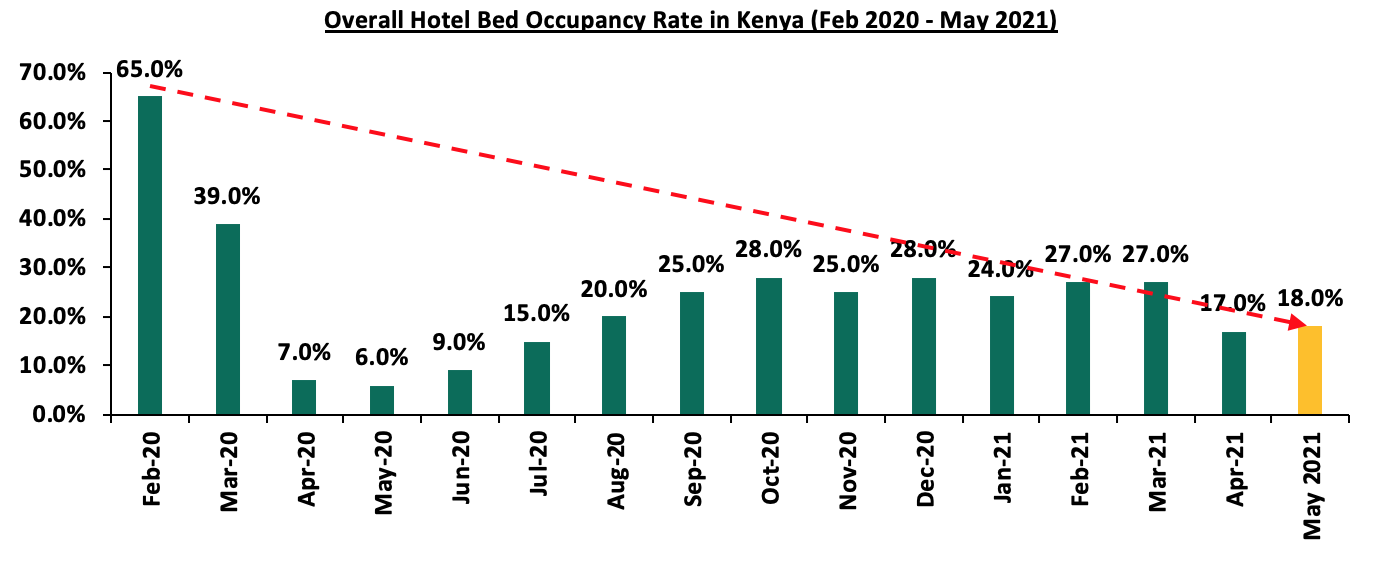
- The average bed occupancy in May was at 18.0%, an increase by 1.0% points from 17.0% in April. The slight increase is attributed to the lifting up of travel restrictions after the March 26th partial lockdown. The graph below highlights the hotel bed occupancy rates in Kenya between February 2020 and May 2021;
Source: Central Bank of Kenya
The overall improvement of the performance of key facilities in the hospitality industry is attributed to the gradual lifting of flight restrictions. The performance improvement gives hope for the recovery of the hospitality sector in the long run alongside other interventions by the government to support the recovery of the sector such as repackaging of the hospitality sector to appeal to local tourists and allocation of funds to the Ministry of Tourism through TPF (Tourism Promotion Fund) to support the recovery from the pandemic.
II. Infrastructure Sector
During the week, the upgrading of the Kshs 10.8 bn Garsen- Minjilla- Mokowe road project linking Lamu and Tana River County was concluded and launched by President Uhuru Kenyatta. The 113-km road project funded by the national government and upgraded by the Kenya National Highways Authority (KeNHA) was initiated in June 2018 and was expected to be completed by December 2020, however it has been stalling due to floods and persistent insecurity in the neighbouring areas hence affecting working hours. With its conclusion, the road will spur trade activities by enhancing easier and faster transport of goods, open up surrounding areas for investments, as well as boost tourism activities and property prices.
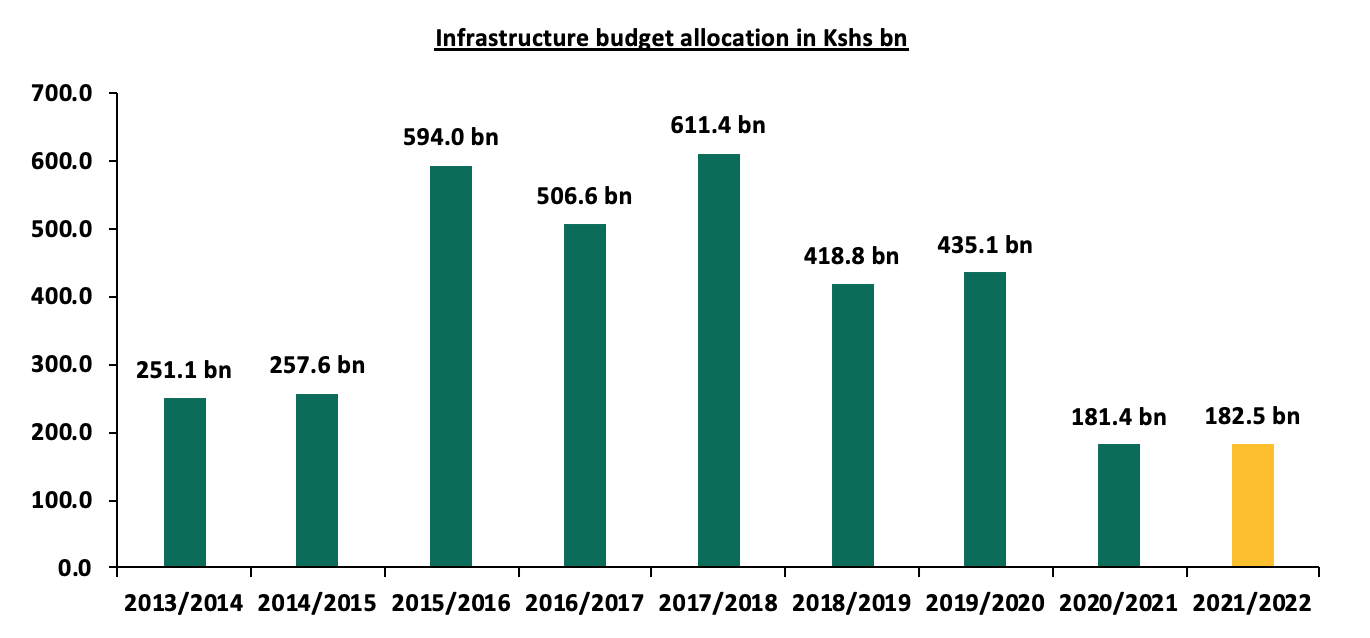
With other mega infrastructure projects currently underway such as the Nairobi Express Way, Standard Gauge Railway, Nairobi Western Bypass, and Nairobi Commuter Rail Project among others, we expect increased activities in the infrastructure sector attributed to the Government’s aggressiveness to implement and conclude projects despite the pandemic effects, and the 0.6% increase in budgetary allocation to Kshs 182.5 bn for the FY’2021/2022, from Kshs 181.4 bn allocation for FY’2020/2021.
The graph below shows the budget allocation to the infrastructure sector over the last nine financial years;
Source: National Treasury
We expect an overall improvement in the real estate sector supported by the overall increase in budgetary allocation to key sectors that directly affect the real estate sector, the expected improvement in the hospitality sector in the long run due to easing of travel restrictions and continued launch of infrastructural projects. However, the reduced budgetary allocation to the tourism sector is expected to negatively impact the recovery of the sector.
Following the release of the Q1’2021 results by Kenyan listed banks, the Cytonn Financial Services Research Team undertook an analysis on the financial performance of the listed banks and identified the key factors that shaped the performance of the sector.
Core Earnings per Share recorded a weighted increase of 28.4% in Q1’2021, compared to a weighted decline of 7.3% recorded in Q1’2020. The increase in earnings was mainly attributable to the growth in Net Interest Income, which grew by 17.5% in Q1’2021, compared to a growth of 7.4% in Q1’2020, for the listed banking sector. Additionally, interest income grew by 14.7%, compared to a growth of 8.2% recorded in Q1’2020, attributable to the increased allocation to higher yielding government securities during the quarter. Investments in government securities grew by 20.3%, faster than the 11.0% loan growth recorded during the period. Consequently, the Yield on Interest Earning Assets (YIEA) increased to 10.2%, from the 9.8% recorded in Q1’2020, with Net Interest Margin (NIM) increasing to 7.4%, 0.2% points higher than the 7.2% recorded in Q1’2020 for the whole listed banking sector.
The report is themed “Recovery of the Banking Sector Amid a Tough Operating Environment” where we assess the key factors that influenced the performance of the banking sector in Q1’2021, the key trends, the challenges banks faced, and areas that will be crucial for growth and stability of the banking sector going forward. As such, we shall address the following:
- Key Themes That Shaped the Banking Sector Performance in Q1’2021,
- Summary of The Performance of the Listed Banking Sector in Q1’2021,
- The Focus Areas of the Banking Sector Players Going Forward, and,
- Brief Summary and Ranking of the Listed Banks based on the Outcome of Our Analysis.
Section I: Key Themes That Shaped the Banking Sector Performance in Q1’2021
Below, we highlight the key themes that shaped the banking sector in Q1’2021 which include regulation, regional expansion through mergers and acquisitions, asset quality deterioration and capital raising for onward lending:
1. Regulation
- Closure of Loan restructuring Window: The loan restructuring window as per the Banking Circular No 3 of 2020 by the Central Bank of Kenya provided to commercial banks and mortgage finance companies on loan restructuring came to an end on March 2nd, having seen a total of loans worth Kshs 1.7 tn restructured, representing 57.0% of the banking sector’s loan book. With this expiry the banks are now back to normal loan risk management. However, despite the expiry of the loan restructuring window, some banks still supported their borrowers during the period. Equity Group, KCB Group, Diamond Trust Bank and Cooperative Bank disclosed the cumulative amount of loans they have restructured as at Q1’2021;
No. | Bank | Cumulative Amount Restructured (Kshs bn) | % of restructured loans to total loans | Q1’2021 y/y Change in Loan loss provision |
1 | Equity Group Holdings | 171.0 | 31.0% | (59.3%) |
2 | Kenya Commercial Bank | 102.5 | 18.8% | (1.3%) |
3 | Diamond Trust Bank | 72.0 | 33.0% | 67.7% |
4 | Co-operative Bank of Kenya | 49.0 | 14.3% | 153.5% |
| Total | 394.5 | 24.3% | 40.2% |
2. Regional Expansion through Mergers and Acquisitions: The Kenyan banks are looking at having an extensive regional reach and to this end the following were the major M&A’s activities announced in May 2021:
- Equity Group disclosed that it had acquired an additional 7.7% stake valued at Kshs 996.0 mn in Equity bank Congo (EBC) from the German Sovereign Wealth Fund (KfW). The acquisition raised the total ownership in EBC to 94.3%, indicating that they are currently valuing the company at Kshs 14.2 bn. This follows the recent acquisition of 66.5% stake in Banque Commerciale Du Congo (BCDC) by Equity Group at a cost of Kshs 10.2 bn in August 2020. For more information, please see Cytonn Weekly#20/2021,
- KCB Group disclosed that it had made an offer to the Banque Populaire du Rwanda Plc (BPR) shareholders to raise its acquisition stake in the bank from 62.1% to 100.0%. As highlighted in our Cytonn Weekly #48/2020, the 62.1% BPR acquisition would see KCB pay a cash consideration based on the net asset value of the BPR at completion of the transaction using a price to book multiple of 1.1x. According to the latest BPR financials, the bank had a book value of Rwf 47.3 bn (Kshs 5.1 bn), and thus at the trading multiple of 1.1x, we expect KCB Group to pay Kshs 5.6 bn. Collectively, KCB will spend a total of USD 56.9 mn (Kshs 6.1 bn) in the acquisition of Banque Populaire du Rwanda Plc (BPR) Rwanda and African Banking Corporation (ABC) Tanzania. For more information on the acquisition, see our Cytonn Weekly #19/2021, and,
- I&M Holdings Plc announced that it completed the 90.0% acquisition of Orient Bank Limited Uganda (OBL) share capital, after receiving all the required regulatory approvals. As highlighted in our Cytonn Weekly #50/2020, I&M Holdings was set to pay Kshs 3.6 bn for the deal. Additionally, I&M Holdings will take over 14 branches from OBL, taking its total branches to 80, from 66 branches as at the end of 2020. For more information, please see Cytonn Weekly #18/2021.
Below is a summary of the deals in the last 7 years that have either happened, been announced or expected to be concluded:
Acquirer | Bank Acquired | Book Value at Acquisition (Kshs bn) | Transaction Stake | Transaction Value (Kshs bn) | P/Bv Multiple | Date |
I&M Holdings PLC | Orient Bank Limited Uganda | 3.3 | 90.0% | 3.6 | 1.1x | April-21 |
KCB Group | Banque Populaire du Rwanda, and, ABC Tanzania | 4.5 (Banque Populaire du Rwanda, only. ABC Tanzania financials unknown) | 100.0% | 6.1 | N/D | Nov-20* |
Co-operative Bank | Jamii Bora Bank | 3.4 | 90.0% | 1 | 0.3x | Aug-20 |
Commercial International Bank | Mayfair Bank Limited | 1 | 51.0% | Undisclosed | N/D | May-20* |
Access Bank PLC (Nigeria) | Transnational Bank PLC. | 1.9 | 100.0% | 1.4 | 0.7x | Feb-20* |
Equity Group ** | Banque Commerciale Du Congo | 8.9 | 66.5% | 10.3 | 1.2x | Nov-19* |
KCB Group | National Bank of Kenya | 7 | 100.0% | 6.6 | 0.9x | Sep-19 |
CBA Group | NIC Group | 33.5 | 53%:47% | 23 | 0.7x | Sep-19 |
Oiko Credit | Credit Bank | 3 | 22.8% | 1 | 1.5x | Aug-19 |
CBA Group** | Jamii Bora Bank | 3.4 | 100.0% | 1.4 | 0.4x | Jan-19 |
AfricInvest Azure | Prime Bank | 21.2 | 24.2% | 5.1 | 1.0x | Jan-18 |
KCB Group | Imperial Bank | Unknown | Undisclosed | Undisclosed | N/A | Dec-18 |
SBM Bank Kenya | Chase Bank Ltd | Unknown | 75.0% | Undisclosed | N/A | Aug-18 |
DTBK | Habib Bank Kenya | 2.4 | 100.0% | 1.8 | 0.8x | Mar-17 |
SBM Holdings | Fidelity Commercial Bank | 1.8 | 100.0% | 2.8 | 1.6x | Nov-16 |
M Bank | Oriental Commercial Bank | 1.8 | 51.0% | 1.3 | 1.4x | Jun-16 |
I&M Holdings | Giro Commercial Bank | 3 | 100.0% | 5 | 1.7x | Jun-16 |
Mwalimu SACCO | Equatorial Commercial Bank | 1.2 | 75.0% | 2.6 | 2.3x | Mar-15 |
Centum | K-Rep Bank | 2.1 | 66.0% | 2.5 | 1.8x | Jul-14 |
GT Bank | Fina Bank Group | 3.9 | 70.0% | 8.6 | 3.2x | Nov-13 |
Average |
|
| 76.7% |
| 1.3x |
|
* Announcement Date ** Deals that were dropped | ||||||
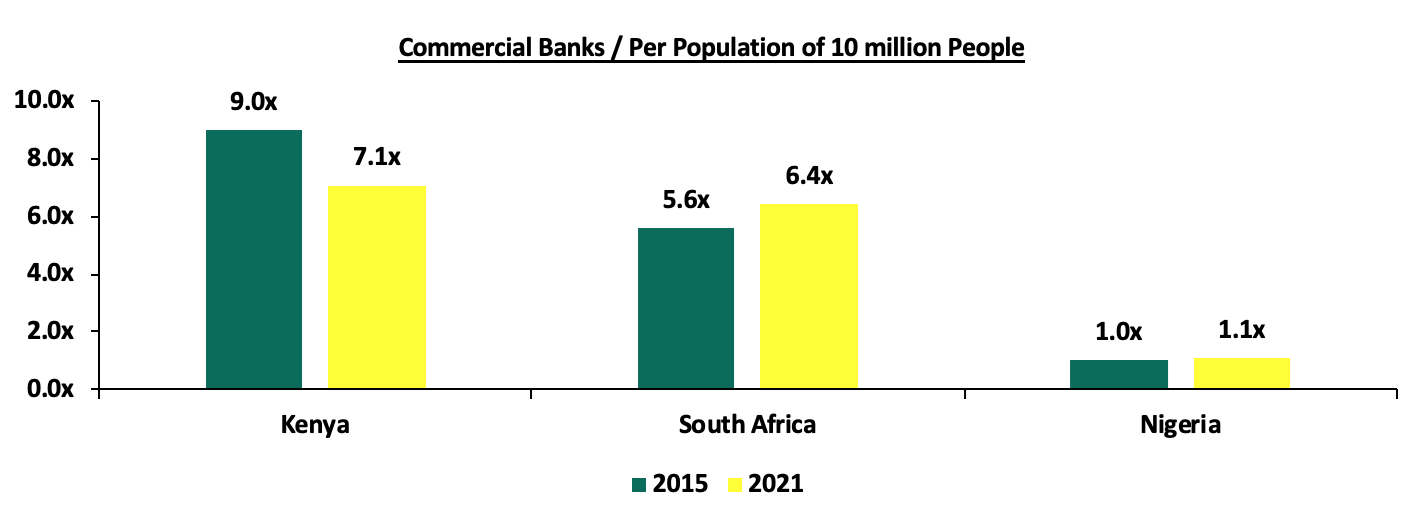
The number of commercial banks in Kenya has now reduced to 38, compared to 43 banks 6-years ago. The ratio of the number of banks per 10 million population in Kenya now stands at 7.1x, which is a reduction from 9.0x 6-years ago, demonstrating continued consolidation of the banking sector. However, despite the ratio improving, Kenya still remains overbanked as the number of banks remains relatively high compared to the population. For more on this see our topical.
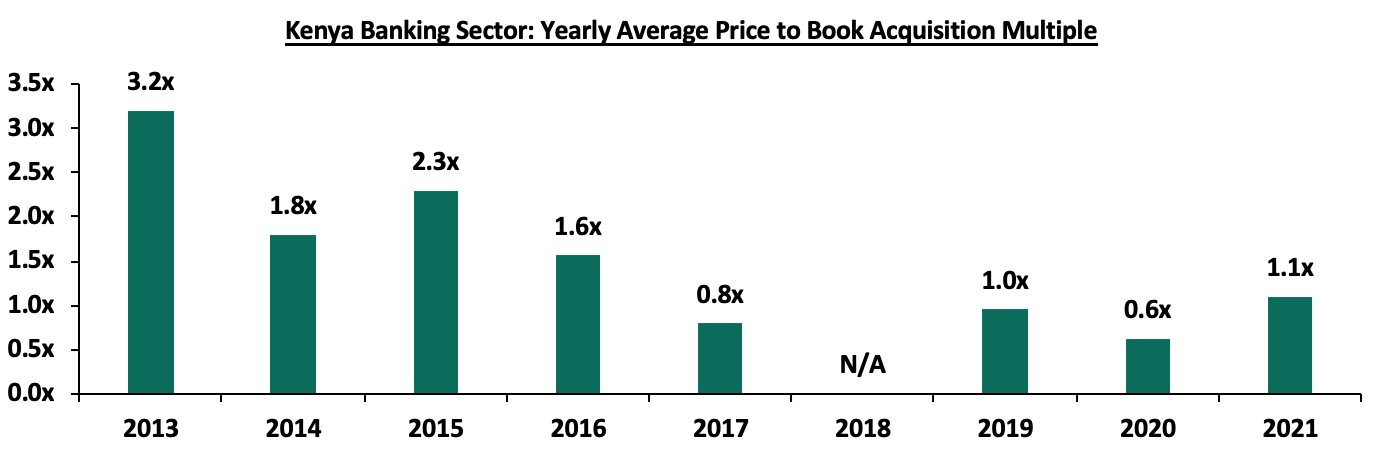
After a consistent decline in the acquisition valuation for banks, we saw an increase in the valuations from the average of 0.6x in 2020 to 1.1x so far in 2021. This however still remains low compared to historical prices paid as highlighted in the chart below;
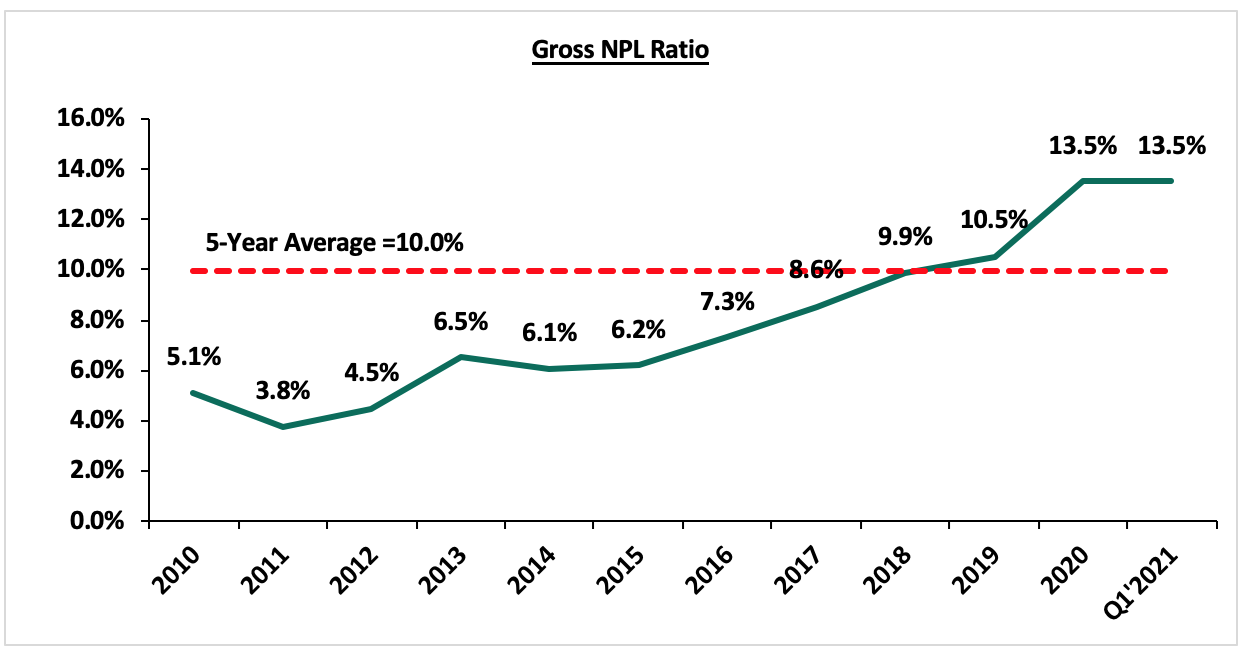
3. Asset Quality Deterioration: Asset quality for listed banks deteriorated in Q1’2021, with the Gross NPL ratio rising by 2.1% points to 13.5% from 11.4% in Q1’2020. Key to note, the listed banks’ NPL ratio of 13.5% is the highest it has ever been and is higher than the 5-year average of 10.0%. The deterioration in asset quality was due to the coronavirus-induced downturn in the economy, which led to an uptick in the non-performing loans. The NPL coverage rose to 62.0% in Q1’2021, from 57.4% recorded in Q1’2020, in accordance with IFRS 9, where banks are expected to provide both for the incurred and expected credit losses. The significantly higher provisional requirement levels coupled with the increased credit risk led to slower loan growth in Q1’2021, which came in at 11.2% compared to a growth of 14.1% in Q1’2020. According to the May 2021 MPC Press Release, the NPL ratio for the entire banking sector stood at 14.2% as at April 2021, a deterioration from 14.1% in December 2020.
The chart below highlights the asset quality trend:
https://cytonnreport.com/storage/research/60c596b1970155.92407539.png
The table below highlights the asset quality for the listed banking sector:
| Q1’2020 NPL Ratio** | Q1’2021 NPL Ratio* | Q1’2020 NPL Coverage** | Q1’2021 NPL Coverage* | % point change NPL Ratio | % point change NPL Coverage |
ABSA | 8.1% | 7.5% | 64.5% | 73.4% | (0.6%) | 9.8% |
DTB-K | 8.0% | 10.6% | 42.4% | 46.5% | 2.6% | 4.1% |
I&M Holdings | 11.3% | 11.9% | 58.8% | 61.1% | 0.6% | 2.3% |
Equity Group | 11.2% | 12.1% | 45.8% | 55.5% | 0.9% | 9.7% |
NCBA Group | 14.5% | 14.7% | 54.5% | 65.0% | 0.2% | 10.5% |
KCB | 11.1% | 14.9% | 61.3% | 61.6% | 3.8% | 0.3% |
Stanbic Bank | 12.1% | 15.1% | 59.3% | 63.9% | 3.0% | 4.6% |
SCBK | 14.2% | 16.4% | 78.1% | 81.1% | 2.2% | 3.0% |
Co-op Bank | 10.8% | 16.9% | 54.8% | 58.4% | 6.1% | 3.6% |
HF Group | 27.3% | 24.7% | 52.2% | 64.7% | (2.6%) | 12.5% |
Mkt Weighted Average | 11.4% | 13.5% | 57.4% | 62.0% | 2.1% | 4.7% |
*Market cap weighted as at 08/06/2021 | ||||||
**Market cap weighted as at 02/06/2020 | ||||||
Key take-outs from the table include;
- Asset quality for the listed banks deteriorated during the period of review, with the weighted average NPL ratio rising by 2.1% points to a market cap weighted average of 13.5%, from an average of 11.4% in Q1’2020. The deterioration in asset quality was as a result of increased non-performing loans due to the increased credit risk as the economy slowed down due the Covid-19 pandemic, and,
- NPL Coverage for the listed banks increased to a market cap weighted average of 62.0% in Q1’2021, from 57.4% recorded in Q1’2020, as the banks increased their provisioning levels to proactively manage risks given the tough economic conditions occasioned by the pandemic. We expect banks to continue over-provisioning, albeit at a slower rate than in 2020.
4. Capital Raising : In Q1’2021, listed banks’ turned to borrowing from international institutions to not only strengthen their capital position but also boost their ability to lend to the perceived riskier Micro Small and Medium Sized Enterprises (MSMEs) segment in order to support the small businesses in the tough operating environment occasioned by the COVID-19 pandemic. Some of the loans taken up for onward lending to MSMEs include:
- In January 2021, Cooperative Bank announced it had received a USD 75.0 mn (Kshs 8.3 bn) loan from the International Finance Corporation (IFC) to facilitate lending to MSMEs and businesses undertaking climate-friendly projects. The loan, which has a 7-year repayment period will also help match the bank’s assets-liabilities match, with long term loans being financed by long term debt. Cooperative Bank also received a USD 15.0 mn (Kshs 1.6 bn) loan from Swedfund in February 2021 to enhance the bank’s ability to lend to SMEs and increase their access to funding particularly in the midst of a pandemic,
- In January 2021, Equity Bank obtained a USD 50.0 mn (Kshs 5.9 bn) loan from Dutch Development Bank (FMO) to enable the bank to lend to perceived riskier small enterprises who have been hard hit by the pandemic. Additionally, Equity received a €0 mn (Kshs 15.8 bn) facility from the European Union and the European Investment Bank (EIB) in March 2021 to support access to finance MSMEs including in the agricultural sector and help entrepreneurs and small businesses better withstand the economic challenges and uncertainties caused by COVID-19,
- KCB Bank received a USD 150.0 mn (Kshs 16.4 bn) loan from the IFC, The SANAD Fund for MSMEs (SANAD), the Belgium Investment Company for Developing Countries (BIO) and Symbiotics in March 2021 to help the bank increase lending for climate-friendly projects and smaller businesses especially those owned by women, and,
- I&M Bank received a USD 50.0 mn (Kshs 5.4 bn) from IFC in May 2021 to expand lending to MSMEs. The loan, with a five year grace period and maturity of 7 years will also serve as an additional capital buffer for the bank.
The table below highlights the disclosed loan facilities that banks have secured for capital injection and lending to the MSMEs in Q1’2021:
Bank | Amount Borrowed For Onward Lending (Kshs bn) | Purpose |
Equity Bank | 21.7 | MSME lending |
KCB Bank | 16.4 | MSME lending |
Cooperative Bank | 9.9 | *MSME lending and Tier II Capital |
I&M Bank | 5.4 | *MSME lending and Tier II Capital |
Total | 53.4 |
*Tier II Capital refers to a bank’s supplementary capital which includes senior debt (debt that a company must repay first before going out of business) with a tenure of not less than five years
Section II: Summary of the Performance of the Listed Banking Sector in Q1’2021:
The table below highlights the performance of the banking sector, showing the performance using several metrics, and the key take-outs of the performance;
Bank | Core EPS Growth | Interest Income Growth | Interest Expense Growth | Net Interest Income Growth | Net Interest Margin | Non-Funded Income Growth | NFI to Total Operating Income | Growth in Total Fees & Commissions | Deposit Growth | Growth in Government Securities | Loan to Deposit Ratio | Loan Growth | Return on Average Equity |
NCBA | 73.8% | 8.1% | (5.7%) | 19.9% | 5.9% | (3.3%) | 44.3% | (8.1%) | 11.2% | 15.1% | 56.0% | (1.1%) | 8.1% |
Equity | 63.8% | 31.9% | 42.4% | 28.4% | 7.6% | 30.7% | 42.3% | 21.5% | 58.2% | 16.1% | 61.7% | 28.6% | 18.9% |
ABSA | 23.7% | (0.3%) | 17.6% | 5.9% | 7.0% | (3.9%) | 32.0% | 7.4% | 7.7% | 1.1% | 84.9% | 7.5% | 13.6% |
Stanbic | 23.1% | 0.5% | (7.3%) | 5.0% | 6.1% | 19.3% | 46.7% | (8.5%) | 10.6% | 42.3% | 69.5% | (2.4%) | 13.2% |
SCBK | 18.9% | (9.0%) | (30.2%) | (2.8%) | 6.7% | 11.1% | 35.1% | 11.7% | 8.9% | 7.8% | 44.4% | (6.1%) | 11.3% |
I&M | 13.5% | 10.2% | (5.2%) | 23.4% | 5.4% | (17.7%) | 29.7% | (5.3%) | 9.3% | 89.5% | 73.4% | 5.6% | 13.3% |
KCB | 1.8% | 8.7% | 1.8% | 11.1% | 8.4% | (20.0%) | 27.4% | (26.5%) | 1.2% | 4.7% | 79.7% | 7.8% | 13.9% |
DTB-K | 0.5% | 4.8% | 2.9% | 6.2% | 5.3% | (1.9%) | 23.9% | (20.5%) | 10.6% | 7.9% | 68.2% | 2.3% | 5.7% |
COOP | (3.7%) | 27.6% | 19.8% | 30.7% | 8.6% | (9.2%) | 32.0% | (15.7%) | 16.0% | 43.4% | 75.7% | 8.0% | 12.3% |
HF | N/A | (18.7%) | (19.0%) | (18.3%) | 4.1% | (46.7%) | 22.0% | (36.2%) | (2.1%) | 13.4% | 96.2% | (6.9%) | (20.4%) |
Q1'21 Mkt Weighted Average* | 28.4% | 14.7% | 12.7% | 17.5% | 7.4% | 2.9% | 35.3% | (2.4%) | 21.8% | 20.3% | 69.2% | 11.0% | 13.8% |
Q1'20 Mkt Weighted Average** | (7.3%) | 8.2% | 11.4% | 7.4% | 7.2% | 15.9% | 22.7% | 24.5% | 14.3% | 14.9% | 74.1% | 14.1% | 17.2% |
*Market cap weighted as at 08/06/2021 | |||||||||||||
**Market cap weighted as at 02/06/2020 | |||||||||||||
Key takeaways from the table above include:
- The listed banks recorded a 28.4% weighted average growth in core Earnings per Share (EPS), compared to a weighted average decline of 7.3% in Q1’2020 for the entire listed banking sector. The performance is largely skewed by the strong performance from NCBA and Equity Group,
- The Banks have recorded a weighted average deposit growth of 21.8%, faster than the 14.3% growth recorded in Q1’2020,
- Interest expense grew at a faster pace, by 12.7%, compared to the 11.4% growth in Q1’2020 while cost of funds declined, coming in at a weighted average of 2.5% in Q1’2021, from 3.0% in Q1’2020, owing to the faster growth in average interest-bearing liabilities, an indication that the listed banks were able to mobilize cheaper deposits,
- Average loan growth came in at 11.0%, lower than the 14.1% growth recorded in Q1’2020. The loan growth was also slower than the 20.3% growth in government securities, an indication of the banks’ preference of investing in Government securities as opposed to lending due to the elevated credit risk occasioned with the pandemic. The faster growth in government securities could also be attributed to cautious lending by banks in a bid to reduce cost of risk as well as mitigate further deterioration of the asset quality,
- Interest income grew by 14.7%, compared to a growth of 8.2% recorded in Q1’2020. Notably, the Yield on Interest Earning Assets (YIEA) increased to 10.2%, from the 9.8% recorded in Q1’2020, an indication of the increased allocation to higher-yielding government securities by the sector during the period. Consequently, the Net Interest Margin (NIM) now stands at 7.4%, 0.2% points higher than the 7.2% recorded in Q1’2020 for the whole listed banking sector, and,
- Non-Funded Income grew by 2.9%, compared to the 15.9% growth recorded in Q1’2020. This can be attributable to a slower growth in the fees and commission which declined by 2.4% compared to a growth of 24.5% in Q1’2020.
Section III: Outlook of the banking sector:
The banking sector remained resilient during the quarter, as evidenced by the increase in profitability, with the Core Earnings Per Share (EPS) growing by 28.4%, despite the tough prevailing operating environment occasioned by the COVID-19 pandemic. The increase in EPS is mainly attributable to the 17.5% growth in Net Interest Income (NII) compared to the 7.4% growth recorded in Q1’2020. Provisioning levels for most listed banks also declined, pointing to reduced credit risk during the period and in turn boosting the sector’s bottom line. We expect the reduction in provisioning levels to be a recurrent theme in 2021. However, the banking sector’s Loan Loss Provisions are expected to remain higher than the pre-COVID period and historic average and as such, banks will continue to overprovision during the period. The waiver of charges on transactions weighed down the Non-Funded Income (NFI) performance, with the listed banks recording a slower 2.9% weighted growth in NFI, from the 15.9% growth recorded in Q1’2020. Following the expiry of the waiver on fees and commissions on loans and the loan restructuring window having closed in March 2021, we expect the banking sector’s performance to improve in the medium to long term. Based on the current operating environment, we believe the future performance in the banking sector will be shaped by the following key factors:
- Growth in Interest income: With interest income growth at 14.7% in Q1’2021 outpacing the 8.2% growth recorded in Q1’2020, we believe that interest income growth will remain a key industry driver going forward. The continued allocation to government securities which witnessed slight increases in yields in Q1’2021 will also lead to an increase in the overall interest income. The expiry of the restructuring and moratorium window given to borrowers will also enable banks to further increase interest income growth which will lead to increased profitability. Key to note, some banks are still supporting borrowers after the expiry of the loan restructuring window and this could slow down the recovery of interest income in the medium term,
- Revenue Diversification: In Q1’2021, Non-Funded Income recorded a 2.9% weighted average growth, slower than the 15.9% recorded in Q1’2020, attributable to the waiver on fees and commissions on loans and advances issued by the CBK on March 2020. The banking sector’s Non-Funded Income to Operating Income however improved, coming in at 35.3% in Q1’2021, compared to 22.7% of Operating Income in Q1’2020. Given that Non-Funded Income contributes less than 50.0% of listed banks’ operating income, there exists an opportunity for the sector to increase NFI contribution to revenue going forward. With the expiry of the waiver on bank charges on 2nd March 2021, we expect NFI growth to recover in the medium-long term due to the increased adoption of digital channels. According to Central Bank Annual Report 2019/2020, 67.0% of banking transactions were conducted on mobile phones after the onset of the pandemic, compared to 55.0% of transactions before the pandemic. Moreover, more than 1.6 mn additional customers are now using mobile-money channels compared to the period before the pandemic began. The increased uptake of digital channels will enable banks to leverage on these platforms and generate Non-Funded Income from transactions. This presents an ideal opportunity for the banking sector to diversify away from their reliance on interest income in the long term and boost revenue growth,
- Provisioning: Loan Loss Provisions recorded a slower growth of 5.5% in Q1’2021 compared to a growth of 233.2% in FY’2020, signifying improving business conditions and reduction of credit risk. However, given that the duration of the pandemic remains unknown, coupled with the emergence of new variants of COVID-19 in the country, we believe that the normalization of the sector’s provisioning levels to pre-pandemic levels will take longer than expected. The proactive stance taken by the banks in monitoring their loan books will however continue to support the sector’s growth,
- Cost Rationalization: Given the low revenues and increased automation, banks are expected to continue pursuing their cost rationalization strategies. Majority of banks have been riding on the digital revolution wave to improve their operational efficiency. Increased adoption of alternative channels of transactions such as mobile, internet, and agency banking has led to increased transactions carried out via alternative channels and out of bank branches, which have been reduced to handling high-value transactions and other services such as advisory. ABSA Bank, for example, succeeded in moving 87.0% of transactions outside the branch as at FY’2020. With the COVID-19 pandemic necessitating contactless transactions, banks reduced front-office operations, thereby cutting the number of staff required and by extension, reducing operating expenses and hence, improving operational efficiency, and,
- Expansion and Further Consolidation: With consolidation remaining a key theme going forward, the current environment could provide opportunities for bigger banks with an adequate capital base to expand and take advantage of the low valuations in the market to further consolidate and buy out smaller banks. Consolidation will be key for most of the smaller banks that suffered losses during the pandemic, and would also benefit larger banks with the opportunity to improve their asset base. We believe that consolidation could also increase post-COVID as tier one banks resume their expansion strategies both locally and regionally as the economy improves.
Section IV: Brief Summary and Ranking of the Listed Banks:
As per our analysis on the banking sector from a franchise value and a future growth opportunity perspective, we carried out a comprehensive ranking of the listed banks. For the franchise value ranking, we included the earnings and growth metrics as well as the operating metrics shown in the table below in order to carry out a comprehensive review of the banks:
Bank | Loan to Deposit Ratio | Cost to Income (with LLP) | Return On Average Capital Employed | Deposits/Branch | Gross NPL Ratio | NPL Coverage | Tangible Common Ratio | Non Funded Income /Revenue |
SCBK | 44.4% | 52.0% | 11.3% | 7.4 | 16.4% | 81.1% | 14.7% | 35.1% |
NCBA Group | 56.0% | 65.6% | 8.1% | 6.2 | 14.7% | 65.0% | 12.8% | 44.3% |
Equity Bank | 61.7% | 54.4% | 18.9% | 2.4 | 12.1% | 55.5% | 11.8% | 42.3% |
DTBK | 68.2% | 54.0% | 5.7% | 2.3 | 10.6% | 46.5% | 15.2% | 23.9% |
Stanbic Bank | 69.7% | 56.9% | 13.2% | 9.1 | 15.1% | 63.9% | 13.5% | 46.3% |
I&M Holdings | 73.4% | 58.0% | 13.3% | 4.0 | 11.9% | 61.1% | 16.7% | 29.7% |
Coop Bank | 75.7% | 64.5% | 12.3% | 2.2 | 15.8% | 58.4% | 15.9% | 31.5% |
KCB Group | 79.7% | 60.4% | 13.9% | 2.1 | 14.9% | 61.6% | 14.6% | 27.4% |
Absa Bank | 84.9% | 61.3% | 10.2% | 3.1 | 7.5% | 73.4% | 12.6% | 32.3% |
HF Group | 96.2% | 129.3% | (20.4%) | 1.7 | 24.7% | 64.7% | 14.3% | 22.2% |
Weighted Average Q1'2021 | 69.2% | 58.7% | 13.8% | 3.4 | 13.5% | 62.0% | 13.8% | 35.4% |
The overall ranking was based on a weighted average ranking of Franchise value (accounting for 60.0%) and intrinsic value (accounting for 40.0%). The Intrinsic Valuation is computed through a combination of valuation techniques, with a weighting of 40.0% on Discounted Cash-flow Methods, 35.0% on Residual Income and 25.0% on Relative Valuation, while the Franchise ranking is based on banks operating metrics, meant to assess efficiency, asset quality, diversification, and profitability, among other metrics. The overall Q1’2021 ranking is as shown in the table below:
Bank | Franchise Value Rank | Intrinsic Value Rank | Weighted Rank | FY'2020 | Q1'2021 |
I&M Holdings | 1 | 1 | 1.0 | 1 | 1 |
KCB Group Plc | 2 | 3 | 2.6 | 3 | 2 |
Equity Group | 6 | 2 | 3.6 | 2 | 3 |
Stanbic Bank/Holdings | 4 | 7 | 5.8 | 6 | 4 |
ABSA | 3 | 8 | 6.0 | 4 | 5 |
NCBA Group Plc | 9 | 4 | 6.0 | 9 | 5 |
DTBK | 8 | 5 | 6.2 | 5 | 7 |
Co-operative Bank of Kenya | 7 | 6 | 6.4 | 7 | 8 |
SCBK | 5 | 9 | 7.4 | 8 | 9 |
HF Group Plc | 10 | 10 | 10.0 | 10 | 10 |
Major Changes from the FY’2020 Ranking are:
- Stanbic Holdings recorded an improvement in the overall ranking, coming in at position 4 from position 6 in FY’2020 attributable to a 19.3% increase in the group’s Non-Funded Income which contributed to an increase in the bank’s franchise value score, coupled with an improvement in the group’s NPL coverage which recorded a 3.3% points increase to 63.9% from 60.6% recorded in FY’2020,
- NCBA’s rank improved to position 5 from position 9 in FY’2020 attributable to a 30.1% decline in Loan Loss Provision, which contributed to an increase in the bank’s franchise value score, coupled with an Improvement in the bank’s NPL coverage, which recorded a 4.1% points increase to 65.0% from 60.9% in FY’2020, and,
- Diamond Trust Bank Kenya’s (DTB-K) rank declined to Position 7 from Position 5 in FY’2020, mainly due to the bank having the lowest NPL coverage of the listed banks at 46.5% despite the deterioration of asset quality, which saw the bank’s NPL ratio increase by 2.6% points to 10.6% from 8.0% recorded in FY’2020.
For more information, see our Cytonn Q1'2021 Listed Banking Sector Review
Disclaimer: The views expressed in this publication are those of the writers where particulars are not warranted. This publication, which is in compliance with Section 2 of the Capital Markets Authority Act Cap 485A, is meant for general information only and is not a warranty, representation, advice or solicitation of any nature. Readers are advised in all circumstances to seek the advice of a registered investment advisor.
- Talk to us
- Kenya
- P.O Box 20695 - 00200, Nairobi, Kenya
- Cell +254709101200
- Tel +254709101200
- WhatsApp +254741676635
- United States
- +254709101200
- DOWNLOAD OUR APP


- Kenya
- 8th Floor, Pinetree Plaza, Kaburu Drive, Ngong Road, Nairobi, Kenya
- USA
- Suite 1150, 1775 Eye Street NW, USA, Washington DC 20006, USA
- Investments
- High Yield
- Private Equity
- Real Estate
- Real Estate
- RiverRun Estates
- Cytonn Towers
- The Ridge
- Taraji Heights
- The Alma