Financial Planning For Retirement, & Cytonn Weekly #33/2020
By Research Team, Aug 16, 2020
Executive Summary
Fixed Income
During the week, T-bills were undersubscribed, with the subscription rate coming in at 92.8% down from 135.0% the previous week, mainly due to investors’ preference to participate in the primary bond market where there is a tap-sale for an 11-year amortized infrastructure bond namely, IFB1/2020/11. During the week, the Energy and Petroleum Regulatory Authority (EPRA) released their monthly statement on the Maximum Retail Prices in Kenya for the period 15th August 2020 to 14th September 2020. The monthly review of petroleum prices was released with the petrol, diesel and kerosene all increasing by 3.5%, 3.0% and 27.8%, respectively;
Equities
During the week, the equities market was on a downward trend, with NSE 20, NASI and NSE 25 recording declines of 0.8%, 0.9% and 1.7%, respectively, taking their YTD performance to losses of 22.2%, 34.3%, and 28.3%, for NASI, NSE 20 and NSE 25, respectively. The NASI performance was driven by declines recorded by large-cap stocks, with the highest declines being recorded in Equity Group, KCB and Diamond Trust Bank, which lost by 8.7%, 7.3%, and 2.5%, respectively. During the week, Equity Group Holdings completed the 66.5% stake acquisition of the Banque Commerciale Du Congo (BCDC) at a cost of USD 95.0 mn (Kshs 10.3 bn). During the week, KCB Group, Co-operative Bank and Stanbic Holdings released their H1’2020 financial results;
Real Estate
During the week, the Kenya Bankers Association and Hass Consult released their Q2’2020 housing price reports, highlighting increased demand for apartments attributed to their affordability. According to Hass Consult, apartments recorded a 2.2% growth in rents q/q indicating sustained demand for rental housing amidst a tough financial environment. In the residential sector, the Kenya Mortgage Refinancing Company (KMRC) announce that it would begin lending in September 2020 following approval to operate by the Central Bank of Kenya, while the National Cooperative Housing Union (NaCHU) suspended the implementation of its housing projects citing reduced contributions and repayments by its members due to the ongoing Covid-19 pandemic. The Ministry of Lands announced that land transactions in Nairobi city must be done online as per the Land Registration (Electronic Land Transactions) Regulations 2020.
Focus of the Week
This week, in our topical, we continue with our personal financial planning series where we discuss allocation of savings towards achieving financial independence in retirement and the avenues that promote such retirement savings;
- Weekly Rates:
- Cytonn Money Market Fund closed the week at a yield of 10.60%. To invest, just dial *809#;
- Cytonn High Yield Fund closed the week at a yield of 12.81% p.a. To invest, email us at sales@cytonn.com and to withdraw the interest you just dial *809#
- For an exclusive tour of Cytonn’s real estate developments, visit: Sharp Investor's Tour and for more information, email us at sales@cytonn.com;
- We continue to offer Wealth Management Training daily, from 9:00 am to 11:00 am, through our Cytonn Foundation. The training aims to grow financial literacy among the general public. To register for any of our Wealth Management Training, click here;
- For Pension Scheme Trustees and members, we shall be having different industry players talk about matters affecting Pension Schemes and the pensions industry at large. Join us every Wednesday from 9:00 am to 11:00 am for in-depth discussions on matters pension;
- Cytonn continues to inform the market on the importance of retirement planning and issues affecting the pensions industry. In this week's article we focus on Income Replacement Ratio upon retirement here;
- If interested in our Private Wealth Management Training for your employees or investment group, please get in touch with us through wmt@cytonn.com;
- For recent news about the company, see our news section here;
- We have 10 investment-ready projects, offering attractive development and buyer targeted returns. See further details here: Summary of Investment-ready Projects.
Money Markets, T-Bills & T-Bonds Primary Auction:
During the week, T-bills were undersubscribed, with the subscription rate coming in at 92.8% down from 135.0% the previous week, mainly due to investors’ preference to participate in the primary bond market where there is a tap-sale for an 11-year amortized infrastructure bond namely, IFB1/2020/11. The yields on the 91-day paper and 182-day paper both increased marginally during the week by 0.1% points to close the week at 6.2% and 6.6%, respectively, from 6.1% and 6.5% recorded the previous week, while that of the 364-day papers remained unchanged at 7.5%, similar to what was recorded the previous week. The acceptance rate decreased to 83.8%, from 94.1% recorded the previous week, with the government accepting Kshs 18.6 bn of the Kshs 22.3 bn worth of bids received.
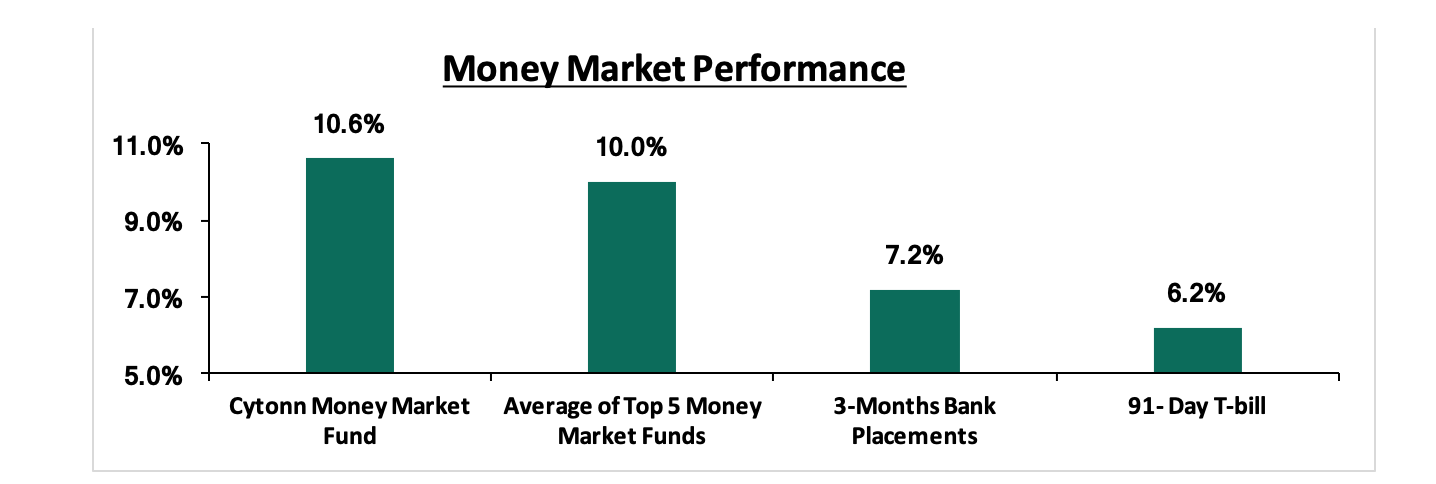
In the money markets, 3-month bank placements ended the week at 7.2% (based on what we have been offered by various banks), while the yield on the 91-day T-bill increased marginally to 6.2%, from 6.1% recorded the previous week. The average yield of Top 5 Money Market Funds declined marginally to 10.0% from 10.1% recorded the previous week. The yield on the Cytonn Money Market also declined marginally to close at 10.6%, from 10.7% recorded the previous week.
Liquidity:
The money market remained liquid during the week with the average interbank rate declining to 2.0%, down from the 2.5% recorded the previous week mainly supported by government payments. The average interbank volumes increased by 25.3% to Kshs 12.9 bn, from Kshs 10.2 bn recorded the previous week. According to the Central Bank of Kenya, commercial banks’ excess reserves came in at Kshs 23.2 bn.
Kenya Eurobonds:
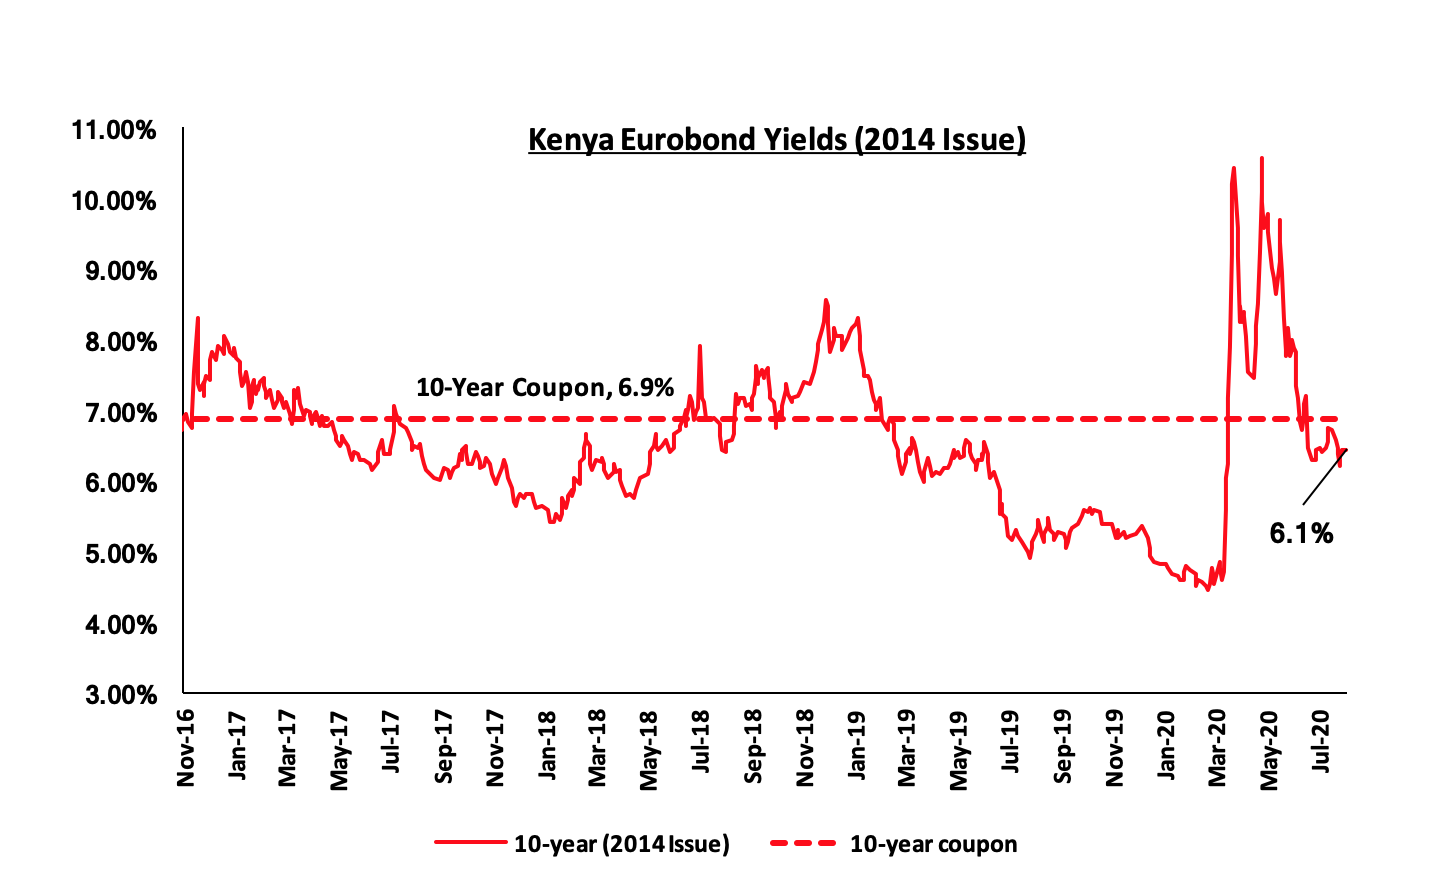
According to Reuters, Kenyan Eurobond yields were on a downward trend during the week, pointing to improving investor confidence in the country. The yield on the 10-year Eurobond issued in June 2014 declined by 0.3% points to 6.1%, from 6.4% recorded the previous week.
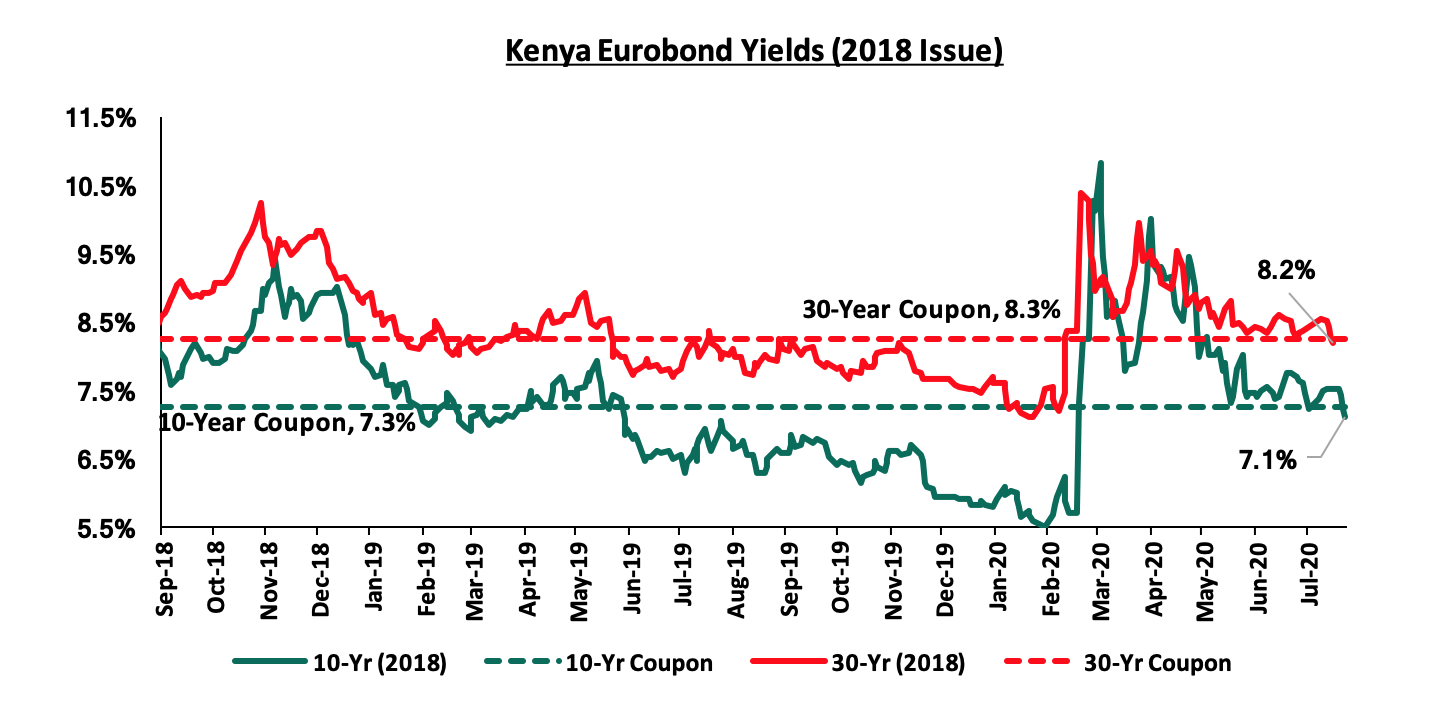
The yields on the 10-year and 30-year Eurobonds issued in 2018 both declined by 0.4% points and 0.3% points to 7.1% and 8.2%, respectively, from 7.5% and 8.5% recorded the previous week,
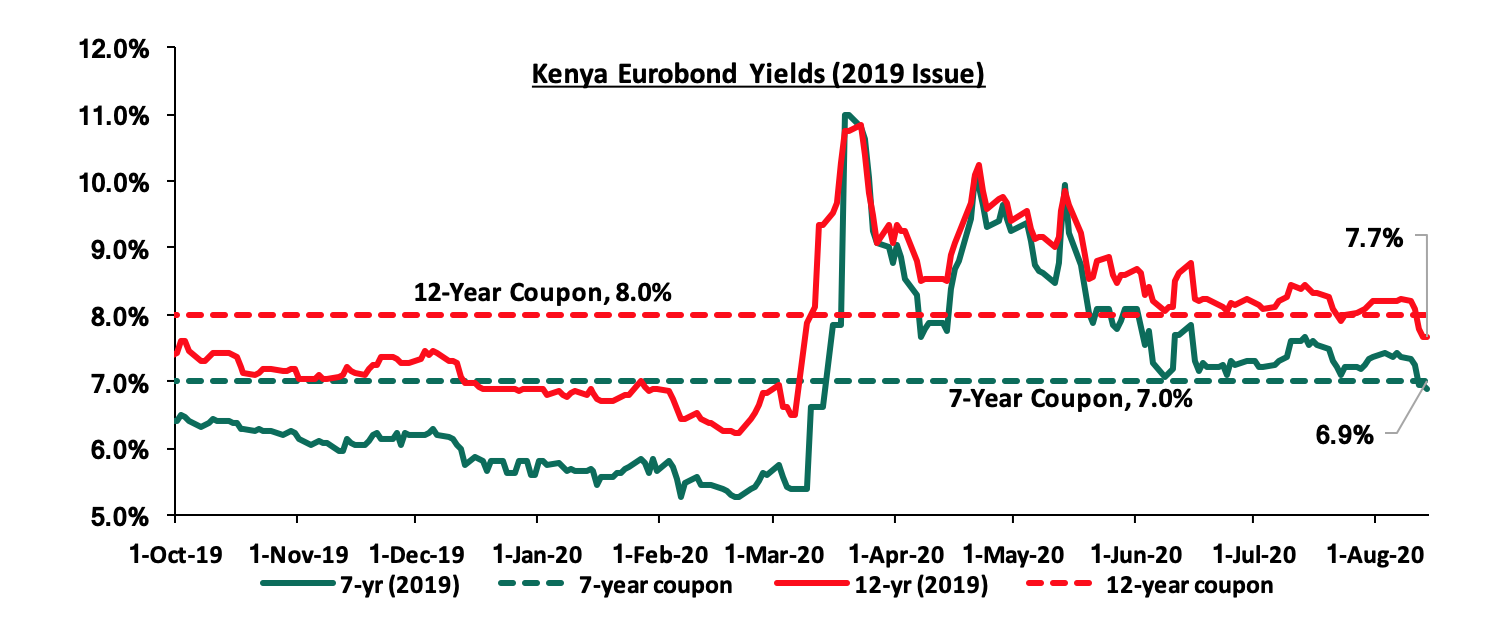
The yields on the 7-year Eurobond and 12-year Eurobond issued in 2019 both declined by 0.5% points to 6.9% and 7.7%, respectively, from 7.4% and 8.2% recorded the previous week.
Kenya Shilling:
During the week, the Kenya Shilling depreciated by 0.3% against the US Dollar to close the week at Kshs 108.3, from Kshs 108.0, recorded the previous week, attributable to increased dollar demand from Safaricom ahead of its Kshs 56.1 bn dividend payout, which they have to clear by the end of the month. On an YTD basis, the shilling has depreciated by 6.9% against the dollar, in comparison to the 0.5% appreciation in 2019. We expect continued pressure on the shilling due to:
- Demand from merchandise and energy sector importers as they beef up their hard currency positions,
- A deteriorating current account position, with the current account deficit deteriorating by 10.2% during Q1’2020, to Kshs 110.9 bn, from Kshs 100.6 bn recorded in Q1’2019 attributable to;
- 3.0% decline in the secondary income (transfers recorded in the balance of payments whenever an economy provides or receives goods, services, income or financial items) balance, to Kshs 124.1 bn, from Kshs 128.0 bn in Q1’2019, and,
- A 67.0% decline in the services trade balance (the difference between the imports and exports of services) to Kshs 20.4 bn, from Kshs 61.9 bn.
The shilling is however expected to be supported by:
- High levels of forex reserves, currently at USD 9.3 mn (equivalent to 5.6-months of import cover), above the statutory requirement of maintaining at least 4.0-months of import cover, and the EAC region’s convergence criteria of 4.5-months of import cover, and,
- Improving diaspora remittances evidenced by the 11.8% increase to USD 288.5 mn in June 2020, from USD 258.2 seen the previous month. In terms of y/y performance, diaspora remittances decreased by 2.3% to USD 288.5 mn in June 2020, from USD 295.3 mn recorded in June 2019.
Weekly Highlight:
During the week, the Energy and Petroleum Regulatory Authority (EPRA) released their monthly statement on the Maximum Retail Prices in Kenya for the period 15th August 2020 to 14th September 2020. Below are the key take-outs from the statement:
- Petrol prices have increased by 3.5% to Kshs 104.0 per litre from Kshs 100.5 per litre previously, while diesel prices have increased by 3.0% to Kshs 94.6 per litre from Kshs 91.9 per litre. Kerosene prices also increased by 27.8% to Kshs 83.7 per litre from 65.5 per litre, previously,
- The changes in prices have been attributed to:
- An increase in the average landing cost of imported super petrol by 14.2% to USD 319.2 per cubic meter in July 2020 from USD 279.6 per cubic meter in June 2020,
- Landing costs for diesel increased by 10.3% to USD 333.3 per cubic meter in July 2020, from USD 302.2 per cubic meter in June 2020,
- A 127.9% increase in the landing costs for Kerosene to USD 288.0 in July 2020, from USD 126.4 per cubic meter in June 2020. This can be attributed to the lack of imports in July, meaning there was no price change the previous month, hence the sharp rise,
- A 21.9%, increase in Free on Board (FOB) price of Murban crude oil lifted in July 2020 to USD 44.3 per barrel, from USD 36.3 per barrel in June 2020, and,
- The Kenyan shilling depreciated by 0.9% against the dollar to close at Kshs 107.5 in July 2020, from Kshs 106.5. in June 2020
We expect the increase to not only affect the transport index, which carries a weighting of 8.7% in the total consumer price index (CPI) but also have a ripple effect on the prices of other commodity baskets such as food & alcohol prices due to the higher transport costs. We also expect pressures to be experienced in the housing, water, electricity, gas and other fuels index given the 27.8% increase in the price of kerosene.
Rates in the fixed income market have remained relatively stable due to the high liquidity in the money markets, coupled with the discipline by the Central Bank as they reject expensive bids. The government is 79.7% ahead of its prorated borrowing target of Kshs 65.5 bn having borrowed Kshs 117.6 bn. In our view, the government will not be able to meet their revenue collection targets of Kshs 1.9 tn for FY’2020/2021 and therefore leading to a larger budget deficit than the projected 7.5% of GDP, ultimately creating uncertainty in the interest rate environment as additional borrowing from the domestic market will be required to plug in the deficit. Owing to this uncertain environment, our view is that investors should be biased towards short-term to medium-term fixed income securities to reduce duration risk.
Market Performance
During the week, the equities market was on a downward trend, with NSE 20, NASI and NSE 25 recording declines of 0.8%, 0.9% and 1.7%, respectively, taking their YTD performance to losses of 22.2%, 34.3%, and 28.3%, for NASI, NSE 20 and NSE 25, respectively. The NASI performance was driven by declines recorded by large-cap stocks, with the highest declines being recorded in Equity Group, KCB and Diamond Trust Bank, which lost by 8.7%, 7.3%, and 2.5%, respectively.
Equities turnover declined by 43.2% during the week to USD 15.3 mn, from USD 26.9 mn recorded the previous week, taking the YTD turnover to USD 976.5 mn. Foreign investors remained net sellers during the week, with a net selling position of USD 1.1 mn, from a net selling position of USD 1.3 mn recorded the previous week, taking the YTD net selling position to USD 268.0 mn.
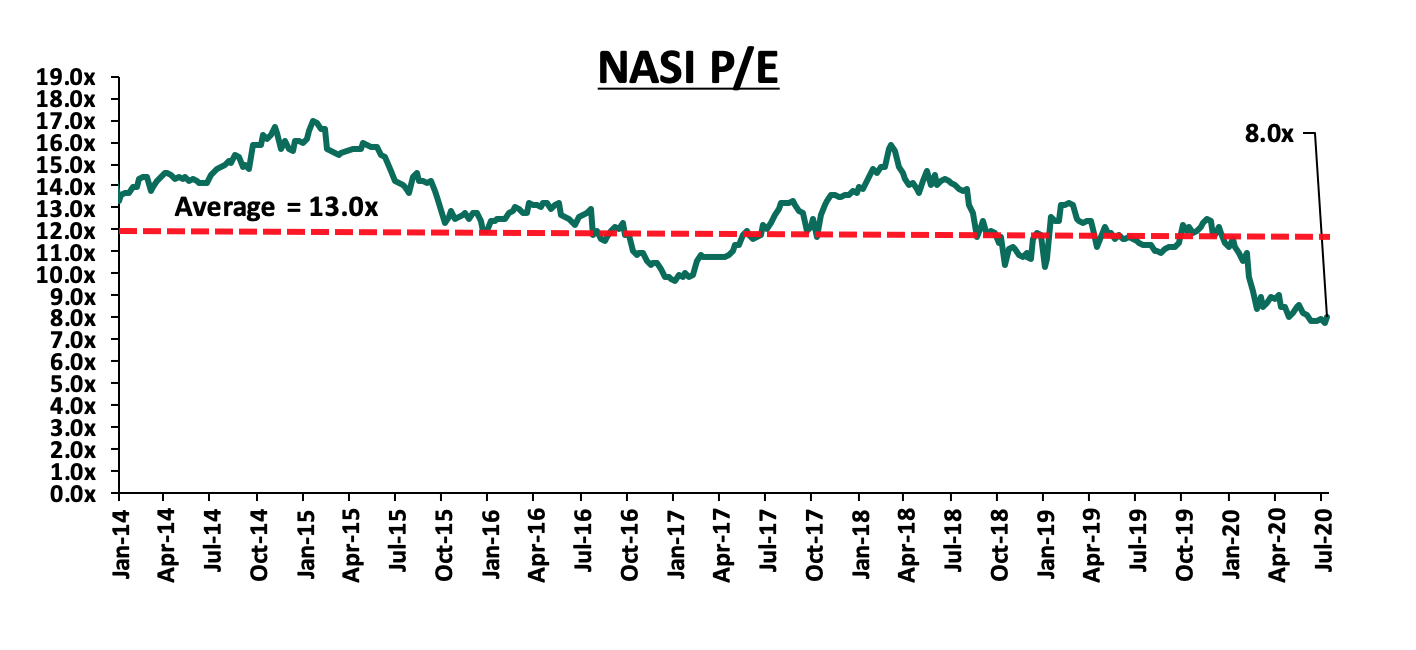
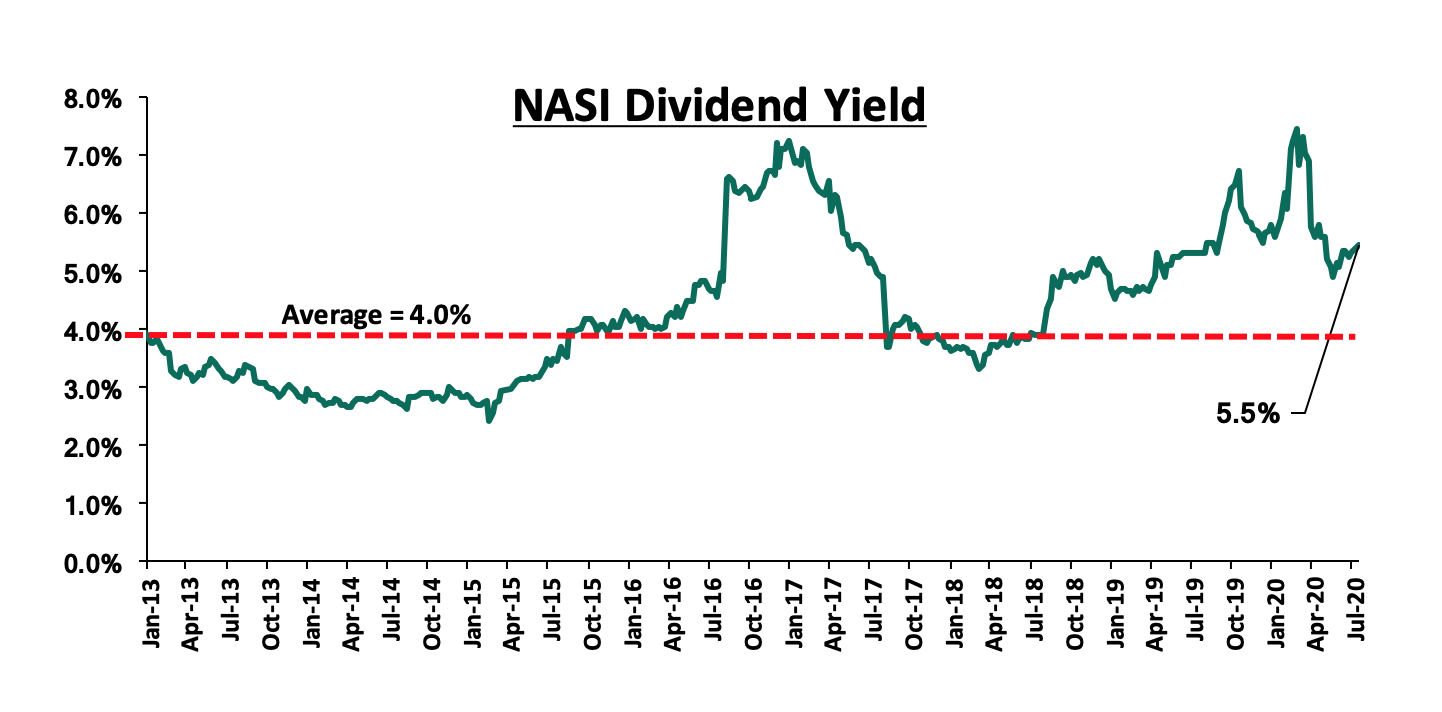
The market is currently trading at a price to earnings ratio (P/E) of 8.0x, 38.8% below the 11-year historical average of 13.0x. The average dividend yield is currently at 5.5%, 0.1% points above the 5.4% recorded the previous week and 1.5% points above the historical average of 4.0%. The rise in dividend yield is attributable to price declines recorded by most stocks, however, the dividend yield has been weighed down by the decision by most companies to withhold dividend payments. With the market trading at valuations below the historical average, we believe there are pockets of value in the market for investors with higher risk tolerance and are willing to wait out the pandemic. The current P/E valuation of 8.0x is 2.3% above the most recent valuation trough of 7.8x experienced in the second week of July 2020. The charts below indicate the historical P/E and dividend yields of the market.
Weekly Highlight
During the week, Equity Group Holdings completed the 66.5% stake acquisition of the Banque Commerciale Du Congo (BCDC) at a cost of USD 95.0 mn (Kshs 10.3 bn). The acquisition was first announced by the group on 18th November 2019 and was subject to approvals from the Central Bank of Kenya (CBK), Democratic Republic of Congo’s Central Bank, the COMESA Competition Commission. Initially, the deal was to cost USD 105.0 mn (Kshs 11.4 bn), however factoring in the adverse effects of the COVID-19 pandemic on the two economies, the two parties agreed to reduce the amount to USD 95.0 mn (Kshs 10.3 bn). Following the change in the pricing, the trading multiple for the transaction will now be at a Price to Book value of 1.2x from the earlier 1.3x. Following the acquisition, BCDC will become Equity Groups subsidiary increasing Equity’s subsidiaries in the DRC to two. We believe that the bank’s geographical diversification strategy will continue to emerge as a net positive, with the bank’s various subsidiaries in Uganda, DRC, Rwanda, Tanzania, and South Sudan cumulatively contributing 25.0% of the bank’s total profitability and 28.0% of the group’s total asset base as at Q1’2020.
Earnings Releases:
During the week, KCB Group, Co-operative Bank and Stanbic Holdings released their H1’2020 financial results. Below is a summary of their earnings:
KCB Group
Income Statement
- Core earnings per share declined by 40.4% to Kshs 2.4, from Kshs 4.0 in H1’2019, despite a 16.7% growth in total operating income to Kshs 45.0 bn, from Kshs 38.6 bn, as the total operating expenses grew by 56.0% to Kshs 32.2 bn, from Kshs 20.6 bn in H1’2019. The decline in the core earnings per share was lower than our projected decline of 44.8% as the company had a much faster growth of 7% in the total operating income compared to our projection of 3.9% decline,
- Total operating income rose by 16.7% to Kshs 45.0 bn, from Kshs 38.6 bn in H1’2019. This was driven by a 22.3% rise in Net Interest Income (NII) to Kshs 31.1 bn, from Kshs 25.4 bn in H1’2019, coupled with a 6.0% rise in Non-Funded Income (NFI) to Kshs 14.0 bn, from Kshs 13.2 bn in H1’2019,
- Interest income grew by 23.2% to Kshs 41.4 bn, from Kshs 33.6 bn in H1’2019. This was driven by a 63.6% rise in interest income on government securities to Kshs 10.8 bn, from Kshs 6.6 bn in H1’2019, which outpaced the 11.9% rise in interest income on loans and advances to Kshs 30.0 bn, from Kshs 26.8 bn in H1’2019. The yield on interest-earning assets declined to 10.1% from 11.0% in H1’2019 attributable to faster growth in the average interest-earning assets of 32.0% which outpaced the 21.4% growth in trailing interest income. Trailing interest income, refers to the performance of the interest income for the past 12 consecutive months,
- Interest expense rose by 25.7% to Kshs 10.3 bn, from Kshs 8.2 bn in H1’2019, following a 29.2% rise in interest expense on customer deposits to Kshs 9.3 bn from Kshs 7.2 bn in H1’2019. Interest expense on deposits and placement from banking institutions, rose by 3.1% to Kshs 0.99 bn, from Kshs 0.96 bn in H1’2019. The cost of funds, on the other hand, declined marginally to 2.6% from 3.0% in H1’2019 owing to a faster 31.2% growth in average interest-bearing liabilities, which outpaced the 25.7% rise in the trailing interest expense. Trailing interest expense, refers to the performance of the interest expense for the past 12 consecutive months. The Net Interest Margin (NIM) declined to 7.6% from 8.1% in H1’2019, owing to the faster 32.0% growth in average interest-earning assets, which outpaced the 22.3% growth in Net Interest Income (NII),
- Non-Funded Income (NFI) rose by 6.0% to Kshs 14.0 bn, from Kshs 13.2 bn in H1’2019. The increase was mainly driven by a 14.3% rise in Foreign Exchange trading Income to Kshs 2.4 bn, from Kshs 2.1 bn in H1’2019, coupled with a 4.3% increase in Fees and Commissions from loans and advances to Kshs 4.9 bn, from Kshs 4.7bn in H1’2019. As a result, the revenue mix shifted to 69:31 from 66:34 funded to non-funded income, due to the faster growth in NII compared to NFI,
- Total operating expenses grew by 56.0% to Kshs 32.2 bn, from Kshs 20.6 bn, largely driven by a 263.8% spike in Loan Loss Provisions (LLP) to Kshs 11.0 bn in H1’2020, from Kshs 3.0 bn in H1’2019, coupled with a 12.3% rise in Staff costs to Kshs 10.1 bn in H1’2020, from Kshs 9.0 bn in H1’2019. The increased provisioning levels were witnessed as the Group covered for downgraded facilities, with the expectation of an increase in defaults across sectors, brought about by the COVID-19 pandemic,
- Cost to Income Ratio (CIR) deteriorated to 71.5%, from 53.5% in H1’2019 owing to the faster 56.0% rise in Total Operating Expenses to Kshs 32.2 bn from Kshs 20.6 bn in H1’2019 which outpaced the 16.7% rise in Total Operating Income to Kshs 45.0 bn, from Kshs 38.6 bn in H1’2019. Without LLP however, the cost to income ratio rose to 47.0% from 45.7% in H1’2019, and,
- Profit before tax declined by 28.5% to Kshs 12.8 bn, down from Kshs 17.9 bn in H1’2019 owing to the 263.8% rise in Loan Loss Provisions (LLP) to Kshs 11.0 bn from Kshs 3.0 bn given the poor operating environment due to COVID-19. Profit after tax declined by 40.4% to Kshs 7.6 bn in H1’2020, from Kshs 12.7 bn in H1’2019 with the effective tax rate increasing to 40.9% from 29.1% in H1’2019. The growth in the effective tax rate can be attributed to the 28.5% decline in the profit before tax and the 1.9% increase in total tax to Kshs 5.3 bn from Kshs 5.2 bn in H1’2019.
Balance Sheet
- The balance sheet recorded an expansion as total assets grew by 27.7% to Kshs 953.1 bn, from Kshs 746.5 bn in H1’2019. This growth was driven by a 54.5% rise in investment in government and other securities to Kshs 208.5 bn, from Kshs 135.0 bn in H1’2019. The rise in the investments in government securities is mainly due to the bank's cautious stance with regards to lending. The loan book also recorded a 17.0% growth to Kshs 559.9 bn, from Kshs 478.7 bn in H1’2019. The strong balance sheet growth is also partly attributable to KCB consolidating assets following the acquisition of NBK as first published in the Q1’2020 results,
- Total liabilities rose by 30.5% to Kshs 820.9 bn, from Kshs 629.0 bn in H1’2019, driven by a 34.6% increase in customer deposits to Kshs 758.2 bn, from Kshs 563.2 bn in H1’2019, with customer deposits from NBK amounting to Kshs 99.6 bn in H1’2020. Deposits per branch declined by 4.5% to Kshs 2.1 bn from Kshs 2.2 bn in H1’2019, with the number of branches having increased to 359 as at H1’2020, from 258 in H1’2019,
- The faster growth in deposits as compared to loans led to a decline in the loan to deposit ratio to 73.8%, from 85.0% in H1’2019,
- Gross Non-Performing Loans (NPLs) rose by 114.5% to Kshs 83.9 bn in H1’2020, from Kshs 39.1 bn in H1’2019. Consequently, the NPL ratio deteriorated to 13.8%, from 7.8% in H1’2019, due to the faster growth in Gross Non-Performing Loans (NPLs), which outpaced the growth in loans. The rise in non-performing loans was mainly attributable to the poor performance from the MSMEs segment, Corporate Segment, Mortgage segment and Check-off Loans recording NPL Ratios of 14.9%, 12.0%, 10.3% and 2.9%, respectively,
- General Loan Loss Provisions rose by 124.5% to Kshs 36.1 bn, from Kshs 16.1 bn in H1’2019. The NPL coverage thus increased to 56.9%, from 52.7% in H1’2019, due to the faster growth in General Loan Loss Provisions, which outpaced the growth in Gross Non-Performing Loans (NPLs),
- Shareholders’ funds increased by 12.4% to Kshs 132.1 bn in H1’2020, from Kshs 117.5 bn in H1’2019, as retained earnings rose by 11.0% y/y to Kshs 105.2 bn, from Kshs 94.8 bn in H1’2019,
- KCB Group is currently sufficiently capitalized with a core capital to risk-weighted assets ratio of 17.9%, 7.4% points above the statutory requirement. In addition, the total capital to risk-weighted assets ratio was 19.5%, exceeding the statutory requirement by 5.0% points. Adjusting for IFRS 9, the core capital to risk-weighted assets stood at 18.3% while total capital to risk-weighted assets came in at 19.8%, and,
- The bank currently has a Return on Average Assets (ROaA) of 2.4%, and a Return on Average Equity (ROaE) of 16.0%.
Key Take-Outs:
- The group’s Profit after Tax (PAT) declined by 40.4% y/y to Kshs 7.6 bn from Kshs 12.7 bn in H1’2019 attributable to the 56.0% growth in Total Operating expenses to Kshs 32.2 bn from Kshs 20.6 bn. The growth in the Total Operating expenses was mainly attributable to the 263.8% growth in Loan Loss Provisions as the group provisioned for potential loan losses that may arise from the COVID-19 pandemic,
- The group’s asset quality remains under threat as seen in the increase of the group's Non- Performing Loans (NPL) ratio to 13.8% from 7.8% in H1’2019. The significant rise is attributable to KCB’s acquisition of National Banks’ non-performing loans portfolio of Kshs 28.7 bn. Additionally, given the effects emanating from the pandemic, the rise in non-performing loans was also driven by the poor performance from the MSMEs segment, Corporate Segment Mortgage segment and Check-off Loans recording NPL Ratios of 14.9%, 12.0%, 10.3% and 2.9%, respectively,
- Loan Loss Provisions increased by 263.8% to Kshs 11.0 bn from Kshs 3.0 bn. The increased provisioning levels were witnessed as the Group provided cover for downgraded facilities, with the expectation of an increase in defaults across sectors, brought about by the COVID-19 pandemic, and,
- The group has been able to leverage on digital and innovation as seen in the robust growth in the number of transactions performed outside the branch comprising of 79.0% on mobile, 16.0% on agency, Internet and POS and 3.0% on ATMs. This growth can also be attributed to the push to digital transactions and the transaction fee waivers seen during the COVID-19 period.
For a comprehensive analysis, please see our KCB Group H1’2020 Earnings Note
Co-operative Bank
Income Statement
- Core earnings per share (EPS) declined by 3.6% to Kshs 1.05 in H1’2020, from Kshs 1.09 in H1’2019, which was much better than our projections of Kshs 0.8. The decline in the EPS was driven by a 15.7% increase in total operating expenses to Kshs 14.6 bn in H1’2020 from Kshs 12.6 in H1’2019, outweighing the 5.3% increase in total operating income,
- Total operating income increased by 5.3% to Kshs 24.2 bn in H1’2020, from Kshs 23.0 bn in H1’2019. This was mainly due to an 11.6% increase in Net Interest Income (NII) to Kshs 15.9 bn from Kshs 14.3 bn in H1’2019, which was weighed down by the 5.1% decline in Non-Funded Income (NFI) to Kshs 8.3 bn from Kshs 8.8 bn in H1’2019,
- Interest income rose by 6.8% to Kshs 21.8 bn in H1’2020, from Kshs 20.4 bn in H1’2019. The growth recorded was as a result of a 12.1% increase in interest income from government securities to Kshs 6.2 bn, from Kshs 5.5 bn in H1’2019, as well as a 2.4% rise in interest income from loans and advances to Kshs 15.0 bn from Kshs 14.7 bn in H1’2019. The yield on interest-earning assets, however, declined to 11.5%, from 11.9% in H1’2019 due to the faster 11.6% growth in the average interest-earning assets that outpaced the 6.8% growth in interest income,
- Interest expense declined by 4.4% to Kshs 5.9 bn in H1’2020, from Kshs 6.2 bn in H1’2019, largely due to a 4.7% decline in interest expense from customer deposits to Kshs 5.1 bn from Kshs 5.4 bn in H1’2019. Other interest expenses also declined by 2.1% to Kshs 778.1 mn from Kshs 794.9 mn in H1’2019. Consequently, the cost of funds declined to 3.2%, from 3.7% in H1’2019, owing to a 19.9% rise in interest-bearing liabilities which outpaced the 4.4% decline in interest expenses,
- Non-Funded Income fell by 5.1% to Kshs 8.3 bn in H1’2020, from Kshs 8.8 bn in H1’2019. The decline was mainly driven by a 42.5% drop in fees and commissions on loans to Kshs 0.6 bn, from Kshs 1.1 bn in H1’2019, as well as a 67.5% decline in other income to 0.2 bn from 0.7 bn in H1’2019. The decline in NFI was however mitigated by a 37.2% increase in forex trading income to Kshs 1.3 bn, from Kshs 1.0 bn in H1’2019 as well as other fees and commissions which increased by 2.4% to Kshs 6.2 bn from Kshs 6.0 in H1’2019. As a consequence, the revenue mix shifted to 66:34, from 62:38 in H1’2019 owing to the faster growth in NII,
- Total operating expenses rose by 15.7% to Kshs 14.6 bn in H1’2020, from Kshs 12.6 bn in H1’2019, largely driven by the 57.9% rise in Loan Loss Provisions (LLP) to Kshs 1.9 bn from Kshs 1.2 bn in H1’2019, coupled with a 15.5% rise in staff costs to Kshs 6.6 bn in H1’2020 from Kshs 5.7 bn in H1’2019,
- The Cost to Income Ratio (CIR) deteriorated to 60.1%, from 54.8% in H1’2019, following the faster rise in total operating expenses that outpaced total operating income. Without LLP, the cost to income ratio also deteriorated to 52.4% from 49.6% in H1’2019, and indication of reduced efficiency levels,
- The bank registered a 3.6% decline in profit after tax to Kshs 7.2 bn in H1’2020 from Kshs 7.5 bn in H1’2019. Profit before tax and exceptional items declined by 8.0% to Kshs 9.6 bn from Kshs 10.4 bn in H1’2019, with the effective tax rate declining to 25.0% in H1’2020 from 28.4% seen in H1’2019.
Balance Sheet
- The balance sheet recorded an expansion as total assets grew by 19.6% to Kshs 513.9 bn in H1’2020 from Kshs 429.6 bn in H1’2019, mainly attributable to the 28.8% growth in government securities to Kshs 122.4 bn from Kshs 95.0 bn, coupled with a 5.7% growth in net loans and advances to Kshs 272.2 bn in H1’2020 from Kshs 257.6 bn in H1’2019. Placements also rose by 5.8% to Kshs 17.7 bn in H1’2020, from Kshs 16.8 bn,
- Total liabilities grew by 21.0% to Kshs 432.2 bn in H1’2020 from Kshs 357.2 bn in H1’2019 which was largely attributable to a 247.1% rise in placements from banking institutions to Kshs 5.2 bn in H1’2020, from Kshs 1.5 bn, coupled with the 18.9% rise in customer deposits to Kshs 384.6 bn in H1’2020 from Kshs 323.6 bn in H1’2019. Borrowings also recorded a 19.4% increase to Kshs 25.6 bn from Kshs 21.5 bn in H1’2019,
- The slower 5.7% growth in net loans and advances compared to the 18.9% growth in deposits, led to a decline in the loan to deposit ratio to 70.8%, from 79.6% in H1’2019. Deposits per branch remained unchanged at Kshs 2.1 bn as the number of branches remained unchanged at 159 branches,
- Gross Non-Performing Loans (NPLs) increased by 12.3% to Kshs 34.3 bn in H1’2020, from Kshs 30.6 bn in H1’2020. The NPL ratio deteriorated to 11.8% in H1’2020, from 11.2% in H1’2019 owing to slower growth in gross loans by 6.4% compared to the 12.3% growth in gross non-performing loans,
- General Loan Loss Provisions increased by 20.2% to Kshs 13.1 bn, from Kshs 10.9 bn in H1’2019. The NPL coverage ratio thus improved to 54.6% in H1’2020 from 51.4% in H1’2019, due to the faster growth in General Loan Loss Provisions which outpaced the growth in Gross Non-Performing Loans (NPLs),
- Shareholders’ funds increased by 12.8% to Kshs 80.1 bn in H1’2020 from Kshs 71.0 bn in H1’2019, mainly driven by a 13.0% increase in the retained earnings to Kshs 62.2 bn, from Kshs 70.3 bn in H1’2019,
- Co-operative Bank remains sufficiently capitalized with a core capital to risk-weighted assets ratio of 16.3%, 5.8% points above the statutory requirement of 10.5%. Also, the total capital to risk-weighted assets ratio came in at 16.8%, exceeding the statutory requirement of 14.5% by 2.3% points. Adjusting for IFRS 9, the core capital to risk-weighted assets stood at 15.9%, while total capital to risk-weighted assets came in at 16.4%, and,
- The bank currently has a Return on Average Assets (ROaA) of 3.0%, and a Return on Average Equity (ROaE) of 18.6%.
Key Take-Outs:
- Total operating expenses grew by 15.7% mainly due to the increase in loan loss provisions by 57.9%, coupled with the 15.5% increase in staff costs. Consequently, the cost to income ratio deteriorated to 60.1% from 54.8% seen in H1’2019. The increase in provisioning levels was expected considering the current situation surrounding the spread of COVID-19. The movement restrictions put in place to curb the virus led to subdued activity in the business environment and loss of jobs came about as a result of the same. Consequently, households and businesses haven’t been able to keep up with their debt obligations and that has resulted in an increase in Non-performing loans, and,
- The bank’s asset quality deteriorated, with the NPL ratio coming in at 11.8% in H1’2020, from 11.2% in H1’2019, H1’2019 owing to slower growth in gross loans by 6.4% compared to the 12.3% growth in gross non-performing loans. Generally, banks have had to go back to the drawing board to come up with new strategies to manage the worsening asset quality in the wake of the ongoing global pandemic.
Going forward, the factors that would drive the bank’s growth would be:
- Lending to SMEs: Putting into consideration the current state of affairs in the banking sector, it is evident that the risk factor when lending to businesses has increased significantly. It is, however, key to note that through loan restructurings and increasing their loan book exposure to MSMEs will help support the bank during this period of uncertainty, and,
- Focus on diversification: The bank’s continued focus on channel diversification will likely continue to help the bank in generating profitability, as they continue to record increased usage and traffic. The focus on branch transformation and innovation centred on alternative channels will continue to drive NFI growth as well as transform braches to handle advisory, wealth management and advisory services,
For a comprehensive analysis, please see our Co-operative Bank H1’2020 Earnings Note
Stanbic Holdings
Income Statement
- Core earnings per share declined by 31.2% to Kshs 6.5, from Kshs 9.4 in H1’2019, which was a larger decline compared to our projections of a decline to Kshs 7.5. The performance was mainly driven by a 60.5% rise in loan loss provisions which came in at Kshs 2.0 bn, from Kshs 1.2 bn recorded in H1’2019, in a move to cater for the increasing loan defaults,
- Total operating income declined by 12.0% to Kshs 10.7 bn in H1’2020, from Kshs 12.2 bn in H1’2019. This was driven by an 18.8% decline in Non-Funded Income (NFI) to Kshs 4.7 bn, from Kshs 5.8 bn in H1’2019, coupled with a 5.9% decline in Net Interest Income (NII) to Kshs 6.0 bn, from Kshs 6.4 bn in H1’2019,
- Interest income declined by 4.8% to Kshs 9.6 bn, from Kshs 10.1 bn recorded in H1’2019, driven by a 15.5% decline in interest income from government securities to Kshs 2.0 bn, from Kshs 2.3 bn in H1’2019, coupled with the 6.3% decline in interest income from loans and advances to Kshs 7.1 bn, from Kshs 7.6 bn in H1’2019. There was however a 240.2% increase in interest income from other deposits to Kshs 0.5 bn, from Kshs 0.1 bn in H1’2019. The yield on interest-earning assets declined to 4.5% from 4.9% in H1’2019, this is attributable to the 16.8% growth in interest-earning assets compared to the 4.8% decline in Interest Income,
- Interest expense declined by 3.1% to 3.6 bn, from 3.7 bn in H1’2019 mainly due to the 63.1% decline in interest expense from deposits and placements from other banking institutions to Kshs 0.3 bn, from Kshs 0.8 bn in H1’2019, which was distracted by a 12.9% increase in interest expense from deposits to Kshs 2.8 bn, from Kshs 2.5 bn in H1’2019. The Net Interest Margin (NIM) declined to 4.5% from 4.9% in H1’2019. This is attributable to the faster growth in average interest-earning assets by 13.8% compared to the 3.3% growth in the bank’s trailing net interest income,
- Non-Funded Income (NFI) declined by 18.8% to Kshs 4.7 bn, from Kshs 5.8 bn in H1’2019, mainly driven by a 36.7% decline in fees and commissions on loans to Kshs 0.1 bn, from Kshs 0.2 bn in H1’2019, coupled with a 33.1% decline in other fees and commissions to Kshs 1.7 bn, from Kshs 2.5 bn in H1’2019, and a 13.1% decline in other income to Kshs 0.3 bn, from Kshs 0.4 bn in H1’2019. The revenue mix for H1’2020 shifted to 56:44, from 51:49, mainly due to the decline in non-funded income,
- Total operating expenses increased marginally by 1.3% to Kshs 6.8 bn, largely driven by an 83.6% increase in Loan Loss Provisions (LLP) to Kshs 1.7 bn in H1’2020, from Kshs 0.9 bn in H1’2019, which outweighed the 11.7% decline in staff costs to Kshs 5.2 bn, from Kshs 5.8 bn, in H1’2019,
- The cost to income ratio improved to 45.7%, from 58.3% in H1’2019. Without LLP, the Cost to income ratio improved to 28.1% from 48.0% in H1’2019, highlighting the increase in the cost of risk to 17.6%, from 9.9% in H1’2019 as a result of the increase in loan loss provisions, and,
- Profit before tax declined by 20.7% to Kshs 4.1 bn, down from Kshs 5.2 bn in H1’2019. Profit after tax declined by 31.2% to Kshs 2.6 bn in H1’2020, from Kshs 3.7 bn in H1’2019, highlighting the decline in the effective tax rate to 16.1%, from 28.7% in H1’2019.
Balance Sheet
- The balance sheet recorded an expansion as total assets increased by 15.4% to Kshs 361.5 bn, from Kshs 313.3 bn in H1’2019. This growth was largely driven by a 32.8% increase in net loans and advances to Kshs 235.1 bn, from Kshs 177.1 bn in H1’2019, coupled with a 20.7% increase in derivative assets to Kshs 2.5 bn, from Kshs 2.0 bn in H1’2019. These increments we’re however weighed down by a 29.1% decline in property and equipment to Kshs 2.3 bn, from Kshs 3.3 bn in H1’2019 attributable to depreciation relating to Stanbic South Sudan based on restated amounts for the effects of hyperinflation, and, a 13.4% decline in investment securities to Kshs 81.5 bn in H1’2020, from Kshs 94.1 bn,
- Total liabilities rose by 17.1% to Kshs 312.2 bn, from Kshs 266.5 bn in H1’2019, driven by a 20.6% increase in total deposits to Kshs 287.0 bn, from Kshs 238.0 bn in H1’2019. On the other hand, borrowings declined by 41.3% to Kshs 5.4 bn, from Kshs 9.2 bn in H1’2019, which include payments to the parent company on syndicated borrowings,
- The faster growth in loans as compared to deposits led to an increase in the loan to deposit ratio to 81.9%, from 74.4% in H1’2018,
- Gross Non Performing Loans (NPLs) increased by 20.2% to Kshs 21.2 bn from Kshs 17.6 bn recorded in H1’2019. The Gross NPL ratio fell to 8.5%, from 9.4% in H1’2019, owing to a faster 32.4% growth in gross loans, compared to the 20.2% growth in gross non-performing loans. General provisions rose by 20.8% to Kshs 8.6 bn, from Kshs 7.1 bn in H1’2019. As a result, the NPL Coverage increased to 64.8% from 61.7% in H1’2019,
- Shareholders’ funds increased by 5.4% to Kshs 49.3 bn in H1’2020, from Kshs 46.8 bn in H1’2019, mainly driven by the 12.1% increase in retained earnings to Kshs 33.4 bn, from Kshs 29.8 bn in H1’2019,
- Stanbic Bank remains sufficiently capitalized with a core capital to risk-weighted assets ratio of 15.4%, 4.9% points above the statutory requirement of 10.5%. In addition, the total capital to risk-weighted assets ratio stood at 17.9%, exceeding the statutory requirement by 3.4% points. Adjusting for IFRS 9, the core capital to risk-weighted assets stood at 15.9%, while total capital to risk-weighted assets came in at 18.4%,
- Stanbic Holdings currently has a return on average assets of 1.4% and a return on average equity of 10.0%.
Key Take-Outs:
- The bank recorded relatively poor performance in both funded and NFI segments evidenced by the 12.0% decline in total operating income to Kshs 10.7 bn in H1’2020, from Kshs 12.2 bn in H1’2019. Non-funded income declined by 18.8% to Kshs 4.7 bn, from Kshs 5.8 bn in H1’2019, while net interest income declined by 5.9% to Kshs 6.0 bn, from Kshs 6.4 bn in H1’2019. This poor performance can be attributed to the current ongoing pandemic which led to the enforcement of movement restrictions which have adversely affected both businesses and households,
- The bank’s asset quality has deteriorated significantly with the gross non-performing loans (NPLs) increasing by 20.2% to Kshs 21.2 bn from Kshs 17.6 bn recorded in H1’2019. To curb this, the bank has had to increase its provisioning where general provisions rose by 20.8% to Kshs 8.6 bn, from Kshs 7.1 bn in H1’2019.
Going forward:
- The bank has put in place plans to promote digitization on the bank’s functions which we believe will improve efficiencies in the bank's activities in a cost-effective manner. They also intend to use the digital platforms to push their ecosystem and help increase adoption in their customer base,
For a comprehensive analysis, please see our Stanbic Holdings H1’2020 Earnings
The table below highlights the performance of the banks that have released so far, showing the performance using several metrics, and the key take-outs of the performance.
|
Bank |
Core EPS Growth |
Interest Income Growth |
Interest Expense Growth |
Net Interest Income Growth |
Net Interest Margin |
Non-Funded Income Growth |
NFI to Total Operating Income |
Growth in Total Fees & Commissions |
Deposit Growth |
Growth in Government Securities |
Loan to Deposit Ratio |
Loan Growth |
Return on Average Equity |
|
KCB |
(40.4%) |
23.2% |
25.7% |
22.3% |
7.6% |
6.0% |
31.0% |
4.3% |
34.6% |
54.5% |
73.8% |
17.0% |
16.0% |
|
Stanbic |
(31.2%) |
(4.8%) |
(3.1%) |
(0.7%) |
4.5% |
(18.8%) |
44.0% |
(36.7%) |
20.6% |
(13.4%) |
81.9% |
32.8% |
10.9% |
|
Co-op |
(3.6%) |
6.8% |
(4.4%) |
11.6% |
8.4% |
(5.1%) |
34.3% |
(42.5%) |
18.9% |
28.0% |
70.8% |
19.4% |
18.6% |
|
H1'20 Mkt Weighted Average* |
(26.7%) |
13.5% |
11.3% |
15.2% |
7.4% |
(1.5%) |
34.1% |
(17.5%) |
27.2% |
35.3% |
74.0% |
20.2% |
16.1% |
|
H1'19Mkt Weighted Average** |
9.0% |
3.7% |
5.3% |
3.8% |
7.7% |
16.5% |
37.2% |
12.7% |
8.6% |
12.1% |
73.8% |
9.8% |
19.3% |
|
*Market-cap-weighted as at 14/08/2020 |
|||||||||||||
|
**Market-cap-weighted as at 06/09/2019 |
|||||||||||||
Key takeaways from the table above include:
- Three banks have released their H1’2020 financial results, recording a (26.7%) average decline in core Earnings Per Share (EPS), compared to a growth of 9.0% in H1’2019 for the entire listed banking sector,
- The banks that have released results have recorded a deposit growth of 27.2%, faster than the 8.6% growth recorded in H1’2019. Interest expense grew faster by 11.3%, compared to 5.3% in Q1’2019, indicating that banks struggled to mobilize relatively cheaper deposits amid the ongoing pandemic as most customers prefer liquidity,
- Average loan growth came in at 20.2%, which was faster than the 9.8% recorded in H1’2019, with the growth in loans being accelerated following the repeal of interest rate cap in November 2019, coupled with increased demand in funding as businesses demand working capital to operate in the tough operating environment as a result of the pandemic. Government securities recorded a growth of 35.3% y/y, which was faster compared to the loans, and the 12.1% growth recorded in H1’2019. This highlights banks’ continued preference towards investing in government securities, which offer better risk-adjusted returns,
- Interest income rose by 13.5%, compared to a growth of 3.7% recorded in H1’2019. The faster growth in interest income may be attributable to the 20.2% growth in loans and increased allocation to government securities. Consequently, the Net Interest Margin (NIM) now stands at 7.4%, compared to the 7.7% recorded in H1’2019 for the whole listed banking sector, and,
- Non-Funded Income declined by 1.5% y/y, slower than 16.5% recorded in H1’2019. The performance in NFI was on the back of declined growth in fees and commission of 17.5%, which was slower than the 12.7% growth recorded in H1’2019. The poor performance of the growth in fees and commission can be attributed to the recent waiver on fees on mobile transactions below Kshs 1,000 and the free bank-mobile money transfer. Banks with a large customer base who rely heavily on mobile money transactions are likely to take the biggest hit.
Universe of Coverage:
|
Banks |
Price at 07/08/2020 |
Price at 14/08/2020 |
w/w change |
YTD Change |
Year Open |
Target Price* |
Dividend Yield |
Upside/ Downside** |
P/TBv Multiple |
Recommendation |
|
Diamond Trust Bank*** |
69.0 |
67.3 |
(2.5%) |
(38.3%) |
109.0 |
136.3 |
3.9% |
106.6% |
0.3x |
Buy |
|
KCB Group*** |
33.0 |
30.6 |
(7.3%) |
(43.4%) |
54.0 |
46.3 |
9.9% |
61.5% |
0.8x |
Buy |
|
I&M Holdings*** |
46.3 |
44.7 |
(3.5%) |
(17.3%) |
54.0 |
66.4 |
5.1% |
53.8% |
0.7x |
Buy |
|
Equity Group*** |
31.5 |
28.8 |
(8.7%) |
(46.3%) |
53.5 |
41.1 |
0.0% |
42.9% |
1.0x |
Buy |
|
NCBA*** |
23.2 |
22.8 |
(1.7%) |
(38.1%) |
36.9 |
32.1 |
1.0% |
41.6% |
0.6x |
Buy |
|
ABSA Bank*** |
8.6 |
9.1 |
5.1% |
(32.1%) |
13.4 |
11.7 |
12.0% |
41.1% |
1.2x |
Buy |
|
Co-op Bank*** |
10.3 |
10.9 |
5.3% |
(33.6%) |
16.4 |
14.3 |
8.4% |
40.1% |
0.8x |
Buy |
|
Standard Chartered*** |
151.8 |
151.0 |
(0.5%) |
(25.4%) |
202.5 |
177.5 |
7.8% |
25.4% |
1.2x |
Buy |
|
Stanbic Holdings |
74.5 |
73.5 |
(1.3%) |
(32.7%) |
109.3 |
84.9 |
9.0% |
24.5% |
0.7x |
Buy |
|
HF Group |
3.7 |
4.0 |
7.5% |
(38.1%) |
6.5 |
3.9 |
0.0% |
(1.4%) |
0.2x |
Sell |
|
*Target Price as per Cytonn Analyst estimates **Upside/ (Downside) is adjusted for Dividend Yield ***Banks in which Cytonn and/ or its affiliates are invested in |
||||||||||
We are “Neutral” on equities for investors because, despite the sustained price declines, which have seen the market P/E decline to below its historical average presenting investors with attractive valuations in the market, the economic outlook remains grim.
I. Industry Reports
During the week, the Kenya Bankers Association released the Housing Price Index Q2’2020 highlighting that house prices contracted by 0.2% in Q2’2020, a slower contraction compared to the 0.5% drop in Q1’2020. The slight decline in house prices is attributed to the economic slump which has affected both demand and supply in the residential market. Other key take-outs from the report include;
- Demand for apartments increased significantly accounting for 75.6% of the concluded sales during the quarter, compared to 33.0% of the concluded sales in Q1’2020, while bungalows and maisonettes jointly accounted for 24.4%. The increased demand for apartments is attributed to the affordability of the same among buyers as compared to bungalows and maisonettes,
- Mid-end residential markets within the Nairobi Metropolitan Area such as Thindigua, South C, Kikuyu and Imara Daima recorded the highest activities accounting for 75.0% of the sales during the quarter, while high-end markets such as Kileleshwa, Kilimani, Westlands, Karen, and Kitisuru accounted for approximately 7.8% of the sales, reinforcing buyers’ search for affordability.
Hass Consult also released the Q2’2020 House Price Index, and the key take-outs were;
- House prices dropped by 0.2% q/q but marginally increased by 2.9% y/y, attributable to reduced transactions as investors adopt a wait-and-see attitude in the wake of market uncertainty,
- Muthaiga recorded the highest increase in asking prices over the quarter at 3.6%, while Riverside recorded the lowest drop with apartment prices reducing by 2.6% q/q,
- Overall rents recorded a marginal drop of 0.3%, attributed to pressure on landlords to offer discounts in the wake of reduced disposable income among business owners and employees due to the impact of the pandemic. However, apartments recorded a 2.2% growth in rents q/q indicating sustained demand for rental housing amidst a tough financial environment,
- Among suburbs, apartments in Parklands register the highest rent price increased at 2.4% q/q and 7.1% y/, while Donholm recorded the biggest q/q drop in rents at 4.8% while on an annual basis rents in Kitisuru reduced by 7.7%. In the satellite towns, rents in Kiserian and Thika recorded gains of 6.7% and 10.0% q/q and y/y, respectively, while apartments in Mlolongo recorded the biggest drop of 2.6% q/q and 9.8 y/y.
Hass Consult also released Q2’2020 Land Price Index, and the key take-outs were;
- Land prices softened in both the suburbs and satellite towns declining by a marginal 0.7% q/q and 1.2% q/q respectively, reflecting that investors still view land as a resilient asset class over the long term,
- For suburbs, Donholm registered the highest increase in land prices at 2.8% q/q, while Parklands posted a 2.7% correction. On a y/y basis, Muthaiga registered the highest appreciation at 4.5% while Parklands recorded a 7.3% price correction. We attribute the price correction in Parklands to reduced demand for development land especially on the commercial front in addition to competition from neighbouring nodes such as Westlands,
- Ongata Rongai recorded the highest appreciation among satellite towns at 1.3%, while Limuru registered the highest drop at 3.9%. Key to note, despite the relatively high decline in Limuru prices q/q, it recorded a 3.4% appreciation y/y. Ruiru registered the highest appreciation y/y at 5.2%, while Thika recorded a 2.2% correction in land prices. We attribute the appreciation of land prices in satellite towns such as Ruiru to demand fuelled by affordability, improving infrastructure and the continued focus on driving the affordable housing initiative.
The indices are in tandem with Cytonn H1’2020 Market Review according to which, the performance of the residential sector softened with a marginal decline in rental yields by 0.1% points from 5.2% in Q1’2020 to 5.1% in H1’2020, on account of stagnation in unit prices in the wake of a tough economic environment. For the land sector, however, land prices recorded an overall annualized capital appreciation of 1.4%, attributed to a growing demand mainly in low rise residential areas and satellite towns fuelled by affordability and improving infrastructure. For investors focusing on the residential sector, Runda Mumwe and Ruiru continue to offer the best opportunity for detached units driven by returns, relatively higher uptake and presence of good infrastructure, while for apartments, the opportunity lies in Ruaka and Westlands which ranked highest in terms of average returns, unit uptake and infrastructure. In the land sector, the opportunity lies in sub-markets such as Karen, Spring Valley and Kasarani which recorded relatively high annualized capital appreciation of 5.6%, 5.4% and 5.7%, respectively, and satellite towns such as Ruaka for un-serviced land, and Ruiru for site and service schemes which were the best performing sub-markets with average annualized capital appreciation of 5.2%, and 5.8%, respectively.
II. Residential Sector
During the week, the Kenya Mortgage Refinancing Company (KMRC) announced that it would begin lending in September 2020, following approval to operate by the Central Bank of Kenya. The treasury backed lender, is set to lend money to local financial institutions at an annual interest rate of 5.0%, enabling them to write home loans at 7.0%, 6.0% points lower than the market rate of approximately 13.0%. The subsidized rate will be available to Kenyans earning Kshs 150,000 and below per month, while those earning more than that will continue to borrow house loans at market rates. According to online sources, KMRC has so far mobilized approximately Kshs 40 billion, including Kshs 2.2 billion in equity capital, Kshs 25 billion committed by the World Bank, Kshs 10 billion from African Development Bank, and plans to raise an extra Kshs 5 billion from the capital markets. The facility aims to grow the number of mortgage accounts to 60,000 by 2020.However, with the value of outstanding non-perfroming mortgages at Kshs 27.3 bn as at 2017, we are of the view that the Kshs 40 bn will be a one off and thus the 7.0% interest rate will not be sustainable once the initial capital is exhausted and the facility will need to move back to the market rate of approximately 13%. Uptake and access to mortgages in Kenya has remained relatively low mainly due to; i) low-income levels that cannot service a mortgage, ii) soaring property prices, iii) high-interest rates of up to 18% and high deposit requirements, iv) exclusion of employees in the informal sector due to insufficient credit risk information, v) lack of capital markets funding towards real estate purchases for end buyers, and (vi) lack of long term deposits for lenders to match house loans, thus limited writing of the same.
We expect that operationalization of KMRC will resolve some of the above challenges, thus improving Kenya’s mortgage penetration rate which stood at 3.2% of gross domestic product (GDP) as at 2017.
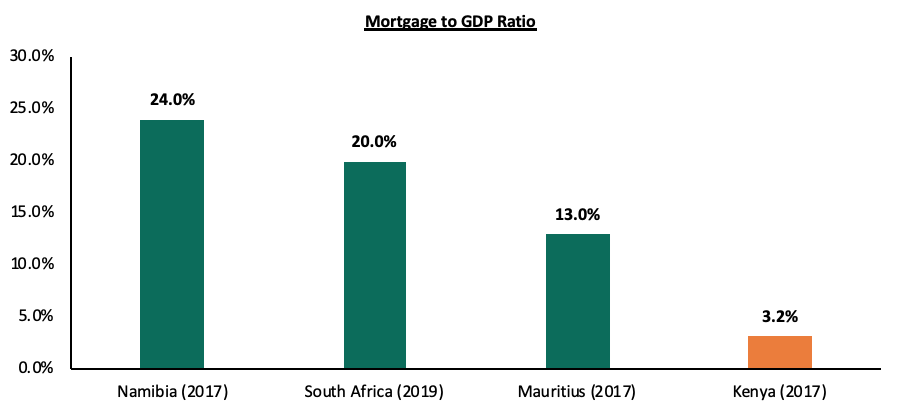
Source: Centre for Affordable Housing Finance in Africa
During the week, the National Cooperative Housing Union (NaCHU) suspended the implementation of its housing projects citing reduced contributions and repayments by its members due to the ongoing Covid-19 pandemic. To date, NaCHU has constructed 2,000 low-cost housing units for members of the affiliate housing SACCOs with four projects totalling 490 housing units now underway while a further 400 units were earmarked for ground-breaking. The ongoing pandemic has caused unprecedented disruption to the Kenyan economy over the past five months resulting in diminishing disposable income among the majority of Kenyans. This has affected households’ ability to cater for their housing needs with approximately 21.5% unable to pay their rent according to the KNBS Socio-Economic Impact of COVID-19 on Households Report, while the number of mortgage defaulters has continued to rise. On the supply end, the economic slowdown has also resulted in a financial strain for developers due to the reduced revenue inflows coupled with supply chains disruption and decline in project financing.
Nevertheless, the housing sector has continued to witness government intervention through the adoption of policy reforms aimed at cushioning the sector. Some of these include; the provision to utilize pension savings towards purchasing a residential house, allowing the use of advanced electronic signatures as a valid mode of execution of documents in Kenya thus easing land transactions as lands registries remain closed, and the proposed loans and mortgage moratorium preventing lenders from imposing penalties or credit reference bureau listing for borrowers unable to meet their monthly payment obligations. In addition, CBK has lowered the Central Bank Rate (CBR) to 7.0%, and the Cash Reserve Ratio (CRR) to 4.3%, to increase the available cash for on lending and setting aside loans for onward lending to various sectors.
In terms of performance, according to Cytonn’s Nairobi Metropolitan 2020 Residential Report, the sector has remained resilient evidenced by an improvement in the average annual returns to 5.0% compared to 4.7% last year on account of a vibrant rental market. However, price appreciation remained subdued averaging at (0.1%) compared to 0.3% in FY’19, and this is expected to continue as investors and homebuyers adopt a wait and see attitude in light of the current economic uncertainty. However, we expect the sector to stabilize once the economy recovers and housing demand resurfaces.
Other highlights during the week;
- The Ministry of Lands announced that land transactions in Nairobi city that include; searches, application for registration of documents, transfer of ownership or lease, caution and withdrawal of caution among others must be done online as per, The Land Registration (Electronic Land Transactions) Regulations 2019. The regulations, which had in May this year been published for public participation, will, for instance, require persons wishing to buy, transfer or lease land in Nairobi register in the online lands registrar by providing details such as their personal identification number (PIN) in the move to curb evasion of tax. In our view, the move to digitalize the land’s ministry is a stride in the right direction as we expect this to minimize human interference and save on time through eased processes. We expect this and the general digitalization of the lands ministry to boost the real estate sector through faster land transactions thus reducing delays experienced by developers during the pre-construction period. Please see Cytonn Weekly #20/2020 for more details of the regulations.
We expect the real estate sector to continue on an upward trajectory with activity driven by availability of relatively affordable house loans once the KMRC begins lending, reforms such as the digitalization of the lands ministry and buyer’s search for affordable housing options amidst a tough economic environment.
Retirement Planning is not something we can start later because later is when we retire. In Cytonn Weekly #08/2020, we discussed the importance of financial planning, the various considerations based on one’s own uniqueness, needs and preferences, and some of the investment avenues available. This week, we focus on: how to plan your finances in preparation for retirement given its inevitability, various types of pension schemes and where pension schemes invest.
To further explain retirement, we look at the topic in five sections as follows:
- Introduction: Pensions Industry in Kenya and Benefits of Saving in a Retirement Benefits Scheme,
- Types of Retirement Benefits Schemes,
- Pension Historical Performance (Segregated vs Guaranteed) and Asset Allocation,
- Impact of COVID-19 on Retirement Benefits Scheme,
- Access To Your Pension Savings, and,
- Conclusion – Factors To Consider Before Joining a Pension Scheme
Section 1: Introduction: Pensions Industry in Kenya and Benefits of Saving in a Retirement Benefits Scheme
In Kenya, The Retirement Benefits Authority (“RBA”) is the governing body established under the terms of the Retirement Benefits Act 1997 tasked with regulating and supervising the establishment, management and promotion of retirement benefits schemes. The Authority’s mandate also includes:
- Protecting the interest of members and sponsors of retirement benefits schemes
- Promoting the development of the retirement benefits sector
- Implementing all government policies relating to the sector
- Advising the CS National Treasury on the national policy to be followed with regard to the retirement benefits industry
The RBA’s mandate covers all private and government parastatal pension schemes. The civil service pension scheme and the Teachers Services Commission pension scheme is governed by the pensions department under the Ministry of National Treasury.
The pensions industry refers to the economic sector comprising of retirement benefits schemes, the assets these schemes control and relevant regulations affecting the schemes’ operations. The industry has witnessed significant growth with the number of registered members increasing from 0.7 mn and assets under management worth Kshs 0.42 tn shillings in 2010 to 3.0 mn members and assets worth Kshs 1.32 tn as of December 2019, according to the Kenya National Bureau of Statistics (KNBS) FinAccess Report 2019.
Despite the aforementioned growth in the industry, about 80% of the working population in Kenya are not members of any pension scheme. Below we look at the reasons why one should join a pension scheme:
- Income Replacement – Retirement savings ensure that your income stream does not stop even when you stop working. After retirement, many experience a decline in the amount and stability of income relative to their productive years. Retirement savings ensures that this decline is manageable or is non-existent and enables you to be able to live the lifestyle you desire even after retirement,
- Compounded and Tax-free interest – Savings in a pension scheme earns compounded interest which means that your money grows faster as even the interest earned is reinvested and grows. Additionally, retirement schemes are tax exempt meaning that the schemes have more to reinvest,
- Tax-exempt contributions – Pension contributions enjoy a monthly tax relief of up to Kshs 20,000 or 30% of your salary whichever is less – this lessens the total PAYE deducted from your earnings
- Avoid old age poverty – By providing an income in retirement, pension schemes ensure that the scheme members do not experience old age poverty where they have to rely on their family, relatives and friends for survival
- Home Ownership - Savings in a pension scheme can help you achieve your dream of owning a home. This can be done through a mortgage or a direct residential house purchase using your pension savings. A member may assign up to 60% of their pension benefits or the market value of the property, whichever is less, to provide a mortgage guarantee. The guarantee may enable the member to acquire immovable property on which a house has been erected, erect a house, add, or carry out repairs to a house, secure financing or waiver, as the case may be, for deposits, stamp duty, valuation fees and legal fees and any other transaction costs required. On the other hand, a pension scheme member may utilize up to 40% of their benefits to purchase a residential house directly subject to a maximum allowable amount of Kshs 7 Mn and the amount they use should not exceed the buying price of the house.
Section 2: Types of Retirement Benefits Schemes
A retirement benefits scheme, is a savings avenue that allows contributing individuals to make regular contributions during their productive years into the scheme and thereafter get income from the scheme upon retirement.
The retirement benefits system in Kenya has three pillars as follows:
- Zero Pillar – This pillar refers to the state-funded pension for citizens over the age of 65 and provides a basic income. This is managed by the Ministry in charge of social protection. Currently in Kenya through the Older Persons Cash Transfer program, the amount paid is Kshs 2,000 per household per month delivered every two months through appointed payment agent to poor and vulnerable persons over the age of 65 years. As the end of the financial year 2015/2016, the program covered 203,111 households,
- First Pillar – The first pillar is mandatory to all workers. The mandatory contribution is by both employer and employees and it targets workers in both the formal and informal sectors. This is where the National Social Security Fund (NSSF) comes in, and
- Second Pillar – This pillar is categorized by the voluntary nature of all schemes that fall under it. It includes both individual and employer-based pension schemes and is what we hall focus on in the analysis of the different pension schemes in the market below.
Other than the NSSF, the rest of the pension schemes in the country fall under the second pillar. It is important that before joining any pension scheme you learn how they operate so that you make a more informed decision. The schemes here can be categorized in four different ways depending on contributions, mode of payment at retirement, type of membership and mode of investment.
I. Based on contributions
Under this category, there are two types of pension schemes, namely, Defined Contributions Schemes and Defined Benefits Schemes. These can be differentiated as below:
|
Defined Contribution (DC) Scheme |
Defined Benefits (DB) Scheme |
|
|
CONTRIBUTIONS |
§ Member’ and employer’ contributions are fixed/defined either as a percentage of pensionable earnings or as a shilling amount § However, members have the freedom to contribute more than the defined rate (Additional Voluntary Contribution) |
§ Defined benefit plans are funded either exclusively by employer contributions or sometimes require employee contributions § An actuary estimates the cost of the promises being earned each year, to advice on the required amount that needs to be contributed each year to keep the scheme healthy. |
|
BENEFITS |
§ Member’s retirement benefits have a value equal to those contributions, net of expenses (e.g. insurance premiums) accumulated in an individual account with investment return and any surpluses or deficits as determined by the trustees of the scheme |
§ The benefits, which is ordinarily determined by the scheme rules, are defined in advance through a formula detailed in the Trust Deed § Benefits are often related to the final salary and/or years of service of the employee § The employer is then responsible for making sure that there are enough funds to enable them to fulfil this promise |
|
§ Uncertainty of benefits - difficult for a member to know in advance how much pension they will be able to secure at retirement |
§ The certainty of benefits (easy to measure benefits in terms of adequacy and better for retirement planning) |
|
|
RISK |
§ Risk of investment performance |
§ Risk of solvency of employer |
Changes in demographics, volatile interest rates, lower expected returns and the greater mobility in today’s workforce which has in some way made DC schemes more attractive to employers and employees.
II. Mode of payment at retirement
Ultimately, the aim of a retirement benefits scheme is to provide an income in retirement; however, upon retiring, not all schemes are the same. On one hand, we have pension schemes that are schemes where at retirement, a member of a pension scheme may access up to a third of their contributions and contributions made on their behalf plus accrued interest as a lump sum. The remainder is used to purchase an annuity (pension) that pays a periodic income to the pensioner in their retirement years, usually, monthly.
On the other hand, there are provident funds. At retirement, a member of a provident fund receives their contribution and contributions made on their behalf plus accrued interest as a lump sum.
It is key to also note the existence of Income drawdown funds which provide individuals and members of retirement benefits schemes with an option to access their benefits as a regular income through an investment fund upon retirement rather than taking up an annuity or a lump sum. In an income drawdown a retiree or any scheme member over the age of 50 years, may transfer their benefits from their current scheme to the income drawdown fund. The benefits are locked in the fund for a minimum period of 10 years while giving the member the ability to withdraw up to a maximum of 15% per annum of their fund balance every year. The remaining balance in the fund is invested and grows in the period of the 10 years.
III. Type of membership
Under this categorization, we have three main types of pension schemes as follows:
Occupational Retirement Benefits Schemes – These are schemes that are set up by an employer where only members of staff of the organization are eligible to join
Umbrella Retirement Benefits Schemes - These are schemes that pool the retirement contributions of multiple employers on behalf of their employees thereby reducing the average cost per member and enhancing the overall returns of both the employer and the employees’ contributions
Individual/Personal Retirement Benefits Schemes - These are schemes where individuals contribute directly into the scheme towards saving for their retirement. The contributions may be flexible to accommodate an individual’s financial circumstances.
IV. Mode of investment and governance
Under categorization by mode of investment, pension schemes may be said to either segregated or guaranteed. Below we explain the difference between the two:
Segregated Funds: In these schemes, members’ contributions are invested directly by the Trustees via an appointed Fund Manager. The Trustees establish an appropriate Investment Policy which is then implemented by the Fund Manager. The scheme directly holds the investments and the returns are fully accrued to the scheme for the benefit of members
Guaranteed Funds: This is a scheme offered by insurance companies where the members’ contributions are pooled together. The insurance company guarantees a minimum rate of return that should not exceed 4% p.a. by law and should the actual return surpass the minimum guaranteed rate, the insurance company tops up the minimum rate with a bonus rate of return
Section 3: Pension Historical Performance (Segregated vs Guaranteed) and Asset Allocation
Historical Asset Allocation
Every Retirement Benefits Scheme must formulate an Investments Policy Statement (IPS) which guides how investments are to be done. The IPS outlines the process for a retirement benefits schemes’ investment-related decision making as well as the investment limits per each asset class and even the securities that the fund can invest in. The IPS should however not conflict with the limits dictated by the RBA Investment Guidelines (Table G). The table contains the maximum allowable limits for investments in the named asset classes and these limits are contained in the last column in the table below. The IPS of the various schemes vary as the characteristics of members differ. For example, a pension scheme with relatively many members nearing the retirement age will not invest too much in long-term and illiquid asset classes such as Immovable Property, and the scheme’s IPS will reflect this.
The chart below indicates how the industry assets have been invested over time:
|
Kenyan Pension Funds Asset Allocation |
|||||||||
|
|
2013 |
2014 |
2015 |
2016 |
2017 |
2018 |
2019 |
Average |
Allowable Limit |
|
Government Securities |
33.8% |
31.0% |
29.8% |
38.3% |
36.5% |
39.4% |
42.5% |
35.9% |
90.0% |
|
Quoted Equities |
25.5% |
26.0% |
23.0% |
17.4% |
19.5% |
17.3% |
17.7% |
20.9% |
70.0% |
|
Immovable Property |
17.2% |
17.0% |
18.5% |
19.5% |
21.0% |
19.7% |
18.0% |
18.7% |
30.0% |
|
Guaranteed Funds |
10.3% |
11.0% |
12.2% |
14.2% |
13.2% |
14.4% |
15.2% |
12.9% |
100.0% |
|
Listed Corporate Bonds |
4.4% |
6.0% |
5.9% |
5.1% |
3.9% |
3.5% |
1.5% |
4.3% |
20.0% |
|
Fixed Deposits |
4.9% |
5.0% |
6.8% |
2.7% |
3.0% |
3.1% |
3.0% |
4.1% |
30.0% |
|
Offshore |
2.2% |
2.0% |
0.9% |
0.8% |
1.2% |
1.1% |
0.5% |
1.2% |
15.0% |
|
Cash |
1.3% |
1.0% |
1.4% |
1.4% |
1.2% |
1.1% |
1.1% |
1.2% |
5.0% |
|
Unquoted Equities |
0.6% |
1.0% |
0.4% |
0.4% |
0.4% |
0.3% |
0.4% |
0.5% |
5.0% |
|
Private Equity |
0.0% |
0.0% |
0.0% |
0.0% |
0.0% |
0.1% |
0.1% |
0.0% |
10.0% |
|
REITs |
0.0% |
0.0% |
0.0% |
0.1% |
0.1% |
0.1% |
0.0% |
0.0% |
30.0% |
|
Commercial Paper, non-listed bonds by private companies* |
- |
- |
- |
- |
0.0% |
0.0% |
0.0% |
0.0% |
10.0% |
|
Others e.g. Unlisted Commercial Papers |
0.0% |
0.0% |
0.0% |
0.0% |
0.0% |
0.0% |
0.0% |
0.0% |
10.0% |
|
Total Assets |
100% |
100% |
100% |
100% |
100% |
100% |
100% |
|
|
It is good to note that the bulk of the investments are in Government securities, Equities and immovable properties in that order. The schemes are yet to take advantage of the new asset classes like Real Estate Investment Trusts (REITs) and Derivatives.
Historical Performances
Some of the different factors that determine the performance of pension schemes include:
- Asset allocation: This is the proportion of the assets that are invested in a certain asset class
- Security Selection: This is the ability to select the best performing security within a specific asset class
- Size of the Scheme
- Investment Horizon
- Risk appetite
In the graph below, we look at the performance of retirement Schemes over the last seven years, focusing on the performances of guaranteed and segregated funds:
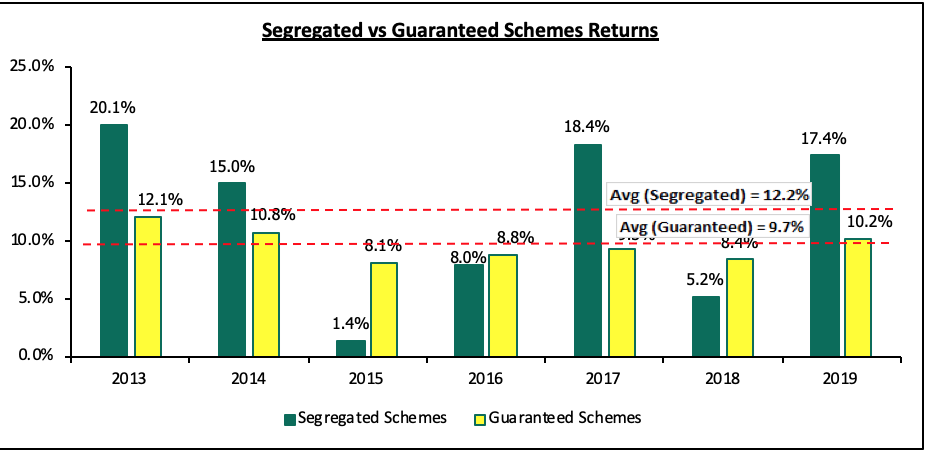 Sources: a. Segregated Schemes Performances – ACTSERV and Zamara Z-CASS Surveys
b. Guaranteed Schemes – Cytonn Research with data collected from 18 Approved Issuers since 2001
From the above chart, it is evident that segregated funds have outperformed guaranteed funds – with the average performance of the Guaranteed Funds over the last 7 years has been 9.7% p.a. whereas Segregated Schemes have enjoyed a higher return of 12.2% p.a.
It is important to note that on average members and pension trustees should aim to gain returns that are above inflation at all times. Also, the aim for fund managers to perform better than the various benchmarks set out in the Investment Policy Statements.
Section 4: Impact of Covid-19 on Retirement Benefits Schemes
The currently ongoing pandemic, Covid-19, has had a significant impact on capital and financial markets performances. Pension schemes have also been affected as they invest their members’ savings in the same economic environment. Some of the key impacts that the pandemic has had on retirement schemes include:
- A decrease in the value of assets in retirement savings accounts from falling financial markets;
- An increase in liabilities for guaranteed and defined benefits schemes;
- A lower capability to contribute to retirement savings plans by individuals, and by both employers and employees;
- Operational disruptions as a result of working remotely;
- Low to negative returns which impacts the overall retirement income adequacy
The best advice to members is, however, to stick to your pension savings plan and keep contributing, as long as they are in a position to. If one does not have a pension plan then they will be better off starting one and making contributions as well.
Some pension scheme members may want to withdraw their pension because they are afraid their money is losing value. However, by doing this, the member helps in crystallizing the decline in value. To prevent this they should delay taking their pension if they can. It is key for members to have a long term view and to allow the income planning and generation course to runs its course as dips in the market are a common occurrence and the market will eventually recover.
Section 5: Access to Your Pension Savings
Withdrawing from a pension scheme is highly discouraged as it foils the retirement plan one has and may end up reducing their income replacement ratio at retirement. It is good to note that the target is that one should have an income replacement ratio of about 75% if they are to lead the same quality of life they had before retirement. However, it remains an allowable provision, should the need arise and the members have no alternative source of fund. There are two ways one can access their pension benefits:
- Early Leaving
For a member that opt to leave a scheme early before attaining the retirement age, they have the following options:
- Transfer - to transfer their savings to another registered retirement benefits scheme.
- Deferral – to leave their savings in the scheme as a Deferred Member’s Account which the member may access on or after the age of fifty.
- Withdrawal - A member may withdraw from the scheme in lump sum an amount not exceeding their portion of savings plus 50% of the employer’s portion. The remaining 50% will be retained in the scheme until the member retires, opts to transfer the benefits to another registered retirement benefits scheme or emigrates to another country with no present intentions of returning to reside in Kenya.
- Emigration - a member who has emigrated from Kenya and has no intentions of returning to reside in Kenya can access all of their savings including the whole of the employer portion.
2. Retirement
The second way of accessing one’s pension savings is after you retire. The benefits may be accessed either as a lump sum, as a pension or transferred to an income drawdown fund as explained in Section 2.
Section 5: Conclusion - Factors To Consider Before Joining a Pension Scheme
Financial Planning for Retirement is a vital need for everyone and the earlier one starts the better. Starting early also means that you will be to take full advantage of the compounded growth of your savings and have a larger retirement pot when you retire.
There are several key factors that one should consider before joining a retirement benefits scheme or when re-evaluating their current scheme choice, these include:
- Returns – The return rate of your pension provider should be high enough to ensure a sizeable growth for pension savings and a member may choose where they get the highest return so that they ensure a higher income replacement ratio is attained. The rate should especially be higher than the inflation rate – this way your money is not losing value over time,
- Affordability and Flexibility – Choosing a retirement plan that you can make contributions without too much strain is key. You are likely to stick to a plan which you easily make contributions to. At the same time, the flexibility the plan offers in terms of changing the contribution amount and measures, if any, should you miss a contribution are key considerations,
- Understand the different options at hand – It is vital that before you join a scheme you understand how your money will be treated, the access options and how they will be paid out to you at retirement to ensure that your pension scheme features to match your goals. Different schemes may also have different provisions on the utilization of your savings to secure a mortgage facility or purchase a residential house, and,
- Choose a manager you trust – As mentioned previously, retirement planning is a long term affair and it is best that you have a pension provider that you can trust. Good governance structures and management experience are two of many aspects you can use to evaluate your pension plan provider.
- Additional Benefits: It is good to find out what are the other benefits that come with a retirement fund such as insurance covers and ensure you take advantage of the same.
People’s behavior toward retirement planning is intrinsically influenced by one’s attitude, knowledge, and information. By understanding the inevitability of retirement, the importance of retirement planning and what power of choice you have as an investor then you can be able to make a sound decision that ensures you enjoy the sunset years of your life.
Disclaimer: The views expressed in this publication are those of the writers where particulars are not warranted. This publication is meant for general information only and is not a warranty, representation, advice or solicitation of any nature. Readers are advised in all circumstances to seek the advice of a registered investment advisor.
- Talk to us
- Kenya
- P.O Box 20695 - 00200, Nairobi, Kenya
- Cell +254(0) 709 101 000
- Tel +254(0) 20 3929 000
- WhatsApp +254(0) 748 070 000
- United States
- +1 (240) 368-6217
- DOWNLOAD OUR APP
-


- Kenya
- Cysuites work spaces, Church Rd, Westlands, Nairobi, Kenya
- USA
- Suite 1150, 1775 Eye Street NW, USA, Washington DC 20006, USA
- Investments
- High Yield
- Private Equity
- Real Estate
- Real Estate
- RiverRun Estates
- Cytonn Towers
- The Ridge
- Taraji Heights
- The Alma