Unit Trust Funds Performance, Q2’2020, & Cytonn Weekly #46/2020
By Research Team, Nov 15, 2020
Executive Summary
Fixed Income
During the week, T-bills were oversubscribed, with the overall subscription rate coming in at 126.6%, up from 115.9% the previous week, mainly driven by the high liquidity in the money markets. The highest subscription rate was in the 91-day paper, which came in at 220.3%, up from 56.9% recorded the previous week. The subscription for the 364-day paper dropped to 135.4% from 210.0%, while that of the 182-day paper increased to 80.3% from 45.5% recorded the previous week. The yields on all the three papers, 91-day, 182-day and 364-day increased marginally by 1.0 bps, 4.0 bps and 5.0 bps to 6.7%, 7.1% and 8.0%, respectively;
Equities
During the week, the equities market was on an upward trajectory, with NASI, NSE 20 and NSE 25 recording gains of 1.9%, 1.1% and 2.5% respectively, taking their YTD performance to losses of 32.6%, 13.5% and 20.0%, for NSE 20, NASI and NSE 25 respectively. The equities market performance was driven by gains recorded by EABL, KCB Group, Equity Group and BAT, which gained by 5.5%, 5.3%, 5.1% and 4.3%, respectively. The gains were however weighed down by losses being recorded by Cooperative Bank and Standard Chartered Bank of 1.7% and 0.5%, respectively. During the week, KCB Group and Equity Group Holdings released their Q3’2020 financial results which showed a general decline in profitability;
Real Estate
During the week, the Kenya Bankers Association released the Housing Price Index, November 2020 report, highlighting that house prices contracted by 0.1% in Q3’2020, a marginal improvement from the 0.2% contraction in Q2’2020. Hass Consult also released the Q3’2020 House Price Index indicating that house prices increased by 0.3% over the quarter and 2.3% on an annual basis and the Q3’2020 Land Price Index which highlighted that land prices softened recording a 0.9% decline over the quarter in the Nairobi suburbs while satellite towns recorded a 0.1% drop. In the residential sector, Centum Real Estate launched a Kshs 2.0 bn housing project, dubbed Loft Residences in Gigiri. Acorn Group, a Kenya-based real estate developer, announced that it is set to build two hostels next to the University of Nairobi Chiromo Campus to host approximately 3,000 students. In the retail sector, Quickmart supermarket opened an outlet in Nanyuki Mall, Nanyuki town, as the anchor tenant taking up the space left behind by the struggling retailer, Tuskys. In the hospitality sector, Kenya was voted as Africa’s leading tourist destination in the World Travel Awards, supported by the epic savannah landscapes, wildlife, beaches, and lakes among other tourist attraction destinations;
Focus of the Week
Following the release of Unit Trust Fund Managers’ results for the first half of 2020, we examine the performance of Unit Trust Funds, with a key focus on Money Market Funds, which is the most popular Unit Trust Funds investment with a market share of 89.6% as at the end of Q2’2020, a rise from 88.0% in Q1’2020. During the period of review, Unit Trust’s Assets Under Management (AUM) grew by 15.1% to Kshs 88.1 bn, from Kshs 76.5 bn as at Q1’2020. Additionally, as at the end of Q2’2020, there were 23 approved collective investment schemes made up of 93 funds in Kenya. Out of the 23 however, only 19 were currently active while 4 were inactive;
- Weekly Rates:
- Cytonn Money Market Fund closed the week at a yield of 10.5%. To invest or withdraw, just dial *809#;
- Cytonn High Yield Fund closed the week at a yield of 13.3% p.a. To invest, email us at sales@cytonn.com and to withdraw the interest you just dial *809#
- For an exclusive tour of Cytonn’s real estate developments, visit: Sharp Investor's Tour and for more information, email us at sales@cytonn.com;
- We continue to offer Wealth Management Training daily, from 9:00 am to 11:00 am, through our Cytonn Foundation. The training aims to grow financial literacy among the general public. To register for any of our Wealth Management Training, click here;
- For Pension Scheme Trustees and members, we shall be having different industry players talk about matters affecting Pension Schemes and the pensions industry at large. Join us every Wednesday from 9:00 am to 11:00 am for in-depth discussions on matters pension;
- If interested in our Private Wealth Management Training for your employees or investment group, please get in touch with us through wmt@cytonn.com;
- For recent news about the company, see our news section here.
Money Markets, T-Bills & T-Bonds Primary Auction:
During the week, T-bills were oversubscribed, with the overall subscription rate coming in at 126.6%, up from 115.9% the previous week, mainly driven by the high liquidity in the money markets as evidenced by the 7.9% increase in interbank volumes to Kshs 8.2 bn during the week, from Kshs 7.6 bn recorded the previous week. The highest subscription rate was in the 91-day paper, which came in at 220.3%, up from 56.9% recorded the previous week. The subscription rate for the 364-day paper dropped to 135.4% from 210.0%, while that of the 182-day paper increased to 80.3% from 45.5% recorded the previous week. The yields on all the three papers, 91-day, 182-day and 364-day increased marginally by 1.0 bps, 4.0 bps and 5.0 bps to 6.7%, 7.1% and 8.0%, respectively. The acceptance rate declined to 97.7%, from 99.2% recorded the previous week, with the government accepting bids worth Kshs 29.7 bn out of the Kshs 30.4 bn worth of bids received.
Additionally, there was low demand for this month’s tap sale for the 25-year bond, FXD1/2018/25, with the overall subscription rate coming in at 39.8%. Investors seemed to prefer shorter dated papers as evidenced by the high subscription rate of this week’s treasury bills of 126.6%. The government accepted Kshs 7.9 bn out of the Kshs 8.0 bn worth of bids received, representing an acceptance rate of 99.3%, which can be attributed to the undersubscription. The allocated average rate for accepted bids was 13.5% while the coupon rate for the bond is 13.4%.
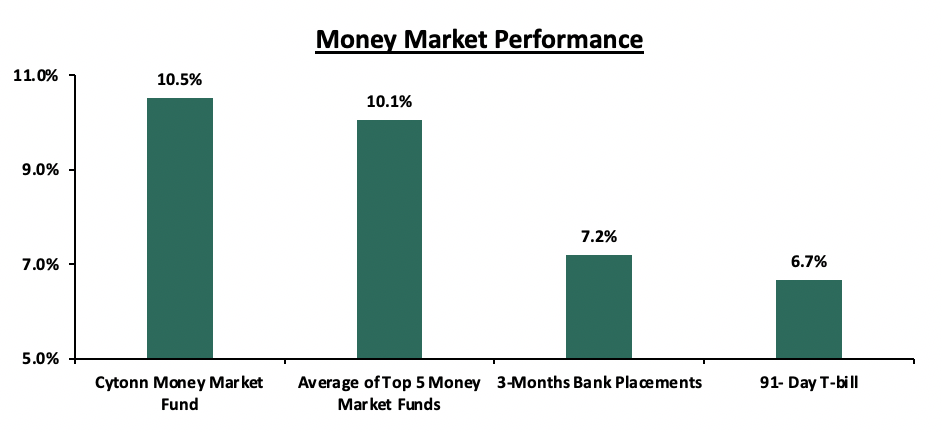
In the money markets, 3-month bank placements ended the week at 7.2% (based on what we have been offered by various banks), while the yield on the 91-day increased marginally by 0.01% points to close at 6.7%. The average yield of the Top 5 Money Market Funds increased by 0.1% points to 10.1% from 10.0% recorded the previous week. The yield on the Cytonn Money Market Fund remained unchanged at 10.5%, similar to what was recorded the previous week.
Liquidity:
Liquidity in the money markets increased during the week, with the average interbank rate declining by 0.5% points to 2.9%, from the 3.3% recorded the previous week. This was supported by government payments, which partly offset tax receipts. The average interbank volumes increased by 7.9% to Kshs 8.2 bn from Kshs 7.6 bn, as recorded the previous week. According to the Central Bank of Kenya’s weekly bulletin released on 13th November 2020, commercial banks’ excess reserves came in at Kshs 9.8 bn in relation to the 4.25% Cash Reserve Ratio.
Kenya Eurobonds:
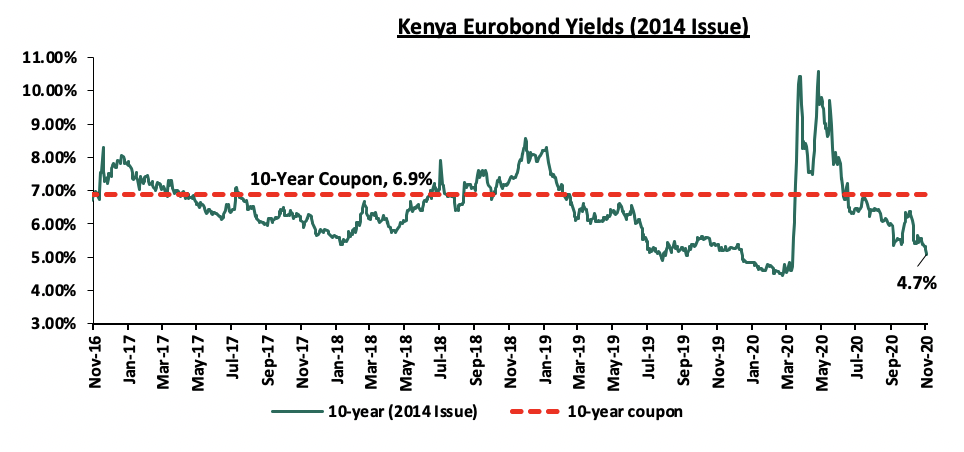
During the week, the yields on all Eurobonds remained unchanged with only the 7-year bond issued in 2019 increasing by 0.1% points. According to Reuters, the yield on the 10-year Eurobond issued in June 2014 remained unchanged closing the week at 4.7%, as was recorded the previous week.
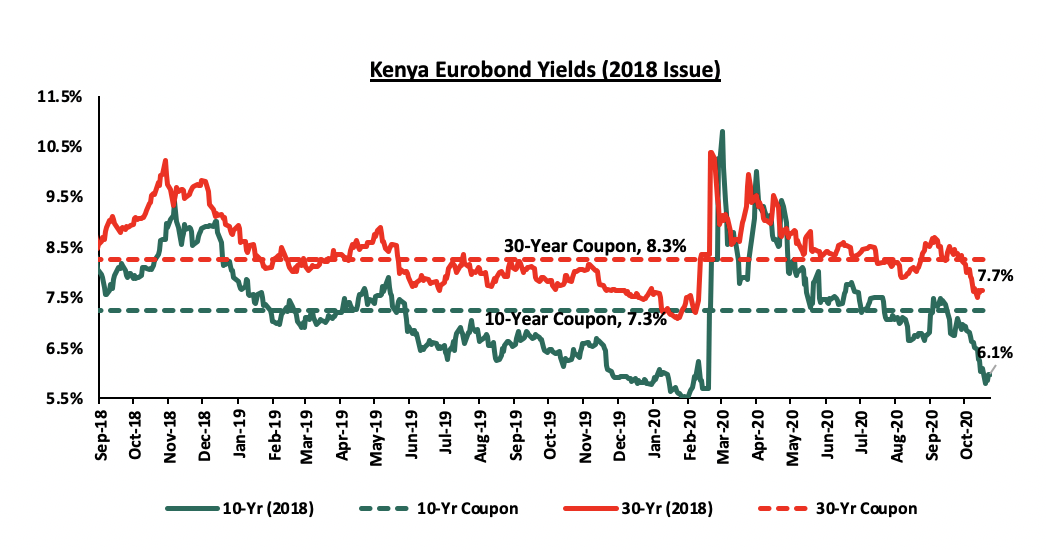
During the week, the yields on the 10-year and 30-year Eurobonds, issued in 2018, remained unchanged during the week closing at 6.1% and 7.7%, as was recorded the previous week.
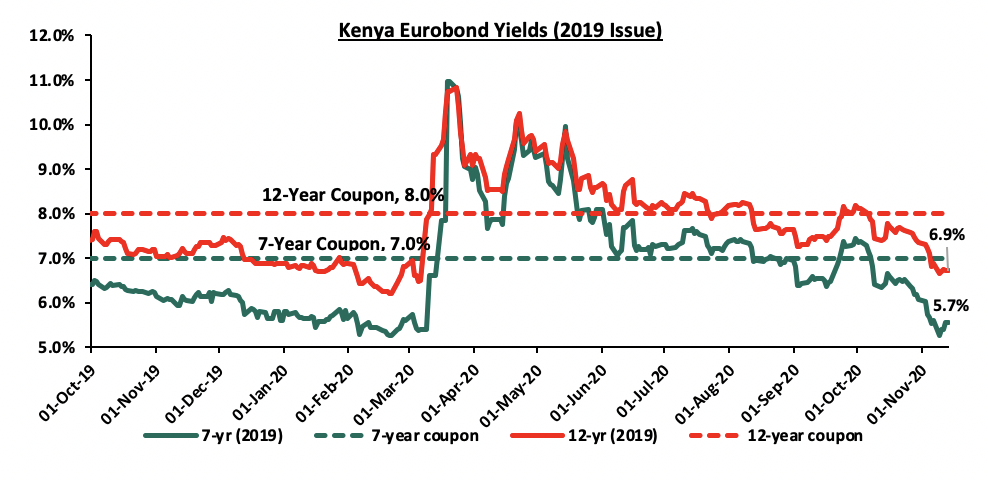
During the week, the yields on the 2019 dual-tranche Eurobonds remained relatively stable, with the 7-year Eurobond increasing marginally by 0.1% points to 5.7%, from 5.6% recorded last week, while the 12-year Eurobond remained unchanged closing at 6.9%, as was recorded the previous week.
Kenya Shilling:
During the week, the Kenyan shilling marginally depreciated against the US dollar by 0.2% to Kshs 109.1 from Kshs 108.9, mainly attributable to the persistent dollar importer demand. On an YTD basis, the shilling has depreciated by 7.7% against the dollar, in comparison to the 0.5% appreciation in 2019. Some of the challenges facing the currency include:
- Demand from merchandise and energy sector importers as they beef up their hard currency positions amid a slowdown in foreign dollar currency inflows, and,
- Continued uncertainty globally making people prefer holding dollars and other hard currencies.
However, in the short term, the shilling is expected to be supported by:
- The Forex reserves which are currently at USD 8.1 bn (equivalent to 4.9-months of import cover), which is above the statutory requirement of maintaining at least 4.0-months of import cover, and the EAC region’s convergence criteria of 4.5-months of import cover, and,
- The improving current account position which has seen a 39.9% decline during Q2’2020, coming in at Kshs 82.2 bn, from Kshs 136.9 bn in Q2’2019, equivalent to 7.0% of GDP from the 10.9% of GDP recorded in Q2’2019.
Rates in the fixed income market have remained relatively stable due to the high liquidity in the money markets, coupled with the discipline by the Central Bank as they reject expensive bids. The government is 76.8% ahead of its prorated borrowing target of Kshs 130.9 bn having borrowed Kshs 231.5 bn. In our view, due to the current subdued economic performance brought about by the effects of the COVID-19 pandemic, the government will record a shortfall in revenue collection with the target having been set at Kshs 1.9 tn for FY’2020/2021 thus leading to a larger budget deficit than the projected 7.5% of GDP, ultimately creating uncertainty in the interest rate environment as additional borrowing from the domestic market may be required to plug the deficit. Owing to this uncertain environment, our view is that investors should be biased towards short-term to medium-term fixed income securities to reduce duration risk.
During the week, the equities market was on an upward trajectory, with NASI, NSE 20 and NSE 25 recording gains of 1.9%, 1.1% and 2.5% respectively, taking their YTD performance to losses of 13.5%, 20.0% and 32.6%, for NASI, NSE 25 and NSE 20 respectively. The equities market performance was driven by gains recorded by EABL, KCB Group, Equity Group and BAT of 5.5%, 5.3%, 5.1% and 4.3%, respectively. The gains were however weighed down by losses being recorded by Cooperative Bank and Standard Chartered Bank of 1.7% and 0.5%, respectively.
Equities turnover declined by 33.9% during the week to USD 19.0 mn, from USD 28.8 mn recorded the previous week, taking the YTD turnover to USD 1.3 bn. Foreign investors remained net sellers during the week, with a net selling position of USD 0.1 mn, from a net selling position of USD 11.1 mn recorded the previous week, taking the YTD net selling position to USD 278.0 mn.
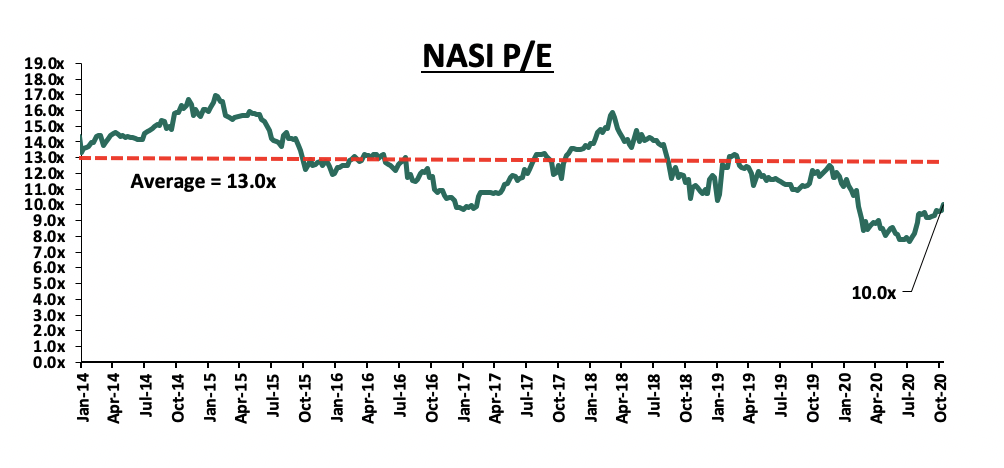
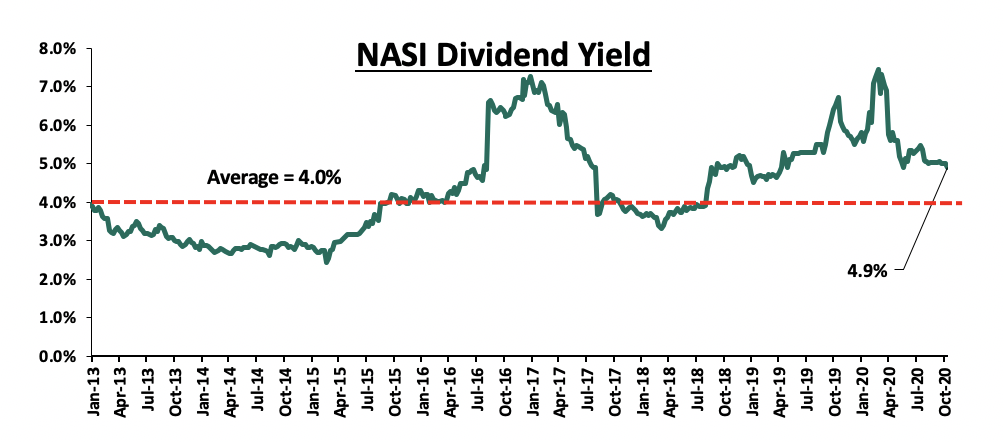
The market is currently trading at a price to earnings ratio (P/E) of 10.0x, 22.8% below the 11-year historical average of 13.0x. The average dividend yield is currently at 4.9%, 0.9% points above the historical average of 4.0%.
With the market trading at valuations below the historical average, we believe there are pockets of value in the market for investors with higher risk tolerance and are willing to wait out the pandemic. The current P/E valuation of 10.0x is 30.0% above the most recent valuation trough of 7.7x experienced in the first week of August 2020. The charts below indicate the historical P/E and dividend yields of the market.
Earnings Releases:
During the week, KCB Group and Equity Group Holdings released their Q3’2020 financial results. Below is a summary of their performance
- KCB Group
|
KCB Group Q3’2020 Key Highlights |
|||
|
Balance Sheet |
|||
|
Balance Sheet Items |
Q3’2019 (Kshs bn) |
Q3’2020 (Kshs bn) |
y/y change |
|
Government Securities |
128.5 |
236.2 |
83.9% |
|
Net Loans and Advances |
486.4 |
577.5 |
18.7% |
|
Total Assets |
764.3 |
972.0 |
27.2% |
|
Customer Deposits |
586.7 |
772.7 |
31.7% |
|
Deposits per Branch |
2.3 |
2.2 |
(5.6%) |
|
Total Liabilities |
643.1 |
836.1 |
30.0% |
|
Shareholders’ Funds |
121.2 |
135.9 |
12.1% |
|
Income Statement |
|||
|
Income Statement Items |
Q3’2019 (Kshs bn) |
Q3’2020 (Kshs bn) |
y/y change |
|
Net Interest Income |
38.7 |
47.9 |
23.7% |
|
Net non-Interest Income |
21.0 |
21.3 |
1.5% |
|
Total Operating income |
59.7 |
69.1 |
15.9% |
|
Loan Loss provision |
(5.8) |
(20.0) |
242.5% |
|
Total Operating expenses |
(32.5) |
(52.0) |
60.1% |
|
Profit before tax |
27.2 |
17.1 |
(36.9%) |
|
Profit after tax |
19.2 |
10.9 |
(43.2%) |
|
Core EPS |
6.0 |
3.4 |
(43.2%) |
|
Key Ratios |
|||
|
Ratios |
Q3’2019 |
Q3’2020 |
% point change |
|
Yield on Interest Earning Assets |
10.5% |
10.3% |
(0.2%) |
|
Cost of Funding |
2.9% |
2.6% |
(0.3%) |
|
Net Interest Margin |
7.8% |
7.8% |
0.0% |
|
Non-Performing Loans (NPL) Ratio |
8.3% |
15.3% |
7.0% |
|
NPL Coverage |
56.5% |
58.5% |
2.0% |
|
Cost to Income with LLP |
54.4% |
75.2% |
20.8% |
|
Loan to Deposit Ratio |
82.9% |
74.7% |
(8.2%) |
|
Cost to Income Without LLP |
44.7% |
46.3% |
1.6% |
|
Return on Average Assets |
3.5% |
1.9% |
(1.6%) |
|
Return on Average Equity |
22.2% |
13.1% |
(9.1%) |
Key take-outs from the earnings release include;
- Core earnings per share declined by 43.2% to Kshs 3.4, from Kshs 6.0 in Q3’2019, driven by a 60.1% growth in total operating expenses to Kshs 52.0 bn, from Kshs 32.5 bn in Q3’2019 which outweighed the 15.9% growth in total operating income to Kshs 69.1 bn, from Kshs 59.7 bn. The decline in core earnings per share was higher than our projected decline of 29.5% as the company had a much faster growth of 60.1% in the total operating expenses compared to our projection of 23.6% increase,
- Interest income grew by 23.0% to Kshs 63.3 bn, from Kshs 51.4 bn in Q3’2019. This was driven by a 65.7% rise in interest income on government securities to Kshs 16.8 bn, from Kshs 10.2 bn in Q3’2019, coupled with a 12.9% rise in interest income on loans and advances to Kshs 45.8 bn, from Kshs 40.5 bn in Q3’2019.
- Yields on interest-earning assets declined to 10.3% from 10.5% in Q3’2019 attributable to a faster 13.7% growth in average interest-earning assets, outpacing the 4.9% growth in trailing interest income,
- Interest expense rose by 20.8% to Kshs 15.4 bn, from Kshs 12.8 bn in Q3’2019, following a 23.6% rise in interest expense on customer deposits to Kshs 14.0 bn from Kshs 11.3 bn in Q3’2019. Interest expense on deposits and placement from banking institutions, declined by 1.1% to Kshs 1.4 bn, from Kshs 1.5 bn in Q3’2019. The cost of funds, on the other hand, declined to 2.6% from 2.9% in Q3’2019 owing to a faster 30.1% growth in average interest-bearing liabilities, which outpaced the 20.3% rise in the trailing interest expense,
- Net Interest Margin (NIM) remained unchanged at 7.8% from what was recorded in Q3’2019,
- Total operating expenses grew by 60.1% to Kshs 52.0 bn, from Kshs 32.5 bn, largely driven by a 242.5% spike in Loan Loss Provisions (LLP) to Kshs 20.0 bn in Q3’2020, from Kshs 5.8 bn in Q3’2019, coupled with a 12.2% rise in Staff costs to Kshs 15.2 bn in Q3’2020, from Kshs 13.6 bn in Q3’2019. The increased provisioning levels were witnessed as the Group covered for downgraded facilities, with the expectation of an increase in defaults across sectors, brought about by the COVID-19 pandemic,
- The balance sheet recorded an expansion as total assets grew by 27.2% to Kshs 972.0 bn, from Kshs 764.3 bn in Q3’2019. This growth was driven by an 83.9% rise in investment in government and other securities to Kshs 236.2 bn, from Kshs 128.5 bn in Q3’2019. The rise in the investments in government securities is mainly due to the bank's cautious stance with regards to lending. The loan book also recorded an 18.7% growth to Kshs 577.5 bn, from Kshs 486.6 bn in Q3’2019,
- Total liabilities rose by 30.0% to Kshs 836.1 bn, from Kshs 643.1 bn in Q3’2019, driven by a 31.7% increase in customer deposits to Kshs 772.7 bn, from Kshs 586.7 bn in Q3’2019, with customer deposits from NBK amounting to Kshs 102.6 bn in Q3’2020. Key to note, NBK was amalgamated into the group in Q4’2019 and as such, the groups Q3’2019 results were exclusive of NBKs customer deposits. Deposits per branch declined by 5.6% to Kshs 2.2 bn from Kshs 2.3 bn in Q3’2019, with the number of branches having increased to 360 as at Q3’2020, from 258 in Q3’2019, and,
- Gross Non-Performing Loans (NPLs) rose by 127.8% to Kshs 97.0 bn in Q3’2020, from Kshs 42.6 bn in Q3’2019. Consequently, the NPL ratio deteriorated to 15.3%, from 8.3% in Q3’2019, due to the faster growth in Gross Non-Performing Loans (NPLs), which outpaced the growth in loans.
For a comprehensive analysis, please see our KCB Group Q3’2020 Earnings Note
- Equity Group Holdings
|
Equity Group Q3’2020 Key Highlights |
|||
|
Balance Sheet |
|||
|
Balance Sheet Items |
Q3’2019 (Kshs bn) |
Q3’2020 (Kshs bn) |
y/y change |
|
Government Securities |
135.1 |
185.3 |
37.2% |
|
Net Loans and Advances |
348.9 |
453.9 |
30.1% |
|
Total Assets |
677.1 |
933.9 |
37.9% |
|
Customer Deposits |
478.1 |
691.0 |
44.5% |
|
Deposits per Branch |
1.6 |
2.3 |
43.8% |
|
Total Liabilities |
568.4 |
796.3 |
40.1% |
|
Shareholders’ Funds |
107.7 |
130.7 |
21.4% |
|
Income Statement |
|||
|
Income Statement Items |
Q3’2019 (Kshs bn) |
Q3’2020 (Kshs bn) |
y/y change |
|
Net Interest Income |
32.3 |
39.3 |
21.8% |
|
Net non-Interest Income |
22.5 |
24.8 |
10.1% |
|
Total Operating income |
54.8 |
64.1 |
17.0% |
|
Loan Loss provision |
(1.9) |
(14.8) |
686.1% |
|
Total Operating expenses |
(30.0) |
(45.3) |
50.7% |
|
Profit before tax |
24.8 |
19.8 |
(20.3%) |
|
Profit after tax |
17.5 |
15.0 |
(13.9%) |
|
Core EPS |
4.6 |
4.0 |
(13.9%) |
|
Key Ratios |
|||
|
Ratios |
Q3’2019 |
Q3’2020 |
% point change |
|
Yield on Interest Earning Assets |
10.9% |
10.1% |
(0.8%) |
|
Cost of Funding |
2.7% |
2.6% |
(0.1%) |
|
Net Interest Margin |
8.4% |
7.6% |
(0.8%) |
|
Non-Performing Loans (NPL) Ratio |
8.4% |
10.8% |
2.4% |
|
NPL Coverage |
45.8% |
52.0% |
6.2% |
|
Cost to Income with LLP |
54.8% |
70.6% |
15.8% |
|
Loan to Deposit Ratio |
73.0% |
65.7% |
(7.3%) |
|
Cost to Income Without LLP |
51.4% |
47.6% |
(3.8%) |
|
Return on Average Assets |
3.5% |
2.5% |
(1.0%) |
|
Return on Average Equity |
21.7% |
16.9% |
(4.8%) |
Key take-outs from the earnings release include;
- Core earnings per share declined by 13.9% to Kshs 4.0, from Kshs 4.6 in Q3’2019, better than our projections of a 41.7% decline to Kshs 2.7. The performance was driven by a 50.7% increase in total operating expenses, outpacing the 17.0% growth recorded in total operating income. The variance in core earnings per share growth against our expectations was due to the 17.0% growth in total operating income to Kshs 64.1 bn, from Kshs 54.8 bn in Q3’2019, against our expectation of a 27.3% decline to Kshs 39.8 bn,
- Interest income rose by 21.7% to Kshs 52.1 bn, from Kshs 42.8 bn in Q3’2019. This was driven by a 24.4% increase in interest income on loans and advances to Kshs 36.0 bn, from Kshs 29.0 bn in Q3’2019, coupled with a 21.9% increase in interest income on government securities to Kshs 15.4 bn, from Kshs 12.6 bn in Q3’2019,
- Yield on interest-earning assets declined to 10.1%, from 10.9% in Q3’2019, due to a faster 29.2% growth in average interest- earning assets, which outpaced the 19.9% growth in trailing interest income
- Interest expense rose by 21.6% to Kshs 12.8 bn from Kshs 10.5 bn in Q3’2019, following a 17.9% increase in interest expense on customer deposits to Kshs 9.6 bn, from Kshs 8.1 bn in Q3’2019, coupled with a 36.8% increase in other interest expenses to Kshs 2.6 bn from Kshs 1.9 bn in Q3’2019. Interest expenses on deposits and placements grew by 5.1% to Kshs 0.6 bn, from Kshs 0.5 bn in Q3’2019. Cost of funds declined marginally to 2.6%, from 2.7% recorded in Q3’2019, owing to the faster 30.2% growth in average interest-bearing liabilities to Kshs 653.0 bn, from Kshs 501.4 bn recorded in Q3’2019, outpacing the 21.6% increase in interest expense,
- Net Interest Margin (NIM) declined to 7.6% from 8.4% in Q3’2019, owing to the faster 29.2% growth in average interest earning assets which outpaced the 21.8% growth in Net Interest Income (NII),
- Total operating expenses rose by 50.7% to Kshs 45.3 bn, from Kshs 30.0 bn in Q3’2019, largely driven by a 686.1% increase in Loan Loss Provisions (LLP) to Kshs 14.8 bn, from Kshs 1.9 bn in Q3’2019, on the back of the subdued business environment, coupled with a 16.2% rise in staff costs to Kshs 10.8 bn, from Kshs 9.3 bn in Q3’2019,
- The balance sheet recorded an expansion as total assets increased by 37.9% to Kshs 933.9 bn, from Kshs 677.1 bn in Q3’2019. The growth was supported by a 37.2% increase in the government securities to Kshs 185.3 bn, from Kshs 135.1 bn, coupled with a 30.1% increase in loan book to Kshs 453.9 bn from Kshs 348.9 bn in Q3’2019,
- Total liabilities rose by 40.1% to Kshs 796.3 bn from Kshs 568.4 bn in Q3’2019, driven by a 44.5% increase in customer deposits to Kshs 691.0 bn, from Kshs 478.1 bn in Q3’2019. Key to note, the strong growth in customer deposits is mainly attributable to the acquisition of BCDC, with the subsidiary contributing Kshs 130.0 bn to the total deposits. Deposits per branch increased by 43.8% to Kshs 2.3 bn, from Kshs 1.6 bn in Q3’2019, with the number of branches increasing by 6 to 300 branches in Q3’2020, from 294 in Q3’2019. Borrowings recorded a growth of 19.0% to Kshs 68.5 bn, from Kshs 57.6 bn in Q3’2019, and,
- Gross Non-Performing Loans (NPLs) rose by 69.4% to Kshs 51.8 bn in Q3’2020, from Kshs 30.5 bn in Q3’2019. Consequently, the NPL ratio deteriorated to 10.8% in Q3’2020, from 8.4% in Q3’2019, attributable to a faster 69.4% growth in Non-Performing Loans, which outpaced the 32.5% growth in gross loans,
For a comprehensive analysis, please see our Equity Group Q3’2020 Earnings Note
The table below highlights the performance of the banks that have released so far, showing the performance using several metrics, and the key take-outs of the performance.
|
Bank |
Core EPS Growth |
Interest Income Growth |
Interest Expense Growth |
Net Interest Income Growth |
Net Interest Margin |
Non-Funded Income Growth |
NFI to Total Operating Income |
Growth in Total Fees & Commissions |
Deposit Growth |
Growth in Government Securities |
Loan to Deposit Ratio |
Loan Growth |
Return on Average Equity |
|
|
KCB |
(43.2%) |
23.0% |
20.8% |
23.7% |
7.8% |
1.5% |
30.8% |
(14.2%) |
31.7% |
83.9% |
74.7% |
18.7% |
13.1% |
|
|
Equity |
(13.9%) |
21.7% |
21.6% |
21.8% |
7.6% |
10.1% |
38.7% |
2.1% |
44.5% |
37.2% |
65.7% |
30.1% |
16.9% |
|
|
Q3'20 Mkt Weighted Average* |
(27.5%) |
22.3% |
21.2% |
22.7% |
7.7% |
6.1% |
35.0% |
(5.5%) |
38.6% |
58.9% |
69.9% |
24.8% |
15.1% |
|
|
Q3'19Mkt Weighted Average** |
8.7% |
4.5% |
4.3% |
4.9% |
7.7% |
15.8% |
37.9% |
22.6% |
11.0% |
3.3% |
75.7% |
11.6% |
19.3% |
|
|
*Market-cap-weighted as at 13/11/2020 |
||||||||||||||
|
**Market-cap-weighted as at 29/11/2019 |
||||||||||||||
Key takeaways from the table above include:
- Two banks have released their Q3’2020 financial results, recording a (27.5%) weighted average decline in core Earnings Per Share (EPS), compared to a weighted average growth of 8.7% in Q3’2019 for the entire listed banking sector,
- The banks that have released results have recorded a deposit growth of 38.6%, faster than the 11.0% growth recorded in Q3’2019. Interest expense, on the other hand, grew faster by 21.2%, compared to 4.3% in Q3’2019. Cost of funds, however, declined, coming in at a weighted average of 2.6% in Q3’2020, from 3.2% in Q3’2019, owing to the faster growth in average interest-bearing liabilities, an indication that the listed banks were able to mobilize cheaper deposits,
- Average loan growth came in at 24.8%, slightly slower than the 11.6% recorded in Q3’2019, and slower than the 58.9% growth in government securities, an indication of the banks preference of investing in Government securities as opposed to lending,
- Interest income rose by 22.3%, compared to a growth of 4.5% recorded in Q3’2019. The faster growth in interest income may be attributable to the increased allocation to government securities. Despite the rise in interest income, the Yield on Interest Earning Assets (YIEA) declined to 10.2% from the 10.5% recorded in Q3’2019, an indication of the increased allocation to lower-yielding government securities by the sector. The decline in the YIEA can also be attributed to the reduced lending rates for customers by the sector, in line with the Central Bank Rate cuts. Consequently, the Net Interest Margin (NIM) now stands at 7.7%, unchanged from what was recorded in Q3’2019 for the whole listed banking sector, and,
- Non-Funded Income grew by 6.1% y/y, slower than 15.8% growth recorded in Q3’2019. The performance in NFI was on the back of declined growth in fees and commission of 5.5%, which was slower than the 22.6% growth recorded in Q3’2019. The poor performance of the growth in fees and commission can be attributed to the waiver on fees on mobile transactions below Kshs 1,000 and the free bank-mobile money transfer. Banks with a large customer base who rely heavily on mobile money transactions are likely to take the biggest hit.
Universe of Coverage:
|
Company |
Price at 06/11/2020 |
Price at 13/11/2020 |
w/w change |
YTD Change |
Year Open |
Target Price* |
Dividend Yield |
Upside/ Downside** |
P/TBv Multiple |
Recommendation |
|
Diamond Trust Bank*** |
61.0 |
63.0 |
3.3% |
(42.2%) |
109.0 |
119.4 |
4.3% |
93.8% |
0.3x |
Buy |
|
Kenya Reinsurance |
2.0 |
2.2 |
7.4% |
(28.4%) |
3.0 |
4.0 |
5.1% |
89.4% |
0.2x |
Buy |
|
Sanlam |
12.8 |
12.0 |
(5.9%) |
(30.2%) |
17.2 |
18.4 |
0.0% |
53.3% |
1.2x |
Buy |
|
NCBA*** |
22.0 |
22.0 |
0.2% |
(40.3%) |
36.9 |
30.7 |
1.1% |
40.7% |
0.6x |
Buy |
|
I&M Holdings*** |
43.2 |
43.7 |
1.2% |
(19.1%) |
54.0 |
57.8 |
5.8% |
38.1% |
0.7x |
Buy |
|
Liberty Holdings |
7.5 |
7.2 |
(3.5%) |
(30.0%) |
10.4 |
9.8 |
0.0% |
35.4% |
0.6x |
Buy |
|
Standard Chartered*** |
157.0 |
156.3 |
(0.5%) |
(22.8%) |
202.5 |
197.2 |
8.0% |
34.2% |
1.2x |
Buy |
|
Co-op Bank*** |
11.6 |
11.4 |
(1.7%) |
(30.3%) |
16.4 |
14.2 |
8.8% |
33.3% |
0.8x |
Buy |
|
KCB Group*** |
35.6 |
37.5 |
5.3% |
(30.6%) |
54.0 |
46.4 |
9.3% |
33.1% |
0.8x |
Buy |
|
Equity Group*** |
35.0 |
36.8 |
5.1% |
(31.2%) |
53.5 |
44.5 |
5.4% |
26.4% |
0.9x |
Buy |
|
ABSA Bank*** |
9.5 |
9.9 |
4.2% |
(25.8%) |
13.4 |
10.8 |
11.1% |
20.2% |
1.2x |
Buy |
|
Jubilee Holdings |
269.0 |
270.0 |
0.4% |
(23.1%) |
351.0 |
313.8 |
3.3% |
19.5% |
0.5x |
Accumulate |
|
HF Group |
3.7 |
3.5 |
(6.5%) |
(46.6%) |
6.5 |
4.1 |
0.0% |
18.8% |
0.2x |
Accumulate |
|
Britam |
7.5 |
7.6 |
1.3% |
(15.6%) |
9.0 |
8.6 |
3.3% |
16.4% |
0.8x |
Accumulate |
|
Stanbic Holdings |
80.0 |
80.0 |
0.0% |
(26.8%) |
109.3 |
84.9 |
8.8% |
14.9% |
0.6x |
Accumulate |
|
CIC Group |
2.2 |
2.1 |
(5.5%) |
(23.1%) |
2.7 |
2.1 |
0.0% |
1.9% |
0.7x |
Lighten |
|
*Target Price as per Cytonn Analyst estimates **Upside/ (Downside) is adjusted for Dividend Yield ***For Disclosure, these are banks in which Cytonn and/ or its affiliates are invested in |
||||||||||
We are “Neutral” on equities for investors because, despite the sustained price declines, which have seen the market P/E decline to below its historical average presenting investors with attractive valuations in the market. The economic outlook remains grim.
- Industry Reports
During the week, the Kenya Bankers Association released the Housing Price Index, November 2020 Report, highlighting that house prices contracted by 0.1% in Q3’2020, a marginal improvement from the 0.2% contraction in Q2’2020. The declines in the house prices is attributed to the softening of the economy and the decline in consumption expenditure, which has affected both demand and supply in the residential market. Other key take-outs from the report include;
- Demand for apartments declined by 63.0%, while demand for bungalows and maisonettes expanded by 9.0%, and 72.0%, respectively, attributable to the relatively stronger demand at the top end of the market,
- Apartments accounted for approximately 43.0% sales, maisonettes and bungalows accounted for 21.0% and 33.0%, respectively, while townhouses accounted for 2.0% of the concluded sales in Q3’2020, and,
- Lower mid-end residential markets within the Nairobi Metropolitan Area such Athi River and Kasarani recorded the highest activities accounting for 52.6% of the sales during the quarter, with upper-mid-end areas such as Thindigua and South B at 31.6%, and high-end markets such as Kileleshwa and Kitisuru at 15.8% of the sales, reinforcing buyers’ search for affordability.
Hass Consult also released the Q3’2020 House Price Index, and the key take-outs were;
- House prices recorded sluggish growth increasing by 0.3% over the quarter and 2.3% on an annual basis, attributable to reduced transactions as investors adopt a wait and see approach in the midst of uncertainty and reduced disposable income,
- Muthaiga detached units recorded the highest quarterly price appreciation of 1.4% while apartment’s prices in Thika posted the highest increase at 1.8% q/q. On the other hand, Riverside apartments posted the highest quarterly and annual drop in price appreciation at 2.0% and 8.4% respectively, and,
- Overall, rental prices increased by 2.5% q/q and 4.9% y/y, with Ruiru recording the highest rental appreciation of 3.7% over the quarter. Apartments recorded an annual increase of 5.8% in the rental rates compared to detached and semi-detached units which recorded an annual increase of 5.1% and 3.5%, respectively. The relatively higher rental rates are attributed to the growing demand for rental housing amid reduced disposable income given the tough economic environment.
The above findings are in tandem with Cytonn’s Q3’2020 Markets Review Report, which highlighted that the market recorded subdued performance during the quarter due to the tough economic environment evidenced by the (0.1%) decline in prices during the quarter. In terms of annual uptake, detached units recorded an average of 16.9% compared to apartments at 18.9%, indicating the continued demand for apartments supported by affordability amid reduced disposable income. We expect total returns to investors to remain suppressed in the last quarter of 2020 as developers continue to offer discounts to homebuyers. The investment opportunity for apartments lies in the lower mid-end market in areas such as Thindigua and South C, which continued to post above-market returns and annual uptake. For detached units, opportunity lies in upper mid-end segment in submarkets such as Ridgeways and Runda Mumwe due to the attractive rental yields.
Hass Consult also released Q3’2020 Land Price Index, and the key take-outs were;
- Land prices within Nairobi suburbs softened recording a 0.9% decline over the quarter, and 2.2% on an annual basis while satellite towns recorded a marginal drop of 0.1% q/q, attributed to suppressed demand, and an overall increase of 0.5% y/y,
- Spring Valley registered the highest quarterly increase in land prices at 3.6%, and a 4.2% price appreciation y/y while Riverside posted the biggest quarterly drop of 3.8%, with an annual price correction of 8.1% within the Nairobi suburbs, and,
- Ongata Rongai recorded the highest appreciation among satellite towns at 4.7% q/q and 10.8% y/y, supported by the affordability of land and improving infrastructure. On the other hand, Kiambu recorded the highest quarterly and annual price correction of 5.2% and 8.0%, respectively, attributed to relatively high land prices compared to other satellite towns with the average price per acre at Kshs 39.7 mn.
The land price index is not in line with the Cytonn Q3’2020 Markets Review according to which the land within the Nairobi Metropolitan Area recorded an overall annualized capital appreciation of 2.4%, indicating that investors still consider land a good investment asset in the long term. According to the report, land in satellite towns recorded an annualized appreciation of 4.7% while land within Nairobi suburbs recorded an average of 0.9%. The investment opportunity lies in sub markets such as Kitisuru, Ridgeways and Kasarani, which recorded relatively high annualized capital appreciation of 4.6%, 4.2% and 4.8% respectively. For satellite towns, Athi River recorded the highest annualized capital appreciation of 9.6% for unserviced land whereas Thika recorded the highest appreciation for site and serviced land at 7.3%.
- Residential Sector
During the week, Centum Real Estate launched a Kshs 2.0 bn housing project, Loft Residences in Gigiri area. The project, which is set for completion in 2022, is expected to have 56 units on 7 blocks. The 280 SQM four bedroom duplex units are valued at Kshs 40.0 mn for the upper floor units and Kshs 42.5 mn for the lower floor units. The unit prices translate to an average of Kshs 147,321 per SQM, 11.1% higher than the upper mid-end residential market average value of Kshs 132,573 per SQM according to the Cytonn Q3’2020 Market Review. The launch of Loft Residences follows the successful completion and handing over of the developer’s two projects, Awali Estate at Vipingo Ridge in Kilifi County and Pearl Marina apartments in Entebbe in October 2020, and the recent launch of 365 Pavilion Place Apartments in Ruaraka and 265 Elmer One in Kasarani. In our view, the launch of the project is a sign of investor confidence in Gigiri area which is ideal for diplomats as the target clients working for the various international agencies such as the United Nations (UN). Gigiri as investment submarket is supported by; i) the area being categorized as a blue diplomatic zone, ii) close proximity to amenities such as Rosslyn Riviera Mall and Two Rivers Mall, iii) ease of accessibility as the area is served by the Limuru Road, and, iv) close proximity to diplomatic offices such as the United Nations headquarters.
The table below shows upper mid-end residential apartments performance in Q3’2020;
(All values in Kshs unless stated otherwise)
|
Upper Mid-End Residential Apartments Performance, Q3’2020 |
||||||||
|
Area |
Average Price Per SQM Q3'2020 |
Average Rent per SQM Q3'2020 |
Average Occupancy Q3'2020 |
Average Uptake Q3'2020 |
Average Annual Uptake Q3'2020 |
Average Rental Yield Q3'2020 |
Average Price Appreciation Q3'2020 |
Total Returns Q3'2020 |
|
Loresho |
112,601 |
541 |
90.0% |
89.0% |
11.4% |
5.4% |
0.8% |
6.1% |
|
Westlands |
172,924 |
775 |
88.2% |
88.1% |
23.3% |
5.8% |
(0.2%) |
5.6% |
|
Parklands |
116,456 |
613 |
91.1% |
81.5% |
15.3% |
5.2% |
0.2% |
5.4% |
|
Kileleshwa |
128,500 |
662 |
79.2% |
84.2% |
18.8% |
4.7% |
(0.5%) |
4.2% |
|
UpperHill |
130,030 |
741 |
71.6% |
77.3% |
18.2% |
4.0% |
0.0% |
4.0% |
|
Kilimani |
134,924 |
904 |
87.0% |
82.3% |
27.3% |
5.3% |
(2.3%) |
2.9% |
|
Average |
132,573 |
706 |
84.5% |
83.7% |
19.0% |
5.1% |
(0.3%) |
4.7% |
Source: Cytonn Research
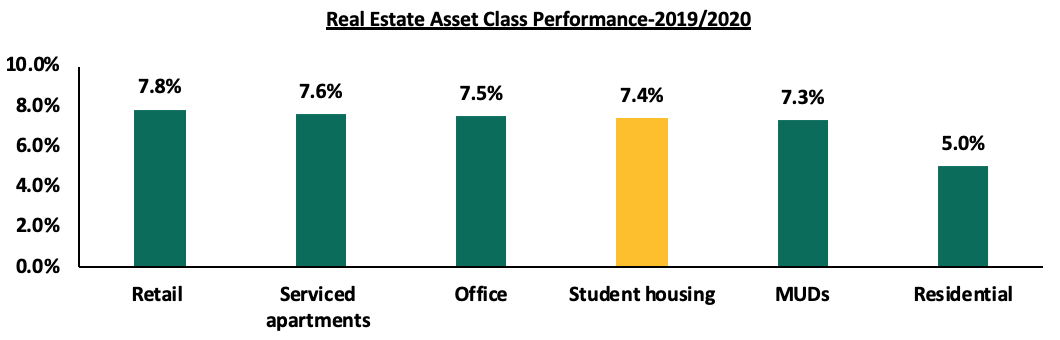
Acorn Group, a Kenya-based real estate developer, announced that it is set to build two hostels next to the University of Nairobi Chiromo Campus, along Science Crescent Road, off Riverside Road to host approximately 3,000 students. One of the projects will be under the Qejani brand and is expected to accommodate approximately 2,112 students. The development will consist of 704 units on 18-floors. The units will include; double and quadruple where students will be sharing study and common rooms. The second project will be under the Qwetu brand and it is expected to accommodate approximately 837 students. This project will consist of 574 units on 16 floors and the room typologies will include; single, twin and cluster units. The developer has continued to focus on student housing having developed other hostels under the Qwetu brand in Ruaraka, Parklands and Jogoo Road. The focus on the concept is supported by; i) student housing deficit which is driven by continued increase in student numbers, ii) expanding middle class leading to growth in disposable incomes thus driving student mobility as more people seek quality higher education, creating more markets for student housing, iii) hedge against economic headwinds as student enrolment increases every year despite the economic climates, and, iv) attractive returns- according to Cytonn’s topical Student Housing Market in Kenya, student housing posted relatively high rental yields averaging 7.4% and surpassing Mixed-use developments (MUDs) and residential sectors with 7.3% and 5.0%, respectively, as shown below:
Source: Cytonn Research
We expect the residential sector to record increased activities supported by the continued launch of projects and focus on student housing accommodation as the real estate sector continues to witness gradual recovery from the effects of COVID-19 pandemic.
- Retail Sector
During the week, Quickmart supermarket opened its latest outlet in Nanyuki Mall, Nanyuki town, as the anchor tenant taking up space left behind by the struggling retailer, Tuskys. This brings the total number of Quickmart’s outlets to 35, with 6 outlets opened in 2020. The move by the retailer to invest in the Nanyuki retail market is supported by; i) positive demographics with Nanyuki having a population of 72,813 as of 2019, 47.9% higher than 49,233 recorded in 2009, according to the Kenya National Bureau of Statistics (KNBS) Population and housing census report, ii) the attractiveness of the region as a tourist hub as Nanyuki hosts key tourist attractions such as the Ol Pejeta Conservancy and Mount Kenya National Park, and, iii) a growing middle class with increased consumer purchasing power.
In terms of performance, Nanyuki which falls under the Mt. Kenya Region, was the best performing region in the retail market according to the Cytonn’s Kenya Real Estate Retail Sector Report 2019 with average yields of 8.6%, 1.6% points higher than the market average of 7.0%. The performance is attributed to high occupancy rates at 80.0%, 2.7% points higher than the market average of 77.3% and high rental rates of Kshs 129.8 per SQFT, which is 10.0% higher than the market average rates of Kshs 118.0 SQFT. The region accounts for 7.7% retail market share and its performance was mainly driven by low supply of malls in the region. However, with the existing pandemic, the performance is expected to slightly go down as most retail chains scale down their operations to cushion themselves against the pandemic.
The table below shows a summary of 2019 retail performance in key urban cities in Kenya;
(All values in Kshs unless stated otherwise)
|
Summary of 2019 Retail Performance in Key Urban Cities in Kenya |
|||
|
Region |
Rent 2019 |
Occupancy Rate 2019 |
Rental Yield 2019 |
|
Mt. Kenya |
129.8 |
80.0% |
8.6% |
|
Nairobi |
168.6 |
75.1% |
8.0% |
|
Eldoret |
131.0 |
82.3% |
7.9% |
|
Mombasa |
122.8 |
73.3% |
7.3% |
|
Kisumu |
96.9 |
75.8% |
5.6% |
|
Nakuru |
59.2 |
77.5% |
4.5% |
|
Average |
118.0 |
77.3% |
7.0% |
Source: Cytonn Research
The table below shows the summary of the number of stores of the key local and international retail supermarket chains in Kenya;
|
Main Local and International Retail Supermarket Chains |
||||||
|
Name of Retailer |
Initial number of branches |
Number of branches opened in 2020 |
Closed branches |
Current number of Branches |
Branches expected to be opened |
Projected total number of branches |
|
Naivas Supermarket |
65 |
5 |
0 |
66 |
4 |
70 |
|
Tuskys |
64 |
2 |
14 |
50 |
0 |
50 |
|
QuickMart |
29 |
6 |
0 |
35 |
0 |
35 |
|
Chandarana Foodplus |
19 |
1 |
0 |
20 |
0 |
20 |
|
Carrefour |
7 |
1 |
0 |
8 |
3 |
11 |
|
Uchumi |
37 |
0 |
33 |
4 |
0 |
4 |
|
Game Stores |
2 |
1 |
0 |
3 |
0 |
3 |
|
Choppies |
15 |
0 |
13 |
2 |
0 |
2 |
|
Shoprite |
4 |
0 |
2 |
2 |
0 |
2 |
|
Nakumatt |
65 |
0 |
65 |
0 |
0 |
0 |
|
Total |
307 |
16 |
127 |
190 |
7 |
197 |
Source: Online research
Going forward, we expect the retail sector’s performance to be cushioned by; i) the continued expansion of both local and international retailers taking up space left behind by struggling brands, ii) improving infrastructure such as the expansion of Ngong Road, iii) positive demographics with Kenya’s current urbanization and population growth rates at 4.0% and 2.2% against a global average of 1.9% and 1.1%, respectively, according to the World Bank, iv) changing tastes and preferences of consumers, and, v) shifting consumer trends which have fuelled the entry of international retailers thus increasing demand for formal retail space. Nevertheless some of the challenges expected to face the sector include; i) exit by some retailers to cushion themselves against the impact of the COVID-19 pandemic, ii) growing focus on e-commerce thus reduced demand for physical space, iii) the existing oversupply of 2.8 mn SQFT of retail space in certain locations which is likely to result in pressure on landlords to provide concessions and other incentives to attract new clientele or retain existing tenants, and, iv) reduced consumer spending power attributed to the tough economic environment.
- Hospitality
During the week, Kenya was voted as Africa’s leading tourist destination in the World Travel Awards, supported by the epic savannah landscapes, wildlife, beaches and lakes among other tourist attraction centers. Additionally, Kenyatta International Conference Centre (KICC) was voted as Africa’s leading meeting and conference center. Fairmont Mount Kenya grabbed the title of Africa’s leading hotel, while the Aberdare Country Club was voted Africa’s leading Green Hotel. Additionally, Kenya Airways was ranked as Africa’s leading Airline-business classes and Africa’s leading Airline-economy class. The wide array of awards indicates continued confidence in Kenya’s hospitality industry despite the impact of COVID-19 pandemic. Currently, the sector is undergoing gradual recovery supported by; government strategies such as the Ministry of Tourism Post-Corona recovery funds aimed at offering financial aid to hotel and other establishments in the hospitality industry through the Tourism Finance Corporation (TFC), repackaging of the tourism sector products to appeal to domestic tourists, and, relaxation of travel advisories aiming at increasing the number of international tourist arrivals into the country. We expect the positive accolades to boost investor confidence in the sector coupled by; improved security, political stability, and improving infrastructure.
The real estate sector is expected to continue recording activities driven by the launch of residential projects, focus on student housing, expansion of local retail chains taking up prime spaces left behind by struggling retailers, and recovery of the hospitality sector as it leverages on positive accolades.
Unit Trust Funds, “UTFs”, are collective investment schemes that pool money together from many investors and are managed by professional Fund Managers, who invest the pooled funds in a portfolio of securities to achieve objectives of the trust. Following the release of Unit Trust Fund Managers’ results for Q2’2020, we examine the performance of Unit Trust Funds, as they are among the most popular investment options in the Kenyan market. We will further analyze the performance of Money Market Funds, a product under Unit Trust Funds, currently the most popular in terms of Assets Under Management, with 89.6% of the UTF market as at Q2’2020. In our previous focus on Unit Trust Funds, we looked at the Q1’2020 Performance by Unit Trust Fund Managers. In this topical, we focus on the Q2’2020 performance by Unit Trust Fund Managers, where we shall analyze the following:
- Performance of the Unit Trust Funds Industry,
- Performance of Money Market Funds,
- Comparing Unit Trust Funds AUM Growth with Bank Deposits Growth, and,
- Conclusion
Section I: Performance of the Unit Trust Funds Industry
As defined above, Unit Trust Funds are essentially investment schemes that pool money from investors and are managed by a professional Fund Manager. The fund manager invests the pooled funds in line with the portfolio’s objectives. The funds in the unit trust earn returns in the form of dividends, interest income, and/or capital gains depending on the asset class the funds are invested in. The main types of Unit Trust Funds include;
- Money Market Fund – This fund invests in short-term debt securities with high credit quality such as treasury bills and commercial paper. The fund offers high-income yield, liquidity as well as capital stability. Risk adverse investors are prone to invest in Money Market Funds in times of high stock market volatility;
- Equity Fund – This fund aims to offer superior returns over the medium to longer-term by maximizing capital gains and dividend income through investing in listed equity securities. To maintain liquidity, the fund reduces its high exposure in the equities market through diversifying its portfolio of shares in various sectors;
- Balanced Fund – These are funds in which the investments are diversified across the Equities and the fixed income market. The fund offers its investors with long-term growth as well as reasonable levels of income;
- Fixed Income Fund – This fund invests in interest-bearing securities, which include treasury bills, treasury bonds, preference shares, corporate bonds, loan stock, approved securities, notes and liquid assets consistent with the portfolio’s investment objective; and,
- Sector Funds – These are funds that invest primarily in a particular sector or industry. The funds provide a greater measure of diversification within a given sector than may be otherwise possible.
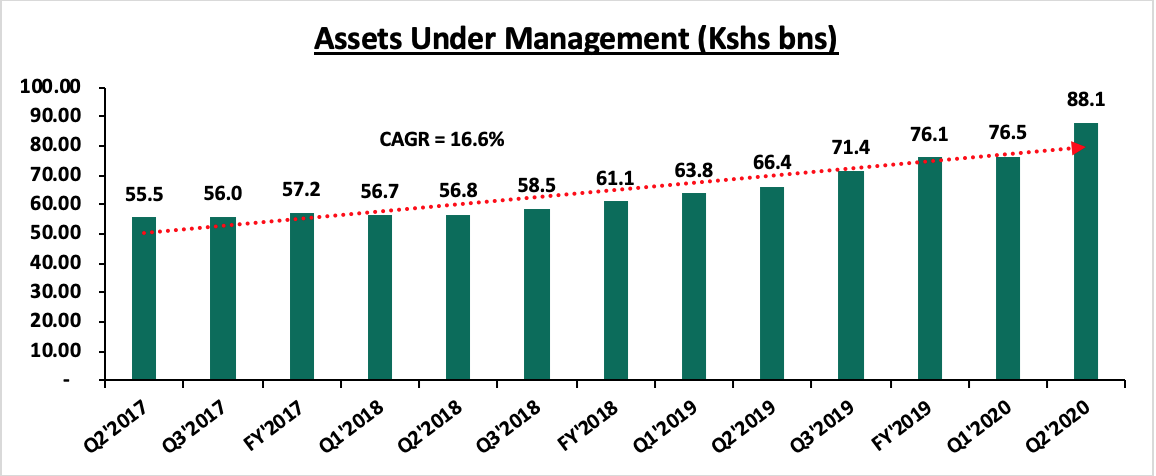
In line with Capital Market Regulations (2002) Part IV (32), Unit Trust Funds Managers released their Q2’2020 results. As per the Capital Markets Authority CMA Quarterly Statistical Bulletin - Q3 2020, the industry’s overall Assets Under Management (AUM) grew by 15.1% to Kshs 88.1 bn as at the end of Q2’2020, from Kshs 76.5 bn as at the end of Q1’2020. In the last three-years, Assets Under Management of the Unit Trust Funds have grown at a CAGR of 16.6% to Kshs 88.1 bn in Q2’2020 from Kshs 55.5 bn recorded in Q2’2017.
Source: CMA
This growth can be largely attributable to:
- Affordability to Retail Investors: Unit Trust Funds have become more accessible to retail investors, with a majority of the Collective Investment Schemes’ (CIS) in the market requiring an initial investment ranging between Kshs 100.0 - Kshs 10,000.0,
- Diversification: Unit Trust Funds are also advantageous in terms of offering investors the opportunity of diversifying their portfolios by providing them with access to a wider range of investment securities even with limited capital, which would have not been accessible if they invested on their own,
- Liquidity: Compared to other investment options such as equities, unit trusts are liquid, as it is easy to sell and buy units without depending on supply and demand at the time of investment or exit. Furthermore, the advent of digitization and automation within the industry has enhanced liquidity enabling an investor to receive their funds within 3 to 5 working days if they are withdrawing to their bank accounts, and immediate access to funds when withdrawing via M-Pesa, and,
- Emergence of Fintech: The financial services industry in the country is seeing its traditional model disrupted by technology and regulations; from March when the pandemic hit, many individuals and businesses have been forced to resort to technological avenues to curb the spread of the virus as they enforce social distancing. The reception of mobile money technology has increased financial inclusion, providing financial services to the ‘unbanked’, and as such, investing and divesting has been made easy for investors. Additionally, Fintech Inclusion has increased the efficiency of processing both payments and investments for fund managers.
According to the Capital Markets Authority, as at the end of Q2’2020 there were 23 approved collective investment schemes made up of 93 funds in Kenya. Out of the 23 however, only 19 were currently active while 4 were inactive. During the period under review, total Assets under Management grew by 15.1% to Kshs 88.1 bn in Q2’2020, from Kshs 76.5 bn as at Q1’2020. The table below outlines the performance of Fund Managers of Unit Trust Funds in terms of Assets under Management:
|
Assets Under Management (AUM) for the Approved and Active Collective Investment Schemes |
||||||
|
No. |
Fund Managers |
Q1’2020 AUM (Kshs mns) |
Q1’2020 Market Share |
Q2’2020 AUM (Kshs mns) |
Q2’2020 Market Share |
AUM Growth Q1’2020 – Q2’2020 |
|
1 |
CIC Asset Managers |
29,784.6 |
38.9% |
36,313.7 |
41.2% |
21.9% |
|
2 |
BRITAM |
10,004.4 |
13.1% |
10,444.7 |
11.9% |
4.4% |
|
3 |
ICEA Lion |
8,040.9 |
10.5% |
9,801.9 |
11.1% |
21.9% |
|
4 |
Commercial Bank of Africa |
7,724.8 |
10.1% |
9,263.0 |
10.5% |
19.9% |
|
5 |
Old Mutual |
6,133.1 |
8.0% |
6,129.0 |
7.0% |
(0.1%) |
|
6 |
Sanlam Investments |
3,320.2 |
4.3% |
4,328.5 |
4.9% |
30.4% |
|
7 |
African Alliance Kenya |
1,883.4 |
2.5% |
1,907.4 |
2.2% |
1.3% |
|
8 |
Stanlib Kenya |
1,419.5 |
1.9% |
- |
0.0% |
(100.0%) |
|
9 |
Dry Associates |
1,781.4 |
2.3% |
1,947.9 |
2.2% |
9.3% |
|
10 |
Madison Asset Managers |
1,372.0 |
1.8% |
1,481.0 |
1.7% |
7.9% |
|
11 |
Nabo Capital (Centum) |
1,106.4 |
1.4% |
1,284.4 |
1.5% |
16.1% |
|
12 |
Zimele Asset Managers |
1,102.3 |
1.4% |
1,206.2 |
1.4% |
9.4% |
|
13 |
Cytonn Asset Managers |
757.8 |
1.0% |
951.6 |
1.1% |
25.6% |
|
14 |
Amana Capital |
597.2 |
0.8% |
203.5 |
0.2% |
(65.9%) |
|
15 |
Apollo Asset Managers |
471.5 |
0.6% |
498.4 |
0.6% |
5.7% |
|
16 |
Genghis Capital |
458.9 |
0.6% |
655.4 |
0.7% |
42.8% |
|
17 |
Equity Investment Bank |
397.1 |
0.5% |
329.7 |
0.4% |
(17.0%) |
|
18 |
Alpha Africa Asset Managers |
143.4 |
0.19% |
192.4 |
0.22% |
34.2% |
|
19 |
Co-op Trust Investment Services Limited |
10.8 |
0.0% |
1,156.4 |
1.3% |
10,568.3% |
|
20 |
Wanafunzi Investments |
0.0 |
0.0% |
0.2 |
0.0% |
343.1% |
|
|
Total |
76,509.8 |
100.0% |
88,095.1 |
100.0% |
15.1% |
Source: Capital Markets Authority: Collective Investments Scheme Quarterly Report
Key to note from the above table:
- Assets Under Management: CIC Asset Managers remained the largest overall Unit Trust Fund Manager with an AUM of Kshs 36.3 bn in Q2’2020, from an AUM of Kshs 29.7 bn as at Q1’2020 translating to a 21.9% AUM growth,
- Market Share: CIC Asset Managers remained the largest overall Unit Trust with a market share of 41.2%, an increase from 38.9% in Q1’2020. Key to note, CIC Asset Managers recorded the highest increase in its markets share with the market share increasing by 2.3% points, and,
- Growth: In terms of AUM growth, Co-op Trust Investments recorded the strongest growth of 10,568.3%, with its market share increasing to 1.31% from 0.01% in Q1’2020. Key to note, the decline in Stanlib’s AUM is mainly due to the Asset Manager’s exit in Kenya, which was effective June 2020. The fund manager attributed the exit to the significant operating losses incurred in both Kenya and Uganda.
Among unit trust products, Money Market Funds continued to be the most popular product in terms of market share, accounting for Kshs 78.9 bn equivalent to 89.6% of all the funds under management by Collective Investment Schemes for the quarter ended 30th June 2020, an increase from 88.0% in Q1’2020 as shown in the table below;
|
Assets Under Management (AUM) by Type of Collective Investment Scheme (All values in Kshs mns unless stated otherwise) |
||||||
|
No. |
Product |
Q1’2020 AUM |
Q2’2020 AUM |
Q1’2020 Market Share |
Q2’2020 Market Share |
Variance (% Points) |
|
1 |
Money Market Funds |
67,358.0 |
78,936.2 |
88.0% |
89.6% |
1.6% |
|
2 |
Equity Fund |
3,631.6 |
3,630.3 |
4.7% |
4.1% |
(0.6%) |
|
3 |
Balanced Fund |
1,166.5 |
1,245.6 |
1.5% |
1.4% |
(0.1%) |
|
4 |
Others |
4,188.2 |
4283.0 |
5.7% |
4.9% |
(0.8%) |
|
|
Total |
76,344.3 |
88,095.1 |
100.0% |
100.0% |
|
Source: Capital Markets Authority: Collective Investments Scheme Quarterly Report
Key take-outs from the above table include:
- Money Market Funds recorded a 1.6% growth in the Assets under Management, and consequently, their market share rose to 89.6% from 88.0% recorded in Q1’2020, driven by local investors’ preference for capital preservation during the period of review defined by high volatility in the equities market. Risk averse investors invest in Money Market Funds in times of high stock market volatility. While Equity Funds have the potential to outperform and deliver better returns than Money Market Funds over the medium to long-term, preservation of capital in Money Market Funds is the main contributory factor for its popularity in Kenya,
- Equity Fund recorded a 0.6% points decline in its market share to 4.1% from 4.7% recorded in Q1’2020 partly attributable to increased capital flight by investors from the fund as they seek for safe havens as well as the downward trend recorded in the equities market since the onset of the COVID-19 pandemic, which saw the Nairobi all share Index (NASI) shed by 17.3% in H1’2020,
- Balanced Funds, on the other hand, ranked third in comparison to other products, with a market share of 1.4% in Q2’2020 from 1.5% recorded in Q1’2020. Given that Balance Funds invest in both the Equities and the fixed income market, the declines recorded in the Equities market has contributed to the slight decline its market share, however, the declines recorded in the Equities Market have been mitigated by the gains recorded in Fixed Income Securities. Balanced Funds offer investors a reasonable level of current income and long-term capital growth, achieved by investing in a diversified spread of equities and fixed income securities. Having a medium risk profile, Balanced Funds carry a high potential for growth in the near future as they are suitable for pension schemes, treasury portfolios of institutional clients, co-operatives, and high-net-worth individuals amongst others, and,
- The Other Funds include Income Funds, Growth Funds, Wealth Funds, Diversified Funds, and Bond Funds.
Section II: Performance of Money Market Funds
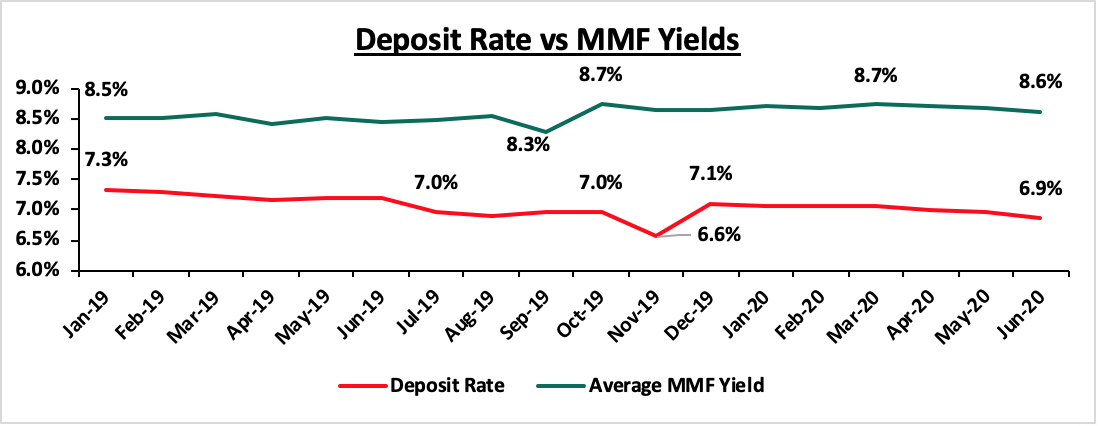
Money Market Funds (MMFs) in the recent past have gained popularity in Kenya with their AUM growth outperforming the growth in bank deposits. One of the main reasons is the higher returns from money market funds compared to the returns on bank deposits. According to the Central Bank of Kenya data, the average deposit rate during the quarter declined to 6.9%, post the removal of the deposit rate cap floor in August 2018, from an average of 7.8% when the legislation was in place.
Source: CBK
As per the regulation, funds in MMFS’ are invested in liquid interest-bearing securities that have a weighted average maturity of less than 12-months. These securities include bank deposits, securities listed on NSE, and securities issued by the Government of Kenya. The allocation to these three asset classes in Q2’2020 was 35.2%, 7.9%, and 43.7% for bank deposits, securities listed on NSE, and securities issued by the Government of Kenya, respectively in Q2’2020. The Fund is best suited for investors who require a low-risk investment that offers capital stability, liquidity, and require high-income yield. The Fund is also a good safe haven for investors who wish to switch from a higher risk portfolio to a low risk portfolio, especially during times uncertainty.
- Top Five Money Market Funds by Assets Under Management
The total Assets Under Management in Money Market Funds grew by 17.2% to Kshs 78.9 bn in Q2’2020, from Kshs 65.7 bn in Q1’2020. The top five Money Market Funds control an AUM of Kshs 64.5 bn, which translates to 81.7% of the total AUM in Money Market Funds. The table below shows the top five Money Market Funds as at Q2’2020:
|
Top 5 Money Market Funds by Assets Under Management |
||||||
|
No. |
Fund Managers |
Q1’2020 Money Market Fund (Kshs Mns) |
Q2’2020 Money Market Fund (Kshs Mns) |
Q1’2020 Market Share |
Q2’2020 Market Share |
Variance (% Points) |
|
1. |
CIC Money Market Fund |
29,016.0 |
35,735.1 |
44.0% |
45.3% |
1.3% |
|
2. |
British-American Money Market Fund |
7,334.1 |
8,463.9 |
11.0% |
10.7% |
(0.3%) |
|
3. |
NCBA Money Market Fund |
6,446.2 |
8,240.8 |
9.8% |
10.4% |
0.6% |
|
4. |
ICEA Lion Money Market Fund |
6,800.2 |
7,424.1 |
10.3% |
9.4% |
(0.9%) |
|
5. |
Old Mutual Money Market Fund |
4,545.5 |
4,636.2 |
6.9% |
5.9% |
(1.0%) |
|
|
Total |
54,141.9 |
64,500.1 |
82.0% |
81.7% |
(0.3%) |
Source: Capital Markets Authority: Collective Investments Scheme Quarterly Report
- Top Five (5) Money Market Funds by Growth Rate
As at the end of Q2’2020, Co-op Money Market Fund recorded the fastest growth in Assets under Management (AUM) coming in at 21,890.3% to Kshs 1.2 bn, from Kshs 5.3 mn recorded in Q1’2020. The top five Money Market Funds in terms of growth rate recorded in Q2’2020 as highlighted below:
|
Top 5 Money Market Funds by Growth Rate |
||||
|
No. |
Fund Managers |
Q1’2020 AUM(Kshs Mns) |
Q2’2020 AUM(Kshs Mns) |
Q2’2020 Growth Rate |
|
1 |
Co-op Money Market Fund |
5.3 |
1,156.4 |
21,890.3% |
|
2 |
Sanlam Money Market Fund |
2,700.2 |
4,292.7 |
59.0% |
|
3 |
GenCapHela Imara Money Market Fund |
434.0 |
623.6 |
43.7% |
|
4 |
Cytonn Money Market Fund |
588.6 |
776.7 |
31.9% |
|
5 |
NCBA Money Market Fund |
6,446.2 |
8,240.8 |
27.8% |
Source: Capital Markets Authority: Collective Investments Scheme Quarterly Report
- Top Five (5) Money Market Funds by Yields
During the period under review, the following Money Market Funds had the highest average effective annual yield declared, with the Cytonn Money Market Fund having the highest effective annual yield at 10.8% against the industrial average of 8.7%.
|
Top 5 Money Market Funds by Yield in Q2’2020 |
||
|
Rank |
Money Market Funds |
Effective Annual Rate (Average Q2’2020) |
|
1 |
Cytonn Money Market Fund |
10.8% |
|
2 |
Zimele Money Market Fund |
9.9% |
|
3 |
Alphafrica Kaisha Money Market Fund |
9.8% |
|
3 |
Nabo Africa Money Market Fund |
9.8% |
|
4 |
CIC Money Market Fund |
9.6% |
|
|
Industrial Average |
8.7% |
Section III: Comparing Unit Trust Funds AUM Growth with Bank Deposits Growth
Unit Trust Funds assets recorded a growth of 15.1% in Q2’2020, compared to a growth of 1.1% in Q1’2020, while the listed bank deposits grew by 18.5% in Q2’2020 compared to a growth of 14.3% recorded in Q1’2020.
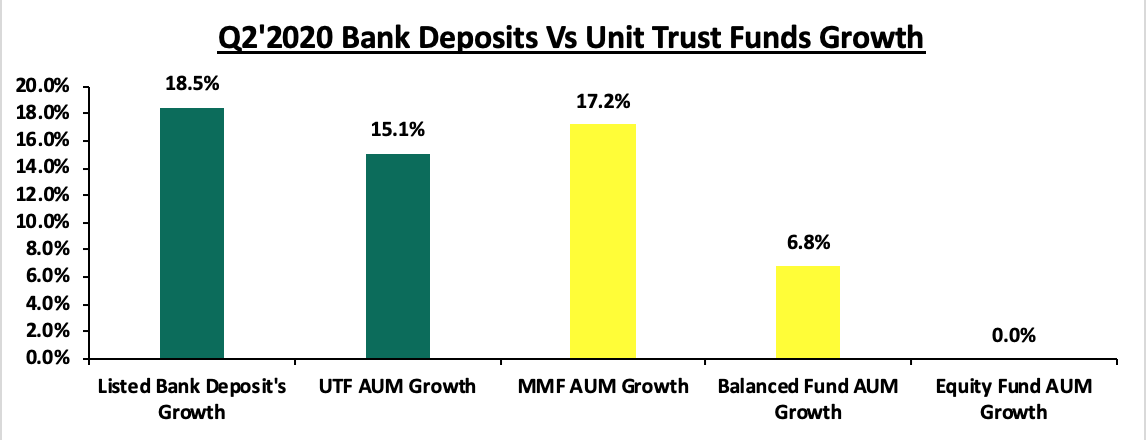
Key take-outs from the graph include:
- Bank deposit growth at 18.5% outpaced UTFs growth of 15.1%, and save for the year 2019, bank deposit growth usually outpace UTFs growth, an indication that our capital markets potential and growth remains constrained, and,
- Money Market Funds grew at a rate of 17.2%, faster than the other UTFs but slightly slower than the listed bank deposits, attributable to the funds affordability in its initial and additional investment requirements, its high liquidity as well as the daily compounding of interest. While initial deposit and additional investments may vary depending on the fund, Money Market Funds present a low risk, affordable and high-yielding investment opportunity for investors and capital preservation, a key feature of MMFs.
Kenya’s Mutual Funds / UTFs to GDP ratio at 5.4% is still very low compared to global average of 61.8%, showing that we improve and enhance our capital markets.
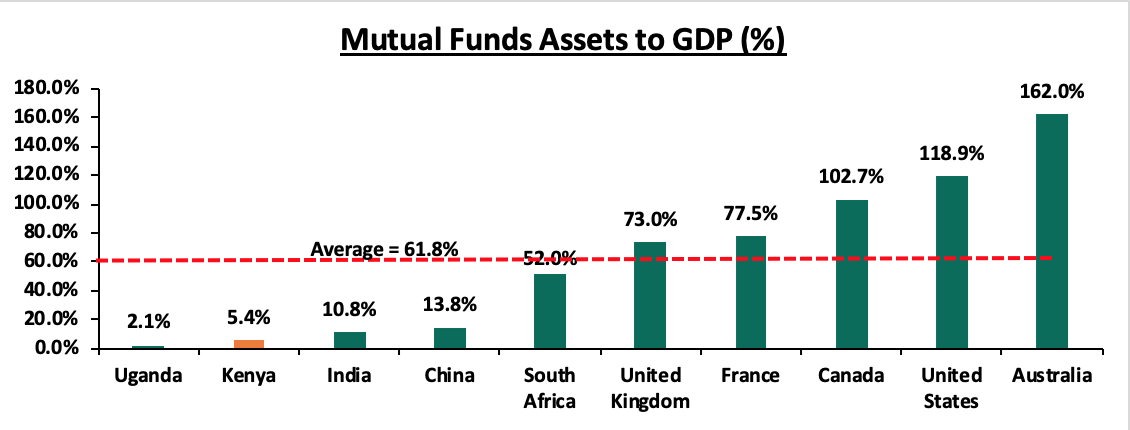
Source: World Bank Data
According to World Bank data, in well-functioning economies, businesses rely on banks for just 40.0% of their funding with the larger percentage of 60.0% coming from Capital Markets. However, in Kenya businesses rely on banks for a staggering 99.0% of their funding; with less than 1.0% coming from Capital Markets. In order to improve our Capital Markets and stimulate its growth, we recommend the following actions:
- Expand eligibility of Trustees of Unit Trust Funds to include non-bank Trustees such as Corporate Trustees. The current situation where all Trustees are banks, severely constrains capital market growth because of;
- The inherent conflict of interest where banks are Trustees in a market where they are also competing for funds, and,
- Banks are not best suited to be Trustees in complex financial products, hence this restrains the market to plain vanilla investments such as bank deposits and government debt,
- Remove conflicts of interest in the governance of capital markets and create a governance structure that is more responsive to market participants and market growth,
- Improve fund transparency to provide investors with more information. Each Unit Trust Fund should be required to publish their portfolio holdings on a quarterly basis. Q3’2020 saw investors in Amana Capital, whose funds had been frozen for the past 2 years, receive a 59.0% impairment on their investments following the losses incurred from investing in the Nakumatt commercial paper, yet they were not aware that their funds had been invested in the Commercial Paper,
- Allow for sector funds: The current capital markets regulations require that funds must diversify. Consequently, one has to seek special dispensation in form sector funds such as a financial services fund, a technology fund or a real estate UTF fund. Regulations allowing unit holders to invest in sector funds would expand the scope of unit holders interested in investing, and,
- Reduce the minimum investments to reasonable amounts: Sector funds, in addition to cumbersome incorporate as mentioned above, have high minimums of Kshs 1,000,000, which is way above the median wage of Kshs 50,000. Having sector funds minimum that is 20 times the national income seems unreasonably high.
Section IV: Conclusion
In conclusion, Money Market Funds continue to lead among unit trust products accounting for 89.6% of the total Unit Trust Funds in Q2’2020. For continued growth, there is a need to leverage more on innovation and digitization in order to further propel the growth of MMFs in Kenya. For instance, China’s first online money market fund known as Yu’eBao that has explosively grown into one of the world’s largest MMF with an AUM of USD 185.2 bn as at 30th June 2020, despite being launched in 2013. Yu’eBao of Tianhong Asset Management was launched as a spare cash management platform, allowing users to transfer idle cash as low as USD 0.15 (Kshs 15.6) into the money market fund, with the use of the Alipay e-wallet. The use of technology as a distribution channel for mutual fund products opened up the fund manager to the retail segment, which is characterized by strong demand among retail clients for convenient and innovative products. The advent of digitization and automation within the industry has enhanced liquidity. Closer home, Cytonn Money Market Fund clients can issue withdrawal instructions and have funds remitted to their bank accounts within 2 – 4 working days while funds withdrawn through the USSD or digital platforms are remitted to their M-Pesa and Bank accounts within 5 minutes and 2 working days respectively; the Cytonn Money Market Fund is accessible through dialing *809#. As highlighted in our topical Potential Effects of COVID-19 on Money Market Funds, we believe that amidst the Coronavirus pandemic, returns for Money Market Funds will remain stable with a bias to a slight increase upwards should rates on government securities increase. They will also remain the most liquid of all mutual funds providing a short-term parking bay that earns higher income yields compared to deposits and savings accounts.
Disclaimer: The views expressed in this publication are those of the writers where particulars are not warranted. This publication, which is in compliance with Section 2 of the Capital Markets Authority Act Cap 485A, is meant for general information only and is not a warranty, representation, advice or solicitation of any nature. Readers are advised in all circumstances to seek the advice of a registered investment advisor.
- Talk to us
- Kenya
- P.O Box 20695 - 00200, Nairobi, Kenya
- Cell +254(0) 709 101 000
- Tel +254(0) 20 3929 000
- WhatsApp +254(0) 748 070 000
- United States
- +1 (240) 368-6217
- DOWNLOAD OUR APP
-


- Kenya
- Cysuites work spaces, Church Rd, Westlands, Nairobi, Kenya
- USA
- Suite 1150, 1775 Eye Street NW, USA, Washington DC 20006, USA
- Investments
- High Yield
- Private Equity
- Real Estate
- Real Estate
- RiverRun Estates
- Cytonn Towers
- The Ridge
- Taraji Heights
- The Alma