Ebola virus disease case in Equateur Province, DRC is a new spillover

On 1 June 2020, the Democratic Republic of the Congo (DRC) announced a new cluster of Ebola virus disease (EVD) cases occurring in Mbandaka health zone, in Équateur Province. This is the same area where the DRC’s 9th Ebola outbreak occurred back in May 2018. A sample was sent to Institut National de Recherche Biomédicale (INRB) in Kinshasa for confirmatory testing. Ebola virus (EBOV) was confirmed by PCR on 1 June 2020 using the GeneXpert (GP ct 31, NP ct 28). The sample was sequenced using an amplicon strategy developed with Primal Scheme (using MK007330 as a reference to generate the primers), followed by Illumina Nextera DNA Flex library preparation. The consensus genome was generated using iVar on 4 June 2020.

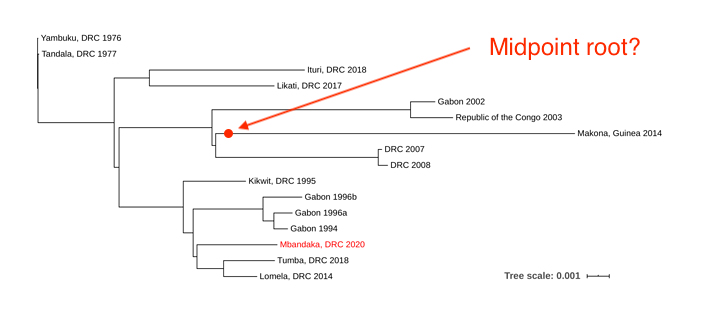
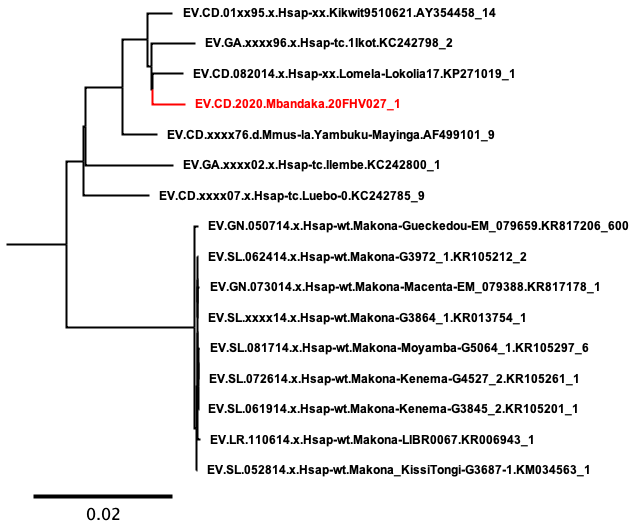
The new EVD cluster could have been seeded from the current Nord Kivu/Ituri outbreak (Ituri), from the May 2018 Équateur province outbreak (Tumba) via a persistent source, or a new spillover event from the reservoir host. The new EBOV genome was aligned to single representatives from previous EVD outbreaks using MAFFT, and a phylogenetic tree was inferred using RaxML (Figure 1).


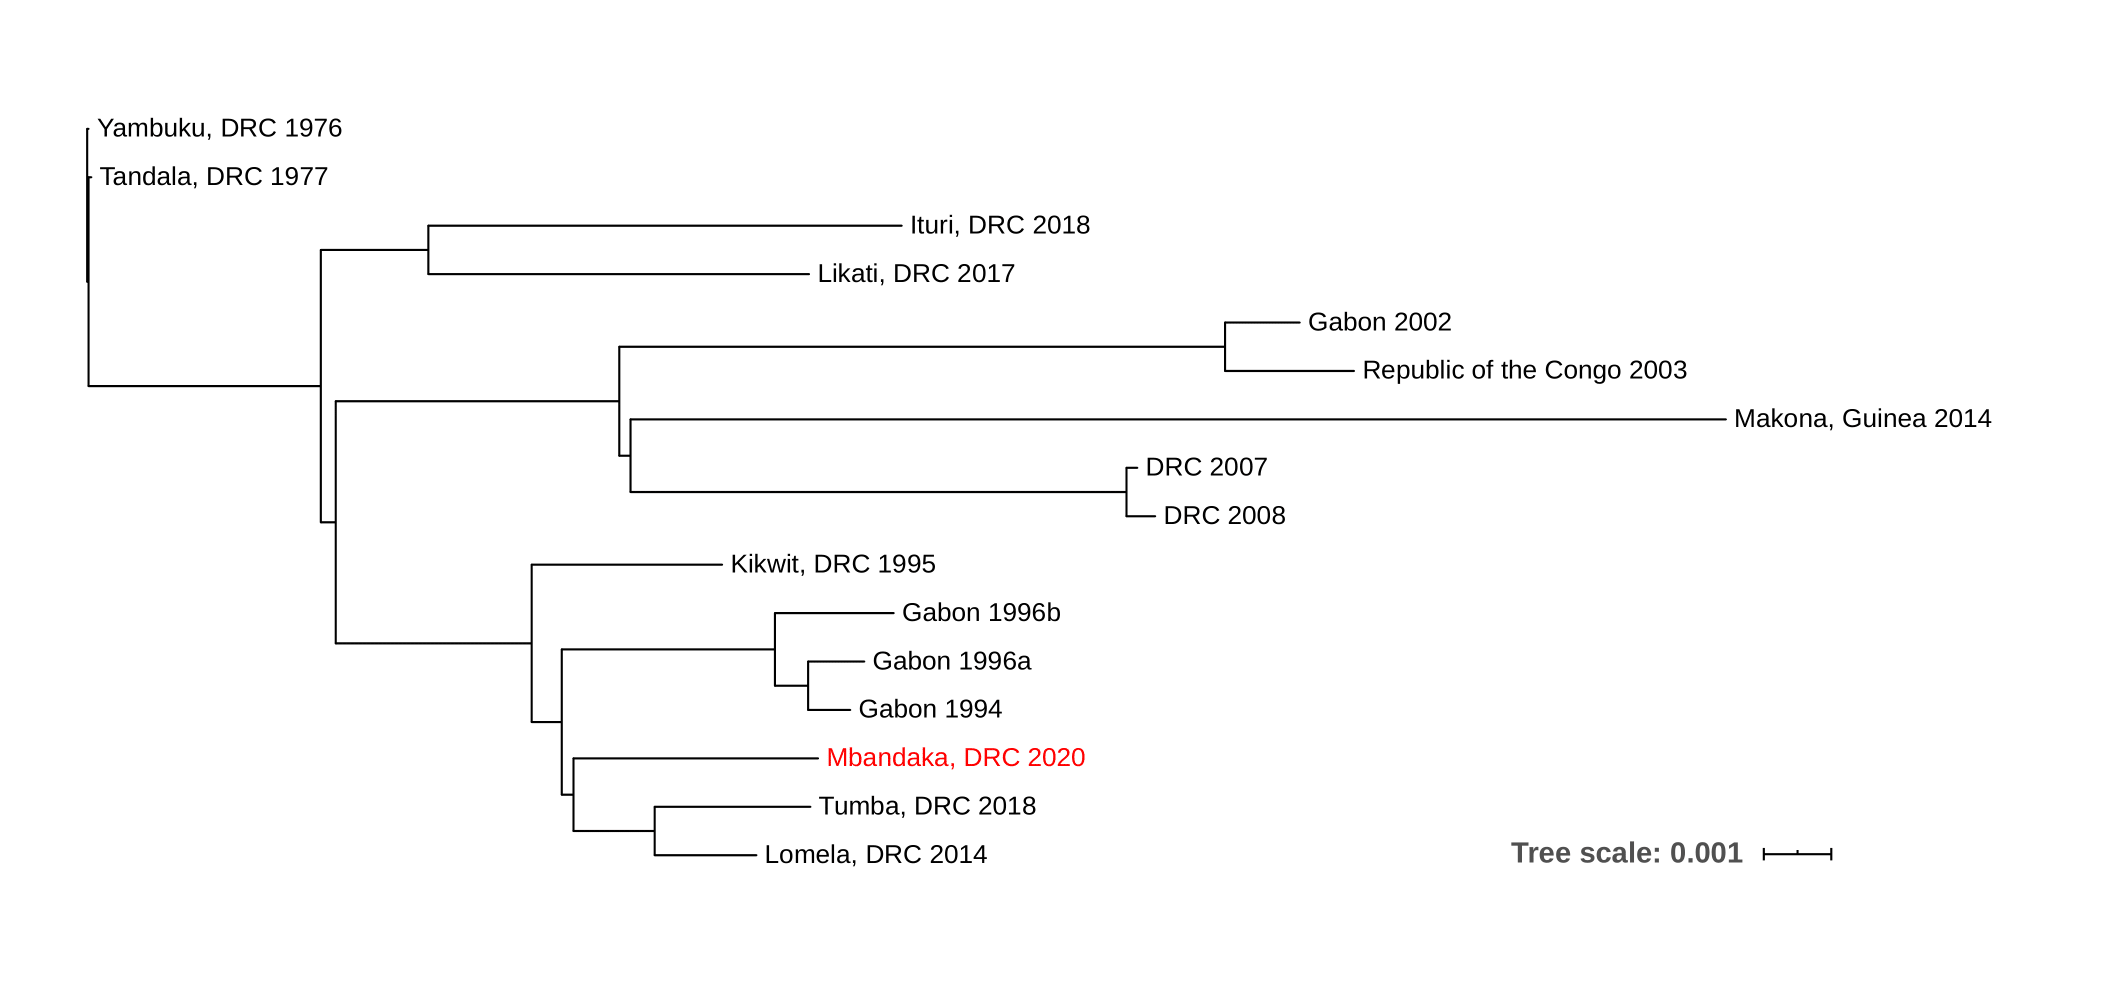
Figure 1. Maximum likelihood phylogenetic tree of all EVD outbreaks, including the sequence from the new outbreak in red.
 

Due to the level of divergence from Ituri (>350 substitutions) and Tumba (>150 substitutions), this genome likely represents a new spillover event and the 11th EVD outbreak in the DRC, the third outbreak in two years. A root-to-tip analysis (Figure 2) shows the new genome grouping with four variants that have reduced rates of evolution compared with the 11 other representative sequences. More thorough analyses will be conducted in the coming days.


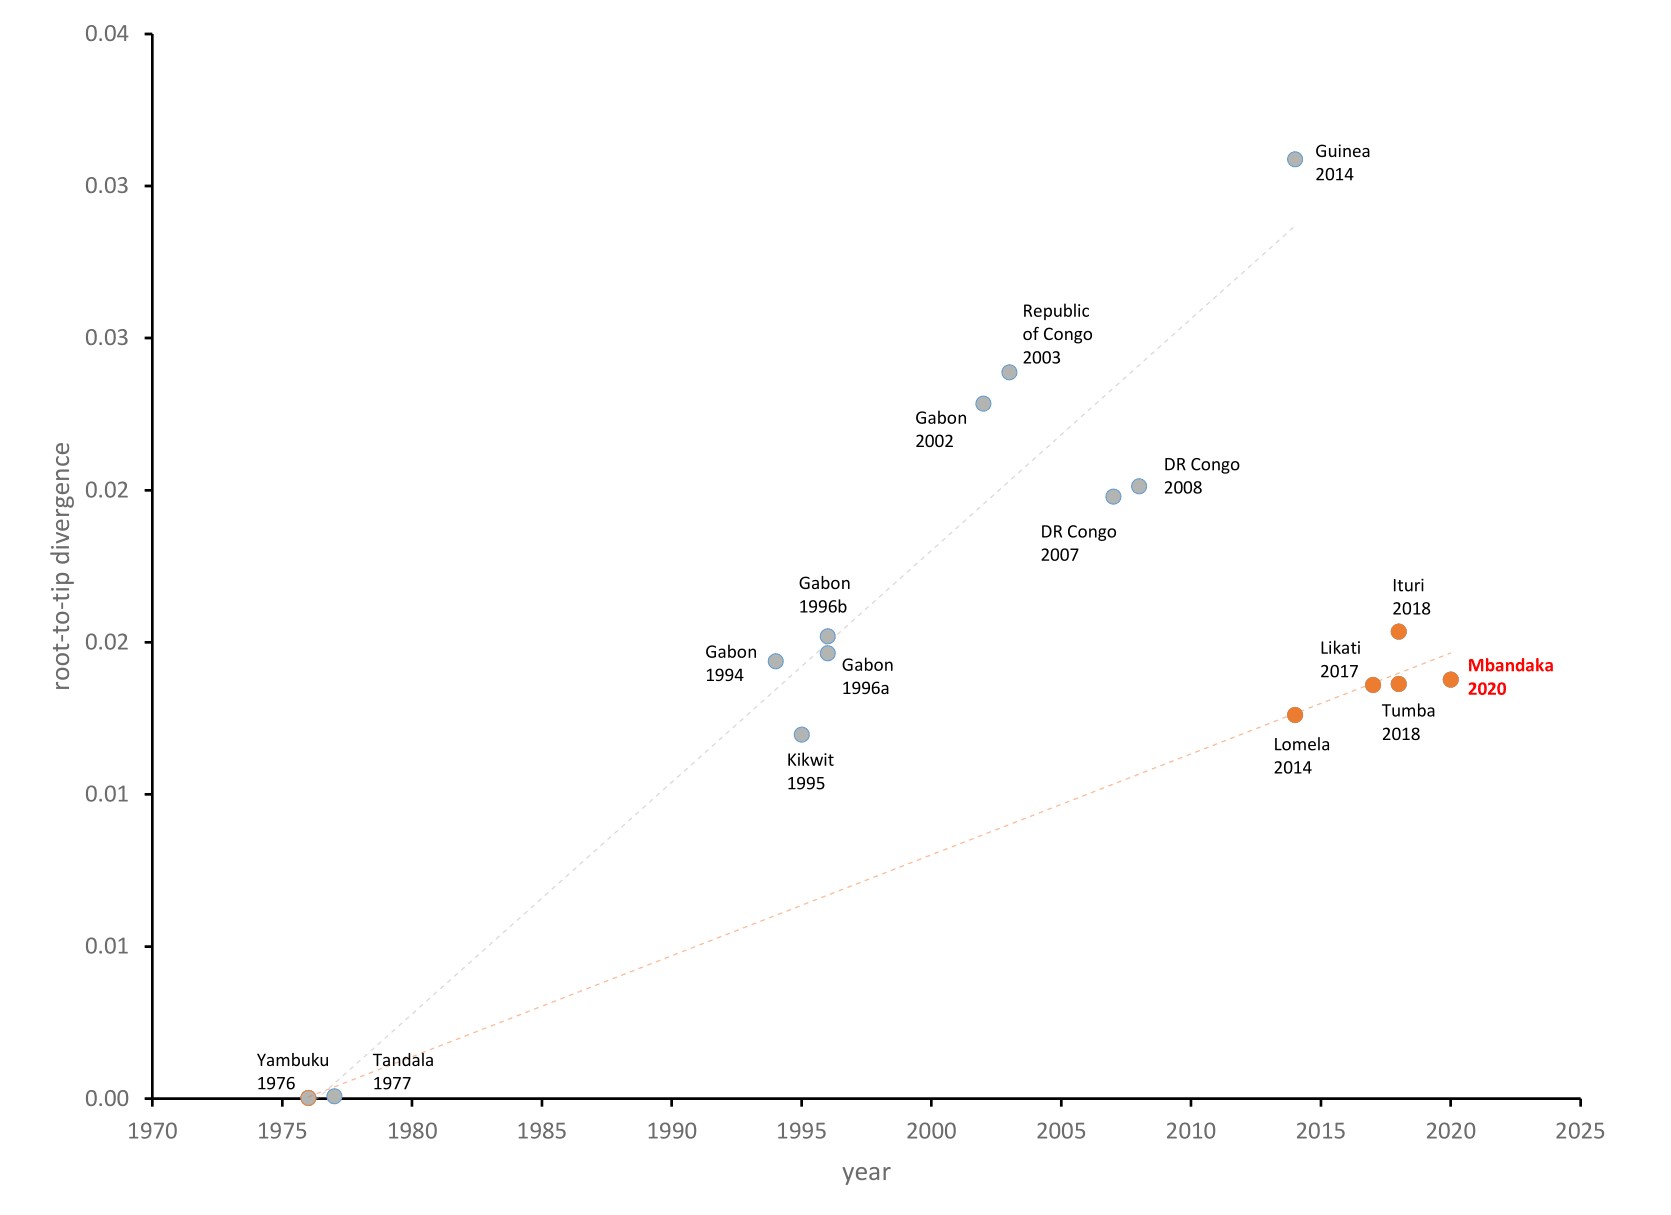
Figure 2. Inter-outbreak root-to-tip analysis. EBOV genomes from 1976 to 2014 (West Africa) (grey) and from 2014 (DRC) to 2020 (red) with the new Mbandaka genome in red text.
 

Partners and Collaborators

Prof. Jean-Jacques Muyembe-Tamfum
Institut National de Recherche Biomédicale (INRB); School of Medicine Kinshasa University

Prof. Steve Ahuka-Mundeke
INRB; School of Medicine Kinshasa University

Prof. Placide Mbala-Kingebeni
INRB; TransVIHMI (IRD, INSERM, University of Montpellier); School of Medicine Kinshasa University

Eddy Kinganda-Lusamaki
INRB; School of Medicine Kinshasa University

Adrienne Amuri-Aziza
INRB

Dr. Michael Wiley
University of Nebraska Medical Center

Catherine Pratt
University of Nebraska Medical Center

Statement on continuing work and analyses prior to publication

This genome is being shared pre-publication. Please note that this data is based on work in progress and should be considered preliminary. Our analyses of this data is ongoing and a publication communicating our findings on these and other published genomes is in preparation. If you intend to use these sequences prior to our publication, please communicate with Drs. Muyembe-Tamfum, Ahuka-Mundeke, and Mbala-Kingebeni for coordination.

Data availability

  • Sequence data is available here
  • Figures are available here

References

Grubaugh ND, Gangavarapu K, Quick J, et al. An amplicon-based sequencing framework for accurately measuring intrahost virus diversity using PrimalSeq and iVar. Genome Biol 2019;20:8. 10.1186/s13059-018-1618-7

Katoh K, Standley DM. MAFFT multiple sequence alignment software version 7: improvements in performance and usability. Mol Biol Evol 2013;30:772-80. 10.1093/molbev/mst010

Mbala-Kingebeni P, Pratt CB, Wiley MR, et al. 2018 Ebola virus disease outbreak in Equateur Province, Democratic Republic of the Congo: a retrospective genomic characterisation. Lancet Infect Dis 2019;19:641-7. 10.1016/S1473-3099(19)30124-0

Mbala-Kingebeni P, Aziza A, Di Paola N, et al. Medical countermeasures during the 2018 Ebola virus disease outbreak in the North Kivu and Ituri Provinces of the Democratic Republic of the Congo: a rapid genomic assessment. Lancet Infect Dis 2019;19:648-57. 10.1016/S1473-3099(19)30118-5

Quick, J., Grubaugh, N., Pullan, S. et al. Multiplex PCR method for MinION and Illumina sequencing of Zika and other virus genomes directly from clinical samples. Nat Protoc 2017;12:1261–1276. https://doi.org/10.1038/nprot.2017.066

Stamatakis A. RAxML version 8: a tool for phylogenetic analysis and post-analysis of large phylogenies. Bioinformatics 2014;30:1312-3. 10.1093/bioinformatics/btu033

Great work! That RTT is interesting - have never thought about it in this way… Likely due to difference in reservoir?

We did a bit of analysis into this phenomenon a while back: https://beast.community/ebov_local_clocks.html and have a model that may describe what might be going on in the reservoir populations. This new data seems to fit quite well.

We believe it is the virus becoming latent in the reservoir and then re-emerging in a similar way to what we saw in humans.

Agreed - possibly due to different reservoirs. All the slower outbreaks are also the most recent. I’d be curious to know what went on between the 2008 and 2014 outbreaks in the DRC

But based on the RTT, these appear to be parallel lineages (non-random), no? E.g. lineage 1 having reservoir 1 and lineage 2 having reservoir 2? Could also be that lineage 1 lives in a single reservoir while lineage 2 relies on two. An interesting question here is whether there are meaningfully different lineages (so difference due to virus genetics), or whether this could be e.g., caused by geographic separation.

I have always thought of these slow rates as being down to random effects, but looking at this plot makes me wonder whether these could actually be non-random.

No. They are non random. Most parsimoniously there are just two internal branches with reduced rates. After that they diverge at a constant rate again.

Yeah, I just reread that post, but I’m not quite sure it explains what we’re seeing here - assuming that I understood correctly from your post is that lineages can randomly flip between ‘active’ and ‘latent’. The issue I have here is that while viruses randomly going latent can explain why a single lineage might have a reduced rate, I have a hard time reconciling that with the RTT showing two separate lines with different slopes (evolutionary rates).

If a lineage can flip between latent and active, then you would assume some lineages would drop below the ‘main’ RTT line, but only create a ‘second’ line if the fraction at which certain lineages spend in a latent period is always the same. Presumably (?), if that wasn’t the case, such lineages would be randomly scattered below the main line with lower, but inconsistent, evolutionary rates compared to the ‘default’ rate (whatever that means).

Instead, if you have a scenario in which, say, some Ebola lineages spend time in a single reservoir, while you have other lineages cycle between, say, two reservoirs, then we might end up in a situation where we would observe two consistently different rates. Local (sub)populations of (same species?) reservoir hosts could potentially also drive different rates of evolution. Such lineages would not necessarily have to be genetically distinct (we’d of course be able to see that easily on the tree), but could be randomly selected due to e.g., geographic, local, or environmental separation.

I get the point from your post about the stem branches having the lower rate, while the tip ones do not (consistent with latency followed by (re)activation), but I’m not quite sure how that can explain the consistently lower rate that we observe for branches leading to certain outbreak variants.

Most of what looks like a “fast vs slow” set of sequences in that plot is from assuming that the more recent outbreaks are direct descendants of the 1976-1977 viruses. If the tree is midpoint rooted, rather than tooted with the 1976 virus, we see that they all have nearly equal branch lengths.

I used the alignment at LANL filovirus database, plus a few 2018 sequences, plus the 2020 sequence to build a new tree to illustrate this.

1 Like

There isn’t a consistently lower rate in branches leading to certain outbreak variants. It only requires 2 internal branches to have a reduced rate (5 fold) to explain the root to tip plot. Within each of these lineages their is a reasonably good rate correlation again (in the Figure 2 of the original plot, they shouldn’t be fitting a line back to the 70s virus). Lomela 2014, Tumba 2018 and Mbandaka 2020 have a good correlation in their divergence from their MRCA, and Likati 2017 and Ituri 2018 likewise.

3 Likes

There is now a paper on the outbreak described in this post and another one on virological.