Nairobi Metropolitan Area (NMA) Mixed Use Developments Report 2021, & Cytonn Weekly #46/2021
By Research Team, Nov 21, 2021
Executive Summary
Fixed Income
During the week, T-bills recorded an oversubscription, with the overall subscription rate coming in at 108.6%, up from the 69.3% recorded the previous week. The 91-day paper recorded the highest subscription rate, receiving bids worth Kshs 8.4 bn against the offered Kshs 4.0 bn, translating to a subscription rate of 209.9%, an increase from the 99.8% recorded the previous week. The increased interest in the 91-day paper is partly attributable to the paper’s higher return on a risk adjusted basis. The subscription rate for the 364-day and 182-day papers increased to 92.0% and 84.8%, from 74.3% and 52.0%, respectively, recorded the previous week. The yields on the 91-day, 182-day and 364-day papers increased by 4.4 bps, 6.4 bps and 9.2 bps, to 7.1%, 7.8% and 8.9%, respectively. The government accepted Kshs 23.2 bn of the Kshs 26.1 bn worth of bids received, translating to an acceptance rate of 89.2%.
During the week, the Energy and Petroleum Regulatory Authority (EPRA) released their monthly statement on the Maximum retail prices in Kenya effective 15th November 2021 to 14th December 2021 highlighting that the prices of Super Petrol, Diesel and Kerosene remained unchanged at Kshs 129.7, Kshs 110.6 and Kshs 103.5 respectively. Also during the week, the National Treasury gazetted the revenue and net expenditures for the first four months of FY’2021/2022, highlighting that the total revenue collected as at the end of October 2021 amounted to Kshs 598.5 bn, which equivalent to 33.7% of this financial year’s budget of Kshs 1.8 tn and is 101.1% of the prorated estimates of Kshs 591.9 bn. Additionally, the National Treasury released the Draft 2022 Budget Policy Statement, projecting a 7.7% increase in the target Excise Duty for FY’2021/2022 to Kshs 259.6 bn, from Kshs 241.0 bn as highlighted in the original budget estimates;
Equities
During the week, the equities market was on a downward trajectory, with NASI, NSE 20 and NSE 25 declining by 1.8%, 1.4% and 1.3%, respectively, taking their YTD performance to gains of 10.8%, 1.1% and 9.5% for NASI, NSE 20 and NSE 25, respectively. The equities market performance was driven by losses recorded by large cap stocks such as EABL, Safaricom and Co-operative Bank of 3.2%, 2.4% and 2.0%, respectively. The decline was however mitigated by gains recorded by banking stocks such as KCB and ABSA which gained by 3.1% and 2.9%, respectively;
During the week, the Capital Market Authority (CMA) released guidelines on share buybacks for listed companies, following the issue of proposed guidelines on share buy-backs in June 2020. Also, the Central Bank of Kenya (CBK), released the Commercial Banks’ Credit Survey Report for the quarter ended September 2021, highlighting that the banking sector’s loan book recorded an 8.5% y/y growth, with gross loans increasing to Kshs 3.2 tn in September 2021, from Kshs 2.9 tn in September 2020. Additionally, during the week, KCB Group, Cooperative Bank and Standard Chartered Bank released their Q3’2021 financial results, recording a 131.4%, 78.6% and 33.7% increase in their core earnings per share, respectively;
Real Estate
During the week, Hass Consult, a Real Estate Development and Consultancy firm, released the House Price Index Q3’2021, highlighting that residential properties within the Nairobi Metropolitan Area (NMA) recorded a 1.0% q/q appreciation, and a 1.1% y/y price correction. Hass Consult also released the Land Price Index Q3’2021, indicating that land prices in the Nairobi Metropolitan Area (NMA) appreciated on a q/q and y/y basis by 0.3% and 0.8%, respectively. Additionally, Knight Frank, a Real Estate Consultancy firm, released the Africa Office Market Dashboard Report Q3’2021, highlighting that major cities in Africa recorded a 49.0% q/q increase in office demand. In the infrastructure sector, Kenya Urban Roads Authority (KURA) announced the commencement of the conversion of the 32.0 Km Eastern Bypass into a dual carriage way at a cost of Kshs 12.5 bn. In the listed REIT, Fahari I-REIT declined by 2.0% to close at Kshs 6.8 per share, from Kshs 7.0 per share recorded the previous week;
Focus of the Week
In December 2020, we released the Nairobi Metropolitan Area Mixed-Use Developments (MUDs) Report-2020, which highlighted that Mixed-Use Developments (MUDs) recorded an average rental yield of 6.9%, 0.1% points higher than the respective single use Retail, Commercial Office and Residential themes with 6.8% in 2020. This week we update our report with the 2021 market research in order to determine the market performance of MUDs against the performance of the Residential, Commercial Office, and Retail sectors. In terms of performance, Mixed-Use Developments recorded an average rental yield of 7.2% in 2021, 0.7% points higher than the respective single-use themes which recorded an average rental yield of 6.5% in the similar period. Moreover, MUDs recorded a 0.3% y/y increase in the average rental yield to 7.2% in 2021, from the 6.9% realized in 2020;
Investment Updates:
- Weekly Rates:
- Cytonn Money Market Fund closed the week at a yield of 10.57%. To invest, just dial *809#;
- Cytonn High Yield Fund closed the week at a yield of 14.01% p.a. To invest, email us at sales@cytonn.com and to withdraw the interest you just dial *809#;
- We continue to offer Wealth Management Training Monday through Saturday, from 9:00 am to 11:00 am, through our Cytonn Foundation. The training aims to grow financial literacy among the general public. To register for any of our Wealth Management Trainings, click here;
- If interested in our Private Wealth Management Training for your employees or investment group, please get in touch with us through wmt@cytonn.com;
- Any CHYS and CPN investors still looking to convert are welcome to consider one of the five projects currently available for conversion, click here for the latest conversion term sheet;
- Cytonn Insurance Agency acts as an intermediary for those looking to secure their assets and loved ones’ future through insurance namely; Motor, Medical, Life, Property, WIBA, Credit and Fire and Burglary insurance covers. For assistance, get in touch with us through insuranceagency@cytonn.com;
- Cytonnaire Savings and Credit Co-operative Society Limited (SACCO) provides a savings and investments avenue to help you in your financial planning journey. To enjoy competitive investment returns, kindly get in touch with us through clientservices@cytonn.com;
Real Estate Updates:
- For an exclusive tour of Cytonn’s real estate developments, visit: Sharp Investor's Tour, and for more information, email us at sales@cytonn.com;
- Phase 3 of The Alma is now ready for occupation. To rent please email properties@cytonn.com;
- We have 8 investment-ready projects, offering attractive development and buyer targeted returns; See further details here: Summary of Investment-ready Projects;
- For recent news about the group, see our news section here;
Hospitality Updates:
- We currently have promotions for Staycations. Visit cysuites.com/offers for details or email us at sales@cysuites.com;
- Share a meal with a friend during the Sunday Brunch at The Hive Restaurant at Cysuites Hotel and Apartment. Every Sunday from 11.00 AM to 4.00 PM at a price of Kshs 2,500 for Adults and Kshs 1,500 for children under 12 years;
Kenya’s 2022 Election Campaign Promises Tracker
Election Watch:
Kenya’s next Presidential Elections are set to be held in August 2022 and with less than a year left, we have seen the political temperatures in the country continue to rise. As such, we shall be analyzing the economic campaign promises made by the politicians and the impact these promises will have on the economy. To read more on the same, click here.
Money Markets, T-Bills Primary Auction:
During the week, T-bills recorded an oversubscription, with the overall subscription rate coming in at 108.6%, up from the 69.3% recorded the previous week. The 91-day paper recorded the highest subscription rate, receiving bids worth Kshs 8.4 bn against the offered Kshs 4.0 bn, translating to a subscription rate of 209.9%, an increase from the 99.8% recorded the previous week. The increased interest in the 91-day paper is partly attributable to the paper’s higher return on a risk adjusted basis. The subscription rate for the 364-day and 182-day papers increased to 92.0% and 84.8%, from 74.3% and 52.0%, respectively, recorded the previous week. The yields on the 91-day, 182-day and 364-day papers increased by 4.4 bps, 6.4 bps and 9.2 bps, to 7.1%, 7.8% and 8.9%, respectively. The government accepted Kshs 23.2 bn of the Kshs 26.1 bn worth of bids received, translating to an acceptance rate of 89.2%.
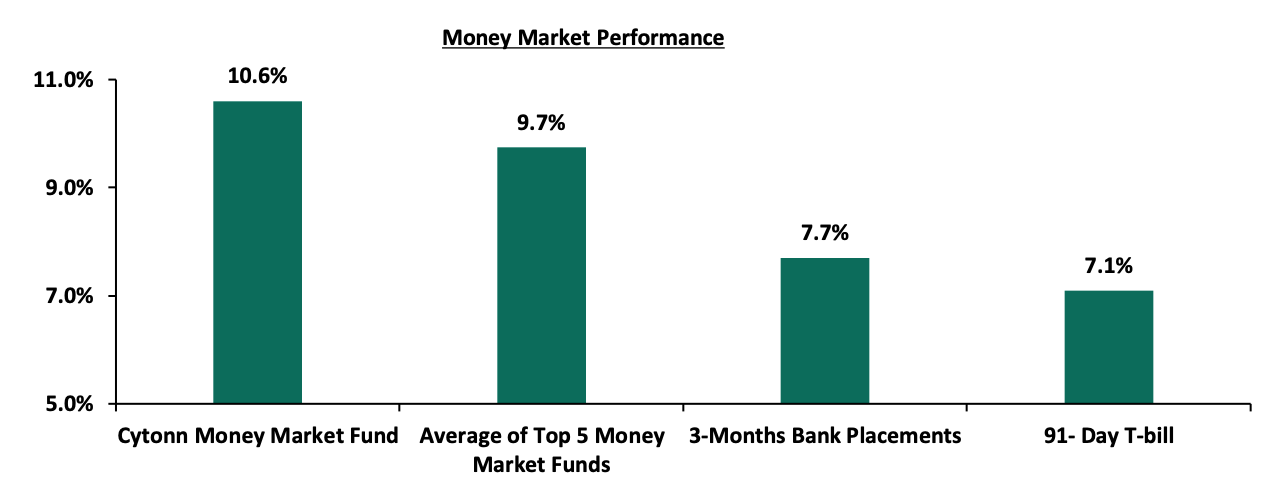
In the money markets, 3-month bank placements ended the week at 7.7% (based on what we have been offered by various banks), while the yield on the 91-day T-bill increased by 4.4 bps to 7.1%. The average yield of the Top 5 Money Market Funds declined by 0.1% points to 9.7%, from 9.8% recorded last week, while the yield on the Cytonn Money Market Fund remained relatively unchanged at 10.6%.
The table below shows the Money Market Fund Yields for Kenyan Fund Managers as published on 19th November:
|
|
Money Market Fund Yield for Fund Managers as published on 19th November 2021 |
|
|
Rank |
Fund Manager |
Effective Annual Rate |
|
1 |
Cytonn Money Market Fund |
10.57% |
|
2 |
Zimele Money Market Fund |
9.91% |
|
3 |
Nabo Africa Money Market Fund |
9.70% |
|
4 |
Sanlam Money Market Fund |
9.36% |
|
5 |
CIC Money Market Fund |
9.14% |
|
6 |
Co-op Money Market Fund |
8.96% |
|
7 |
Apollo Money Market Fund |
8.95% |
|
8 |
GenCapHela Imara Money Market Fund |
8.92% |
|
9 |
Madison Money Market Fund |
8.88% |
|
10 |
Dry Associates Money Market Fund |
8.61% |
|
11 |
British-American Money Market Fund |
8.50% |
|
12 |
Orient Kasha Money Market Fund |
8.40% |
|
13 |
NCBA Money Market Fund |
8.35% |
|
14 |
ICEA Lion Money Market Fund |
8.34% |
|
15 |
Old Mutual Money Market Fund |
7.39% |
|
16 |
AA Kenya Shillings Fund |
6.59% |
Source: Business Daily
Liquidity:
During the week, liquidity in the money markets tightened, with the average interbank rate increasing by 0.5% points to 5.2% from 4.7% recorded the previous week, partly attributable to tax remittances which offset Government payments. The average interbank volumes traded increased by 11.3% to Kshs 11.0 bn, from Kshs 9.9 bn recorded the previous week.
Kenya Eurobonds:
During the week, the yields on Eurobonds recorded mixed performance, with the 30-year bond issued in 2018 increasing by 0.1% points to 7.9%, from 7.8% recorded the previous week, while yields on the 12-year bond issued in 2021 declined by 0.1% to 6.4%, from 6.5% recorded the previous week. Yields on the 10-year bond issued in 2014, 10-year bond issued in 2018, 7-year bond issued in 2019 and 12-year bond issued in 2019 remained unchanged at 3.8%, 5.6%, 5.4% and 6.6%, respectively. Below is a summary of the performance:
|
Kenya Eurobond Performance |
||||||
|
|
2014 |
2018 |
2019 |
2021 |
||
|
Date |
10-year issue |
10-year issue |
30-year issue |
7-year issue |
12-year issue |
12-year issue |
|
31-Dec-20 |
3.9% |
5.2% |
7.0% |
4.9% |
5.9% |
- |
|
29-Oct-21 |
3.7% |
5.7% |
7.9% |
5.5% |
6.7% |
6.5% |
|
12-Nov-21 |
3.8% |
5.6% |
7.8% |
5.4% |
6.6% |
6.5% |
|
15-Nov-21 |
3.8% |
5.6% |
7.8% |
5.4% |
6.6% |
6.4% |
|
16-Nov-21 |
3.8% |
5.6% |
7.8% |
5.4% |
6.6% |
6.4% |
|
17-Nov-21 |
3.8% |
5.6% |
7.8% |
5.4% |
6.6% |
6.4% |
|
18-Nov-21 |
3.8% |
5.6% |
7.9% |
5.4% |
6.6% |
6.4% |
|
Weekly Change |
0.0% |
0.0% |
0.1% |
0.0% |
0.0% |
(0.1%) |
|
MTD Change |
0.1% |
(0.1%) |
0.0% |
(0.1%) |
(0.1%) |
(0.1%) |
|
YTD Change |
(0.1%) |
0.4% |
0.8% |
0.5% |
0.7% |
- |
Kenya Shilling:
During the week, the Kenyan shilling depreciated marginally by 0.3% against the US dollar to close the week at Kshs 112.2, from Kshs 111.8 recorded the previous week, mainly attributable to increased dollar demand from commodity and energy sector importers outweighing the supply of dollars from exporters. Key to note, these are the lowest lows that the Kenyan shilling has ever depreciated to against the dollar. On a YTD basis, the shilling has depreciated by 2.8% against the dollar, in comparison to the 7.7% depreciation recorded in 2020. We expect the shilling to remain under pressure for the remainder of 2021 as a result of:
- Rising uncertainties in the global market due to the Coronavirus pandemic, which has seen investors continue to prefer holding their investments in dollars and other hard currencies and commodities,
- Increased demand from merchandise traders as they beef up their hard currency positions in anticipation for more trading partners reopening their economies globally, and,
- Rising global crude oil prices on the back of supply constraints at a time when demand is picking up with the easing of COVID-19 restrictions and as economies reopen.
The shilling is however expected to be supported by:
- The Forex reserves, currently at USD 8.9 bn (equivalent to 5.4-months of import cover), which is above the statutory requirement of maintaining at least 4.0-months of import cover, and the EAC region’s convergence criteria of 4.5-months of import cover. In addition, the reserves were boosted by the USD 1.0 bn proceeds from the Eurobond issued in July, 2021 coupled with the USD 407.0 mn IMF disbursement and the USD 130.0 mn World Bank loan financing received in June, 2021, and,
- Improving diaspora remittances evidenced by a 28.2% y/y increase to USD 337.4 mn in October 2021, from USD 263.1 mn recorded over the same period in 2020, which has continued to cushion the shilling against further depreciation.
Weekly Highlights:
- Fuel Prices
During the week, the Energy and Petroleum Regulatory Authority (EPRA) released their monthly statement on the maximum retail prices in Kenya effective 15th November 2021 to 14th December 2021. Notably, fuel prices remained unchanged at Kshs 129.7 per litre for Super Petrol, Kshs 110.6 per litre for Diesel and Kshs 103.5 per litre for Kerosene. Below are the key take-outs from the statement:
- The performance in fuel prices was attributable to:
-
- The fuel subsidy program under the Petroleum Development Fund which resulted in subsidies of Kshs 13.8 on Super Petrol, Kshs 15.7 on Diesel and Kshs 11.6 on Kerosene,
-
- Removal of suppliers margins of Kshs 6.3 on Super Petrol, Kshs 5.5 on Diesel and Kshs 7.7 on Kerosene, and,
-
- The decline in the Free on Board (FOB) price of Murban crude oil in October 2021 by 5.1% to USD 69.7 per barrel, from USD 73.5 per barrel in September 2021.
- The retention of fuel prices was despite:
-
- An increase in the average landed costs of Super Petrol by 8.7% to USD 606.1 per cubic meter in October 2021, from USD 557.7 per cubic meter in September 2021,
-
- Increase in the average landed costs of diesel by 11.2% to USD 561.1 per cubic meter in October 2021, from USD 504.7 per cubic meter in September 2021,
-
- Increase in the average landed costs of Kerosene by 9.3% to USD 522.1 per cubic meter in October 2021 from USD 477.8 per cubic meter in September 2021, and,
-
- Depreciation of the Kenyan shilling by 0.8% to Kshs 111.1 in October 2021, from Kshs 110.2 in September 2021.
Global fuel prices have declined by 1.9% in the first two weeks of November 2021, but have increased by 61.4% on a YTD basis, to USD 80.8 from USD 50.2 at the end of 2020. The decline in global prices in November 2021 is attributable to reduced oil demand in Europe as a result of a spike in COVID-19 cases which has necessitated imposition of restrictions in some countries.
Going forward, we expect muted pressure on the inflation basket as fuel prices which are among the major contributors to Kenya’s headline inflation remain constant following the Fuel Subsidy program. However, we believe the stabilization under the fuel subsidy program by the National Treasury will be unsustainable should the average landed costs of fuel keep rising. The National Treasury will also have to compensate the Oil Marketing companies and suppliers whose edges were decreased by 100.0% in the most recent review putting further strain on the program's viability.
- Revenue and Net Exchequer for FY’2021/2022
The National Treasury gazetted the revenue and net expenditures for the first four months of FY’2021/2022, ending 31st October 2021. Below is a summary of the performance:
|
FY'2021/2022 Budget Outturn - As at 31st October 2021 |
|||||
|
Amounts in Kshs billions unless stated otherwise |
|||||
|
Item |
12-months Original Estimates |
Actual Receipts/Release |
Percentage Achieved |
Prorated Estimates |
% achieved of prorated |
|
Opening Balance |
|
21.3 |
|
|
|
|
Tax Revenue |
1,707.4 |
548.4 |
32.1% |
569.1 |
96.4% |
|
Non-Tax Revenue |
68.2 |
28.9 |
42.3% |
22.7 |
127.0% |
|
Total Revenue |
1,775.6 |
598.5 |
33.7% |
591.9 |
101.1% |
|
External Loans & Grants |
379.7 |
10.8 |
2.9% |
126.6 |
8.6% |
|
Domestic Borrowings |
1,008.4 |
360.8 |
35.8% |
336.1 |
107.3% |
|
Other Domestic Financing |
29.3 |
4.2 |
14.2% |
9.8 |
42.5% |
|
Total Financing |
1,417.4 |
375.7 |
26.5% |
472.5 |
79.5% |
|
Recurrent Exchequer issues |
1,106.6 |
343.2 |
31.0% |
368.9 |
93.0% |
|
CFS Exchequer Issues |
1,327.2 |
369.8 |
27.9% |
442.4 |
83.6% |
|
Development Expenditure & Net Lending |
389.2 |
101.4 |
26.0% |
129.7 |
78.1% |
|
County Governments + Contingencies |
370.0 |
92.5 |
25.0% |
123.3 |
75.0% |
|
Total Expenditure |
3,193.0 |
906.9 |
28.4% |
1,064.3 |
85.2% |
|
Fiscal Deficit excluding Grants |
(1,417.4) |
(308.3) |
21.8% |
(472.5) |
65.3% |
|
Fiscal Deficit as a % of GDP |
8.2%* |
2.5% |
|
|
|
|
Total Borrowing
|
1,388.1 |
371.6 |
26.8% |
462.7 |
80.3% |
|
*Projected Fiscal Deficit as a % of GDP |
|||||
The key take-outs from the report include:
- Total revenue collected as at the end of October 2021 amounted to Kshs 598.5 bn, equivalent to 33.7% of the original estimates of Kshs 1.8 tn and is 101.1% of the prorated estimates of Kshs 591.9 bn. Cumulatively, Tax revenues amounted to Kshs 548.4 bn, equivalent to 32.1% of the target of Kshs 1,707.4 bn and are 96.4% of the prorated estimates of Kshs 569.1 bn,
- Total financing amounted to Kshs 375.7 bn, equivalent to 26.5% of the original estimates of Kshs 1,417.4 tn and is 79.5% of the prorated estimates of Kshs 472.5 bn. Additionally, domestic borrowing amounted to Kshs 360.8 bn, equivalent to 35.8% of the original estimates of Kshs 1.0 tn and is 107.3% of the prorated estimates of Kshs 336.1 bn,
- The total expenditure amounted to Kshs 906.9 bn, equivalent to 28.4% of the original estimates of Kshs 3,193.0 bn, and is 85.2% of the prorated expenditure estimates of Kshs 1.1 tn. Additionally, the net disbursements to recurrent expenditures came in at Kshs 343.2 bn, equivalent to 31.0% of the original estimates and 93.0% of the prorated estimates of Kshs 368.9 bn, and development expenditure amounted to Kshs 101.4 bn, equivalent to 26.0% of the original estimates of Kshs 389.2 bn and is 78.1% of the prorated estimates of Kshs 129.7 bn,
- Consolidated Fund Services (CFS) Exchequer issues lagged behind their target of Kshs 1,327.2 bn after amounting to Kshs 369.8 bn, equivalent to 27.9% of the target, and are 83.6% of the prorated amount of Kshs 442.4 bn. The cumulative public debt servicing cost amounted to Kshs 323.2 bn which is 27.6% of the original estimates of Kshs 1,169.2 bn, and is 82.9% of the prorated estimates of Kshs 389.7 bn, and,
- Total Borrowings as at the end of October 2021 amounted to Kshs 371.6 bn, equivalent to 26.8% of the Kshs 1,388.1 bn target and are 80.3% of the prorated estimates of Kshs 462.7 bn. The cumulative domestic borrowing target of Kshs 1.0 tn comprises of adjusted Net domestic borrowings of Kshs 661.6 bn and Internal Debt Redemptions (Roll-overs) of Kshs 346.8 bn.
The strong revenue performance in the first four months of the current fiscal year is commendable and can be attributed to economic recovery from the continuous ease of COVID-19 containment measures coupled with effectiveness of the KRA in tax collection. Additionally, the implementation of the Finance Act 2021 which brought changes to the Excise Duty Tax, Income Tax as well as the Value Added Tax is set to expand the tax base and consequently enhance revenue collection.
- Draft 2022 Budget Policy Statement
During the week, the National Treasury released the Draft 2022 Budget Policy Statement, projecting a 7.7% increase in the target Excise Duty for FY’2021/2022 to Kshs 259.6 bn, from Kshs 241.0 bn as highlighted in the original budget estimates. The increase in the Excise duty revenue collection target follows the publishing of the Legal Notice 217 of 2021, which allowed the Kenya Revenue Authority, (KRA) to adjust the specific rates of excise duty upwards by 5.0% in line with average annual inflation rate for the FY’2020/2021. The products set to be affected by the increase are consumer goods such as Alcoholic and non-alcoholic drinks including beer and spirits, tobacco products, chocolates and motorcycles that are not locally assembled. Key to note, Petroleum products were not affected by the adjustment due to a petition lodged at the High Court in September 2021 which is still pending determination. Other key take-outs from the report include;
- Ordinary revenue to be collected by the KRA at the end of FY’2021/2022 is projected to increase by 1.4% to Kshs 1.80 tn, from Kshs 1.77 in the original estimates, following increase in taxes such as excise duty. In FY’2022’2023, the National Treasury projects to collect Kshs 2.1 tn in ordinary revenue, boosted by a projected growth in income tax of 22.0% to Kshs 1.0 tn from Kshs 0.8 tn,
- Value Added Tax (VAT) projected estimates for FY’2021’2022 are projected to grow slightly by 0.9% to Kshs 477.1 bn, from Kshs 472.9 bn in the original estimates. However, in FY’2022’2023, VAT revenue is expected to increase by 22.6% to Kshs 584.7 bn from Kshs 477.1 bn,
- Total expenditure estimates for FY’2021/2022 increased by 4.1% to Kshs 3.2 tn from Kshs 3.0 tn, mainly attributable to an 8.0% increase in interest payments on domestic and external loans projections to Kshs 605.3 bn, from Kshs 560.3 bn. In FY’2022/2023, total expenditure is projected to grow by 1.4% to Kshs 3.20 tn from Kshs 3.15 tn in FY’2021/2022, and,
- Fiscal deficit for FY’2021/2022 was projected to increase by 10.0% to a deficit of Kshs 1.1 tn from Kshs 1.0 tn in the previous estimates, attributable to the faster 4.1% growth in expenditures projections growth than Total revenue growth of 1.4%. In FY’2021’2022, the fiscal deficit is projected to decline significantly by 24.9% to Kshs 0.8 tn from Kshs 1.1 tn in FY’2021/20212 estimates.
The increased revenue collection target to Kshs 2.4 tn for FY’2022/2023, from this fiscal year’s target of Kshs 2.1 tn was expected given expansion of the tax base following the implementation of the Finance Act 2021. The upwards adjustment for specific rates of excise duty is also expected to increase KRAs revenue collections. However, despite KRA's efforts to expand the tax base, we believe that the fiscal deficit will remain to be ever present due to the historical mismatch between revenue and expenditure.
Rates in the fixed income market have remained relatively stable due to the sufficient levels of liquidity in the money markets. The government is 26.7% ahead of its prorated borrowing target of Kshs 265.9 bn having borrowed Kshs 337.6 bn of the Kshs 658.5 bn borrowing target for the FY’2021/2022. We expect a gradual economic recovery going into FY’2021/2022 as evidenced by KRAs collection of Kshs 598.5 bn in revenues during the first four months of the current fiscal year, which is equivalent to 101.1% of the prorated revenue collection target. However, despite the projected high budget deficit of 7.5% and the lower credit rating from S&P Global to 'B' from 'B+', we believe that the monetary support from the IMF and World Bank will mean that the interest rate environment may stabilize since the government will not be desperate for cash.
Markets Performance
During the week, the equities market was on a downward trajectory, with NASI, NSE 20 and NSE 25 declining by 1.8%, 1.4% and 1.3%, respectively, taking their YTD performance to gains of 10.8%, 1.1% and 9.5% for NASI, NSE 20 and NSE 25, respectively. The equities market performance was driven by losses recorded by large cap stocks such as EABL, Safaricom and Co-operative Bank of 3.2%, 2.4% and 2.0%, respectively. The decline was however mitigated by gains recorded by banking stocks such as KCB and ABSA which gained by 3.1% and 2.9%, respectively.
During the week, equities turnover declined by 28.8% to USD 22.3 mn, from USD 31.3 mn recorded the previous week, taking the YTD turnover to USD 1.1 bn. Foreign investors remained net sellers, with a net selling position of USD 2.9 mn, from a net selling position of USD 7.6 mn recorded the previous week, taking the YTD net selling position to USD 38.9 mn.
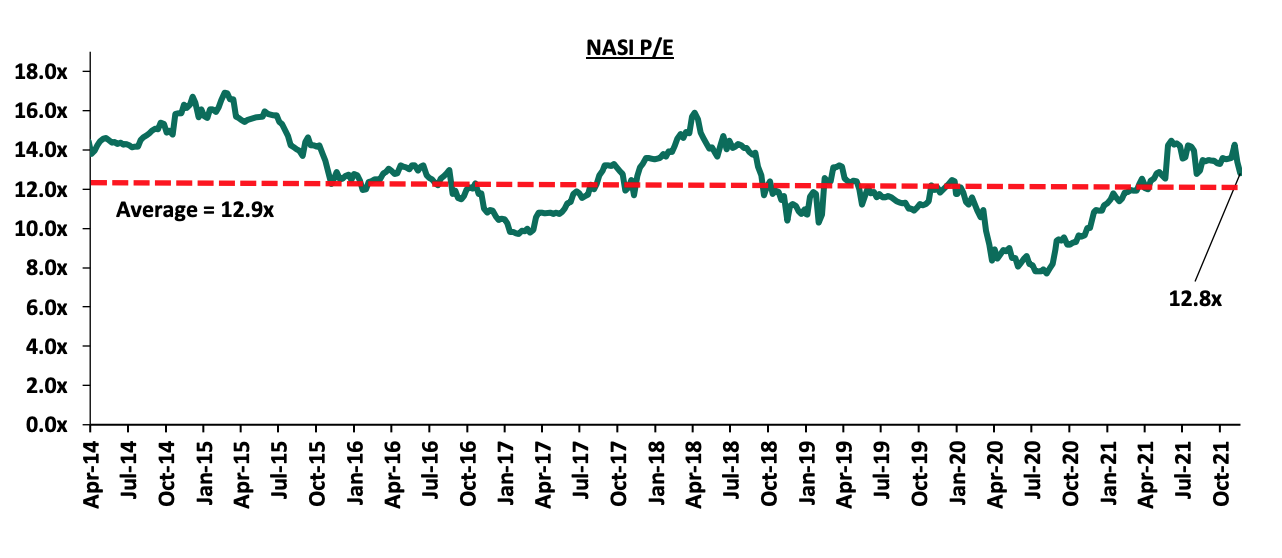
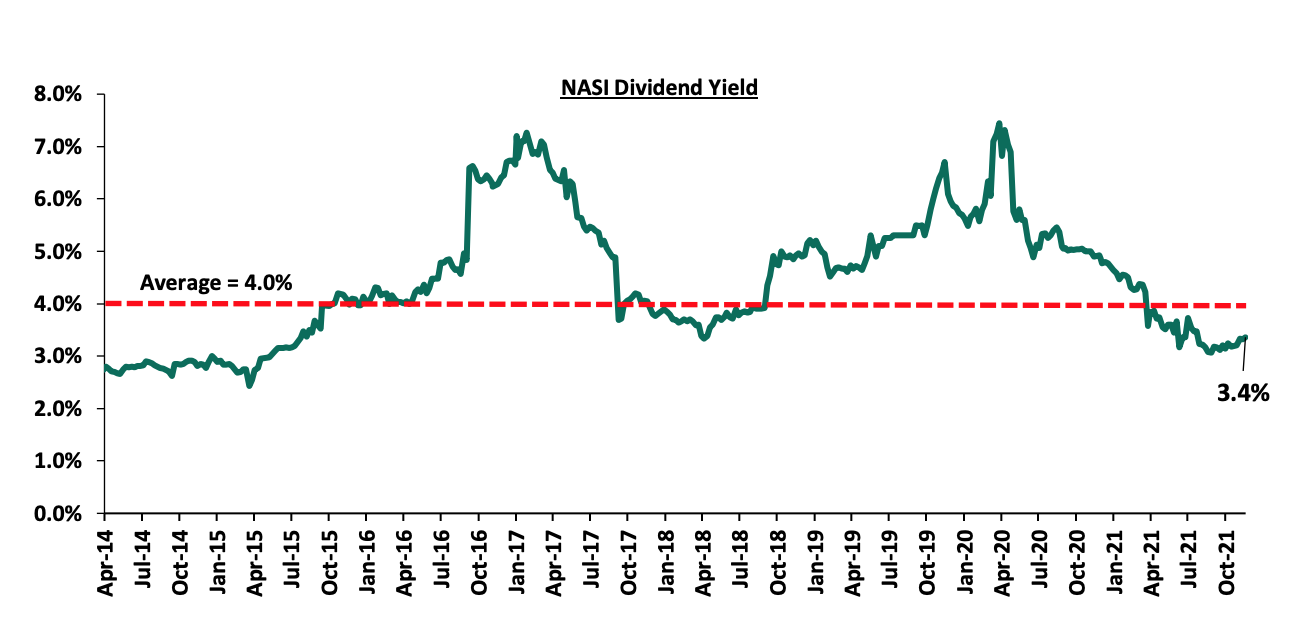
The market is currently trading at a price to earnings ratio (P/E) of 12.8x, 1.2% below the historical average of 12.9x, and a dividend yield of 3.4%, 0.6% points below the historical average of 4.0%. This week’s P/E is the lowest it has been since August 2021. Key to note, NASI’s PEG ratio currently stands at 1.4x, an indication that the market is trading at a premium to its future earnings growth. Basically, a PEG ratio greater than 1.0x indicates the market may be overvalued while a PEG ratio less than 1.0x indicates that the market is undervalued. Excluding Safaricom, which is currently 60.7% of the market, the market is trading at a P/E ratio of 11.8x and a PEG ratio of 1.3x. The current P/E valuation of 12.8x is 66.0% above the most recent trough valuation of 7.7x experienced in the first week of August 2020. The charts below indicate the historical P/E and dividend yields of the market.
Weekly Highlight:
- Guidelines on Buybacks for Listed Companies
During the week, the Capital Market Authority (CMA) released guidelines on share buybacks for listed companies, following the issuance of proposed guidelines on share buy-backs, in June 2020, which have been in the process of revision following public participation. The guidelines are in line with Part XVI, Section 447 of the Companies Act, 2015, that introduced a share buyback option for publicly traded companies and aims to enhance investor protection, promote liquidity and ensure transparency in share buyback transactions.
Some of the key highlights of the guidelines include:
- The listed firm intending to conduct a share buyback should ensure that its Articles of association allows the said firm to carry out share buybacks. Additionally, the proposed share buyback must be authorized by shareholders in a general meeting,
- The company should avail a shareholder circular disclosing all material information that the shareholders of the listed firm and their professional advisers would reasonably require so as to make informed decisions on the acceptance or rejection of the proposed share buyback transaction. The disclosure should include; (i) reason for the buyback, (ii) number of shares to be bought back, (iii) method of effecting the buyback, (iv) impact of the share buyback on the company’s financial position, and, (v) validity period for the buyback once approval is given, amongst other disclosures,
- The Authority can cancel any share buyback transaction if the said firm executes the deal 2 weeks prior to the publication of its half-yearly or annual financial statements; or after it has become aware of any material information which has not been made public and which if disclosed, could affect the price of the shares. Additionally, a buyback may be canceled or otherwise suspended if material information is announced within 14 days prior to the buyback being conducted,
- The volume of the shares repurchased on any single day must not exceed 25.0% of the average daily trading volume for the four calendar weeks preceding the week of the purchase and must not be executed as to significantly affect the liquidity of the shares in question, and,
- For on-market transactions, the maximum share buyback price shall be 10.0% above the weighted average price of the share 10 days prior to the day of the Board resolution of share buyback. The minimum share buyback price, on the other hand, shall be the nominal price of the shares or the prevailing market price of the shares at the time the resolution was approved by the shareholders.
The new guidelines come after Nation Media Group (NMG) became the first listed company in the Nairobi Stock Exchange (NSE) to conduct a share buyback which ran from 28th June 2021 to 24th September 2021. As highlighted in our Cytonn Q3’2021 market review, the share buyback saw NMG acquire 17.1 mn ordinary shares out of the targeted 20.7 mn ordinary shares, representing an 82.5% success rate. In our view, the move by CMA to issue guidelines on the share buybacks is commendable, as the guidelines provide clarity on the procedures and requirements for share buybacks. We expect more listed companies to conduct buybacks in the NSE, especially for companies whose prices and valuations are at historical lows. The 10.0% limit on the share buyback price will minimize the impact on a company's balance sheet by reducing the cash or debt outlay for financing the buyback. However, the cap on share buyback price could limit companies intending to repurchase their shares at a much higher price so as to support their undervalued share price.
- CBK Credit Survey Report – Q3’2021
During the week, the Central Bank of Kenya (CBK), released the Commercial Banks’ Credit Survey Report for the quarter ended September 2021. The quarterly Credit Officer Survey is undertaken by the CBK to identify the potential drivers of credit risk in the banking sector. During the quarter, 38 operating commercial banks and 1 mortgage finance company participated in the Commercial Banks Credit Officer Survey. The report highlights that the banking sector’s loan book recorded an 8.5% y/y growth, with gross loans increasing to Kshs 3.2 tn in September 2021, from Kshs 2.9 tn in September 2020. On a q/q basis, the loan book increased by 2.5% from Kshs 3.1 tn in June 2021. Other key take-outs from the report include:
- Profit before Tax (PBT) for the banking sector increased by 68.0% y/y to Kshs 49.1 bn in Q3’2021, from Kshs 29.2 bn in Q3’2020. Quarterly, however, Profit before Tax decreased by 2.9% to Kshs 49.1 bn in September 2021, from Kshs 50.5 bn in June 2021 attributable to the higher increase in operating expenses by 4.7%, compared to the 2.2% increase recorded by operating income. Additionally, Return on Assets decreased to 2.65% September 2021, from Kshs 2.71 tn in June 2021,
- The aggregate balance sheet recorded a 10.6% y/y growth to Kshs 5.8 tn in Q3’2021, from Kshs 5.3 tn in Q3’2020 driven by an 8.5% increase in gross loans to Kshs 3.2 tn in Q3’2021, from Kshs 2.9 tn in Q3’2020. Quarterly, the balance sheet grew by 2.5% to Kshs 5.8 tn in September 2021, from Kshs 5.7 tn in June 2021,
- Asset quality in the banking sector improved, with the Gross NPL ratio declining to 13.60% in Q3’2021, from 13.64% recorded in Q3’2020 and 14.0% recorded in June 2021. The improvement in asset quality during the quarter is attributable to a higher increase of 2.7% in gross loans in Q3’2021 compared to an increase of 0.1% recorded by non-performing loans in Q3’2021,
- The capital adequacy remained favorable with the ratio increasing to 18.8% in September 2021, from 18.2% recorded in September 2020. However, capital adequacy marginally decreased to 18.8% in September 2021, from 18.9% in June 2021. The q/q performance was attributable to higher increase in the total risk weighted assets of 2.3%, compared to 1.5% increase in total capital during the quarter, bringing the capital adequacy ratio to 18.8%, 4.4% points above the minimum statutory limit of 14.5%,
- IFRS 9 implementation had an adverse effect on the banking sector’s capital adequacy as a result of increased provisioning due to the challenging business environment. Commercial banks have had to provide provisions for both incurred and expected credit losses, and,
- Average liquidity in the banking sector increased to 56.7% in September 2021, from 53.3% in September 2020. Quarterly, however, liquidity marginally decreased to 56.7% in September 2021 from 56.8% in June 2021. This was 36.7% points above the minimum statutory ratio of 20.0%.
Credit risk is expected to decline due to an improved business environment following the gradual reopening of the economy on the back of the easing of COVID-19 restrictions and increased vaccination rollout. This is evidenced by the commercial banks’ reduced loan loss provisioning, as highlighted in our H1’2021 Banking report. The Kenyan Banking sector has showcased robust recovery efforts which have been boosted by an expansion in the loan book and diversification of income which has grown the banks’ bottom lines. The strong performance evidenced by the increased profits in Q3’2021 is expected to continue but may face risks such as increased cybersecurity threats emanating from the shift to digital banking. Credit risk still remains a concern given the discovery of new strains of the COVID-19 which could lead to reduced economic activity in the medium term.
Earnings Releases
During the week, KCB Group, Standard Chartered Bank and Co-operative Bank released their Q3’2021 financial results. Below is a summary of their performance;
- KCB Group
|
KCB Group Q3’2021 Key Highlights |
||||||
|
Balance Sheet |
||||||
|
Balance Sheet Items |
Q3’2020 (Kshs bn) |
Q3’2021 (Kshs bn) |
y/y change |
|||
|
Net Loans and Advances |
577.5 |
651.8 |
12.9% |
|||
|
Government Securities |
236.2 |
252.4 |
6.9% |
|||
|
Total Assets |
972.0 |
1,122.5 |
15.5% |
|||
|
Customer Deposits |
772.7 |
859.1 |
11.2% |
|||
|
Deposits per Branch |
2.2 |
1.8 |
(18.5%) |
|||
|
Total Liabilities |
836.1 |
958.1 |
14.6% |
|||
|
Shareholders’ Funds |
135.9 |
163.0 |
19.9% |
|||
|
Income Statement |
||||||
|
Income Statement Items |
Q3’2020 (Kshs bn) |
Q3’2021 (Kshs bn) |
y/y change |
|||
|
Net Interest Income |
47.9 |
56.4 |
17.9% |
|||
|
Net non-Interest Income |
21.3 |
23.5 |
10.3% |
|||
|
Total Operating income |
69.1 |
79.9 |
15.6% |
|||
|
Loan Loss provision |
(20.0) |
(9.3) |
(53.4%) |
|||
|
Total Operating expenses |
(52.0) |
(44.1) |
(15.2%) |
|||
|
Profit before tax |
17.1 |
35.8 |
108.9% |
|||
|
Profit after tax |
10.9 |
25.2 |
131.4% |
|||
|
Core EPS |
3.4 |
7.8 |
131.4% |
|||
|
Key Ratios |
||||||
|
Income Statement Ratios |
Q3’2020 |
Q3’2021 |
% point change |
|||
|
Yield from interest-earning assets |
11.4% |
10.9% |
(0.5%) |
|||
|
Cost of funding |
2.9% |
2.6% |
(0.3%) |
|||
|
Net Interest Margin |
8.7% |
8.4% |
(0.3%) |
|||
|
Non-Performing Loans (NPL) Ratio |
15.3% |
13.7% |
(1.6%) |
|||
|
NPL Coverage |
58.5% |
63.4% |
4.9% |
|||
|
Cost to Income With LLP |
75.2% |
55.2% |
20.0% |
|||
|
Loan to Deposit Ratio |
74.7% |
75.9% |
1.2% |
|||
|
Cost to Income Without LLP |
46.3% |
43.5% |
(2.8%) |
|||
|
Return on average equity |
13.1% |
22.7% |
9.6% |
|||
|
Return on average assets |
1.9% |
3.2% |
1.3% |
|||
|
Equity to Assets |
14.8% |
14.3% |
(0.5%) |
|||
|
Capital Adequacy Ratios |
||||||
|
Ratios |
Q3’2020 |
Q3’2021 |
% point change |
|||
|
Core Capital/Total Liabilities |
17.3% |
17.0% |
(0.3%) |
|||
|
Minimum Statutory ratio |
8.0% |
8.0% |
0.0% |
|||
|
Excess |
9.3% |
9.0% |
(0.3%) |
|||
|
Core Capital/Total Risk Weighted Assets |
17.8% |
17.3% |
(0.5%) |
|||
|
Minimum Statutory ratio |
10.5% |
10.5% |
0.0% |
|||
|
Excess |
7.3% |
6.8% |
(0.5%) |
|||
|
Total Capital/Total Risk Weighted Assets |
19.6% |
20.6% |
1.0% |
|||
|
Minimum Statutory ratio |
14.5% |
14.5% |
0.0% |
|||
|
Excess |
5.1% |
6.1% |
1.0% |
|||
Key take-outs from the earnings release include;
- Core earnings per share rose by 131.4% to Kshs 7.8, from Kshs 3.4 in Q3’2020, in line with our projections of a 130.6% increase to Kshs 7.8. The performance was driven by a 15.6% growth in total operating income to Kshs 79.9 bn, from Kshs 69.1 bn in Q3’2020, and a 15.2% decline in total operating expenses to Kshs 44.1 bn, from Kshs 52.0 bn in Q3’2020. Notably, Loan Loss Provisions declined by 53.4% to Kshs 9.3 bn, from Kshs 20.0 bn in Q3’2020 attributable to the declining credit risk in the market on the back of increased business activities in 2021 driven by the gradual economic recovery,
- Interest income grew by 16.2% to Kshs 73.5 bn, from Kshs 63.3 bn in Q3’2020, mainly driven by a 16.8% increase in interest income from loans and advances to Kshs 53.4 bn, from Kshs 45.8 bn in Q3’2020, coupled with a 12.4% increase in interest income from government securities to Kshs 18.9 bn, from Kshs 16.8 bn in Q3’2020,
- The Yield on Interest-Earning Assets declined to 10.9%, from 11.4% recorded in Q3’2020, attributable to the faster 20.4% growth in Average Interest Earning Assets, which outpaced the 14.9% growth in trailing interest income,
- Interest expense rose by 10.8% to Kshs 17.1 bn, from Kshs 15.4 bn in Q3’2020, following a 69.1% rise in Interest expense on deposits and placements to Kshs 2.4 bn, from Kshs 1.4 bn in Q3’2020, coupled with a 4.8% increase in interest expense on customer deposits to Kshs 14.7 bn, from Kshs 14.0 bn in Q3’2020. Cost of funds, on the other hand, declined marginally by 0.3% points to 2.6%, from 2.9% recorded in Q3’2020, following a faster 13.4% increase in average interest bearing liabilities, which outpaced the 7.7% increase in trailing interest expense,
- Net Interest Margin (NIM) declined to 8.4%, from 8.7% in Q3’2020 due to the faster 20.4% growth in average interest-earning assets, which outpaced the 17.1% increase in trailing Net Interest Income,
- Total operating expenses decreased by 15.2% to Kshs 44.1 bn, from Kshs 52.0 bn in Q3’2020, largely driven by a 53.4% decline in Loan Loss Provisions (LLP) to Kshs 9.3 bn, from Kshs 20.0 bn in Q3’2020. The reduced provision level was due to declining credit risk on the back of increased business activities in 2021 driven by the gradual economic recovery. Staff costs increased by 22.0% to Kshs 18.6 bn, from Kshs 15.2 bn in Q3’2020,
- The balance sheet recorded an expansion as total assets grew by 15.5% to Kshs 1,122.5 bn, from Kshs 972.0 bn in Q3’2020. The growth was supported by a 12.9% loan book expansion to Kshs 651.8 bn, from Kshs 577.5 bn in Q3’2020, coupled with a 6.9% increase in government securities to Kshs 252.4 bn, from Kshs 236.2 bn in Q3’2020. The significant expansion in the balance sheet is also partly attributable to the acquisition of Banque Populaire du Rwanda (BPR) in August 2021. BPR Rwanda contributed Kshs 45.0 bn worth of assets in Q3’2021 to the Group,
- Total liabilities rose by 14.6% to Kshs 958.1 bn, from Kshs 836.1 bn in Q3’2020, driven by a 60.3% increase in placements due to other banking institutions to Kshs 26.6 bn, from Kshs 16.6 bn in Q3’2020. Customer deposits increased as well by 11.2% to Kshs 859.1 bn, from Kshs 772.7 bn, with customer deposits from NBK amounting to Kshs 115.4 bn in Q3’2021,
- Deposits per branch decreased by 18.5% to Kshs 1.8 bn, from Kshs 2.2 bn in Q3’2020, with the number of branches increasing to 491, from 360 in Q3’2020. The group acquired 137 branches in Rwanda following the acquisition of BPR Rwanda during the period, in addition to opening 1 branch in South Sudan. The group however closed 2 branches in Uganda and 5 branches in Kenya during the period,
- Gross non-performing loans increased by 1.2% to Kshs 98.1 bn, from Kshs 97.0 bn in Q3’2020. The groups Asset Quality improved, with the NPL ratio declining to 13.7% in Q3’2021, from 15.3% in Q3’2020, attributable to the faster 12.9% growth in loans, which outpaced the 1.2% growth in Non-Performing Loans. The rise in gross non-performing loans was mainly attributable to the poor performance from the corporate segment, mortgage segment, MSME segment, and Check-Off loans which recorded NPL ratios of 17.9%, 10.7%, 9.1% and 2.8%, respectively,
- Loan Loss Provisions (LLP) decreased 53.4% y/y to Kshs 9.3 bn in Q3’2021, from Kshs 20.0 bn in Q3’2020. The NPL coverage improved to 63.4% in Q3’2021, from 58.5% in Q3’2020, as general Loan Loss Provisions increased by 14.1% to Kshs 50.1 bn, from Kshs 43.9 bn in Q3’2020, and,
- KCB Group remains sufficiently capitalized with a core capital to risk-weighted assets ratio of 17.3%, 6.8% points above the statutory requirement. In addition, the total capital to risk-weighted assets ratio came in at 20.6%, exceeding the statutory requirement by 6.1% points. Adjusting for IFRS 9, the core capital to risk-weighted assets stood at 17.4%, while total capital to risk-weighted assets came in at 20.7%.
For a comprehensive analysis, please see our KCB Group Q3’2021 Earnings Note.
- Standard Chartered Bank
|
Standard Chartered Bank Q3’2021 Key Highlights |
|||
|
Balance Sheet |
|||
|
Balance Sheet items |
Q3’2020 (Kshs bn) |
Q3’2021 (Kshs bn) |
y/y change |
|
Government Securities |
106.2 |
99.0 |
(6.8%) |
|
Net Loans and Advances |
131.7 |
131.7 |
0.1% |
|
Total Assets |
314.4 |
330.7 |
5.2% |
|
Customer Deposits |
242.8 |
258.4 |
6.4% |
|
Deposits Per Branch |
6.7 |
7.2 |
6.4% |
|
Total Liabilities |
264.2 |
277.6 |
5.1% |
|
Shareholders’ Funds |
50.2 |
53.1 |
5.8% |
|
Income Statement |
|||
|
Income Statement Items |
Q3’2020 (Kshs bn) |
Q3’2021 (Kshs bn) |
y/y change |
|
Net Interest Income |
14.3 |
14.7 |
2.8% |
|
Net non-Interest Income |
6.3 |
7.6 |
19.1% |
|
Total Operating income |
20.7 |
22.3 |
7.8% |
|
Loan Loss provision |
2.73 |
2.68 |
(1.6%) |
|
Total Operating expenses |
14.1 |
13.4 |
(5.1%) |
|
Profit before tax |
6.6 |
8.9 |
35.5% |
|
Profit after tax |
4.3 |
6.4 |
46.7% |
|
Core EPS |
12.6 |
16.9 |
33.7% |
|
Key Ratios |
|||
|
Ratios |
Q3’2020 |
Q3’2021 |
% point change |
|
Yield from interest-earning assets |
8.9% |
8.0% |
(0.9%) |
|
Cost of funding |
2.1% |
1.5% |
(0.6%) |
|
Net Interest Margin |
7.0% |
6.7% |
(0.3%) |
|
Non-Performing Loans (NPL) Ratio |
14.8% |
15.3% |
0.5% |
|
NPL Coverage |
78.2% |
82.8% |
4.6% |
|
Cost to Income with LLP |
68.2% |
60.1% |
(8.1%) |
|
Loan to Deposit Ratio |
54.2% |
51.0% |
(3.2%) |
|
Return on Average Assets |
2.1% |
2.3% |
0.2% |
|
Return on Average Equity |
12.9% |
14.5% |
1.6% |
|
Equity to Assets |
16.2% |
16.0% |
(0.2%) |
|
Capital Adequacy Ratios |
|||
|
Ratios |
Q3’2020 |
Q3’2021 |
% point change |
|
Core Capital/Total Liabilities |
16.7% |
16.2% |
(0.5%) |
|
Minimum Statutory ratio |
8.0% |
8.0% |
0.0% |
|
Excess |
8.7% |
8.2% |
(0.5%) |
|
Core Capital/Total Risk Weighted Assets |
16.1% |
15.6% |
(0.5%) |
|
Minimum Statutory ratio |
10.5% |
10.5% |
0.0% |
|
Excess |
5.6% |
5.1% |
(0.5%) |
|
Total Capital/Total Risk Weighted Assets |
18.7% |
17.7% |
(1.0%) |
|
Minimum Statutory ratio |
14.5% |
14.5% |
0.0% |
|
Excess |
4.2% |
3.2% |
(1.0%) |
Key take-outs from the earnings release include;
- Core earnings per share increased by 33.7% to Kshs 16.9, from Kshs 12.6 recorded in Q3’2020 driven by a 7.8% increase in total operating income to Kshs 22.3 bn, from Kshs 20.7 bn recorded in Q3’2020, coupled with a 5.1% decline in total operating expenses to Kshs 13.4 bn, from Kshs 14.1 bn recorded in Q3’2020,
- Interest income declined by 2.5% to Kshs 17.5 bn, from Kshs 19.9 bn in Q3’2020, driven by a 4.0% decline in interest income from government securities to Kshs 6.9 bn, from Kshs 7.2 bn in Q3’2020. The decline in interest income was however mitigated by a 1.6% growth in interest income from loans and advances to Kshs 9.5 bn, from Kshs 9.4 bn in Q3’2020,
- The Yield on Interest-Earning Assets (YIEA), declined by 0.9% points to 8.0%, from 8.9% in Q3’2020, attributable to the faster 7.6% growth in the average interest earning assets, which outpaced the 3.6% decline in the trailing interest income. Trailing Interest Income refers to the performance of the interest income for the past 12 consecutive months,
- Interest expense declined by 23.3% to Kshs 2.8 bn, from Kshs 3.6 bn in Q3’2020, following a 25.6% decline in interest expense on customer deposits to Kshs 2.5 bn, from Kshs 3.3 bn in Q3’2020. The decline was however weighed down by a 12.6% increase in interest expenses on deposits and placements with banking institutions to Kshs 57.2 mn, from Kshs 50.8 mn in Q3’2020. Cost of funds, on the other hand, declined by 0.6% points to 1.5%, from 2.1% in Q3’2020, owing to a 7.6% growth in average interest-bearing liabilities which outpaced the 25.2% decline in the trailing interest expense. Trailing interest expense refers to the performance of the interest expense for the past 12 consecutive months,
- Net Interest Margin (NIM) declined to 6.7%, from 7.0% in Q3’2020 attributable to a faster 7.6% growth in average interest-earning assets, which outpaced the 2.1% increase in the trailing Net Interest Income (NII),
- Total operating expenses declined by 5.1% to Kshs 13.4 bn in Q3’2021, from Kshs 14.1 bn in Q3’2020, mainly attributable to a 10.2% decline in Staff Costs to Kshs 4.9 bn, from Kshs 5.4 bn recorded in Q3’2020. Additionally, Loan Loss Provisions (LLPs) declined by 1.6% to Kshs 2.68 bn in Q3’2021, from Kshs 2.73 bn in Q3’2020 partly attributable to the improved business environment,
- The balance sheet recorded an expansion as total assets grew by 5.2% to Kshs 330.7 bn in Q3’2021, from Kshs 314.4 bn in Q3’2020. This growth was largely driven by a 48.8% increase in placements from banking institutions to Kshs 69.3 bn, from Kshs 46.6 bn in Q3’2020, coupled with a 0.1% increase in the loan book to Kshs 131.74 bn, from Kshs 131.65 bn recorded in Q3’2020. The performance was however weighed down by a 6.8% decline in investments in government and other securities to Kshs 99.0 bn, from Kshs 106.2 bn recorded in Q3’2020,
- Total liabilities rose by 5.1% to Kshs 277.6 bn, from Kshs 264.2 bn in Q3’2020 driven by a 38.0% increase in Placements held to Kshs 2.8 bn in Q3’2021, from Kshs 2.0 bn in Q3’2020. Customer deposits increased by 6.4% to Kshs 258.4 bn, from Kshs 242.8 bn in Q3’2020,
- Deposits per branch rose by 6.4% to Kshs 7.2 bn, from Kshs 6.7 bn in Q3’2020 with the number of branches remaining unchanged at 36,
- Gross Non-Performing Loans (NPLs) increased by 4.8% to Kshs 23.0 bn in Q3’2021, from Kshs 22.0 bn recorded in Q3’2020. Consequently, the NPL ratio rose to 15.3%, from 14.8% recorded in Q3’2020. The Asset Quality deterioration is attributable to the faster 4.8% growth in Gross Non-Performing Loans (NPLs), compared to the relatively slower 1.3% increase in gross loans,
- General Loan Loss Provisions increased by 16.8% to Kshs 9.8 bn, from Kshs 8.4 bn in Q3’2020. The NPL coverage thus increased to 82.8%, from 78.2% in Q3’2020, as the provisions (after adding back interest suspense) increased by 10.9% in Q3’2021, outpacing the 4.8% rise in the Gross Non-Performing Loans during the same period. The increase in the NPL Coverage to 82.8% in Q3’2021, from 78.2% in Q3’2020, suggests sufficient provisioning, and,
- Standard Chartered is currently sufficiently capitalized with a core capital to risk-weighted assets ratio of 15.6%, 5.1% points above the statutory requirement. In addition, the total capital to risk-weighted assets ratio was 17.7%, exceeding the statutory requirement by 3.2% points. Adjusting for IFRS 9, the core capital to risk-weighted assets stood at 15.6% while total capital to risk-weighted assets came in at 17.7%.
For a comprehensive analysis, please see our SCBK Q3’2021 Earnings Note.
- Co-operative Bank of Kenya
|
Co-operative Bank Q3’2021 Key Highlights |
|||
|
Balance Sheet |
|||
|
Balance Sheet Items |
Q3’2020 (Kshs bn) |
Q3’2021 (Kshs bn) |
y/y change |
|
Government Securities |
142.3 |
193.3 |
35.9% |
|
Net Loans and Advances |
284.2 |
306.3 |
7.8% |
|
Total Assets |
510.9 |
592.9 |
16.0% |
|
Customer Deposits |
375.5 |
420.4 |
12.0% |
|
Deposits per branch |
2.36 |
2.38 |
0.6% |
|
Total Liabilities |
427.3 |
497.5 |
16.4% |
|
Shareholders’ Funds |
82.0 |
95.0 |
15.9% |
|
Income Statement |
|||
|
Income Statement Items |
Q3’2020 (Kshs bn) |
Q3’2021 (Kshs bn) |
y/y change |
|
Net Interest Income |
23.6 |
28.7 |
21.3% |
|
Net non-Interest Income |
13.6 |
15.7 |
15.6% |
|
Total Operating income |
37.2 |
44.4 |
19.2% |
|
Loan Loss provision |
(4.0) |
(6.0) |
50.3% |
|
Total Operating expenses |
(23.5) |
(28.0) |
19.2% |
|
Profit before tax |
13.8 |
16.5 |
19.2% |
|
Profit after tax |
9.9 |
11.6 |
18.0% |
|
Core EPS |
1.4 |
1.7 |
18.0% |
|
Key Ratios |
|||
|
Income statement ratios |
Q3’2020 |
Q3’2021 |
% point change |
|
Yield from interest-earning assets |
10.9% |
11.5% |
0.6% |
|
Cost of funding |
2.2% |
2.4% |
0.2% |
|
Net Interest Margin |
8.0% |
8.5% |
0.5% |
|
Non-Performing Loans (NPL) Ratio |
13.2% |
14.6% |
1.4% |
|
NPL Coverage |
50.1% |
65.5% |
15.4% |
|
Cost to Income With LLP |
63.0% |
63.0% |
0.0% |
|
Loan to Deposit Ratio |
75.7% |
72.9% |
(2.8%) |
|
Cost to Income Without LLP |
52.2% |
49.4% |
(2.8%) |
|
Return on average equity |
16.5% |
14.2% |
(2.3%) |
|
Return on average assets |
2.8% |
2.3% |
(0.5%) |
|
Equity to assets |
17.0% |
16.0% |
(1.0%) |
|
Capital Adequacy Ratios |
Q3’2020 |
Q3’2021 |
% point change |
|
Core Capital/Total Liabilities |
19.0% |
18.0% |
(1.0%) |
|
Minimum Statutory ratio |
8.0% |
8.0% |
0.0% |
|
Excess |
11.0% |
10.0% |
(1.0%) |
|
Core Capital/Total Risk Weighted Assets |
16.3% |
15.0% |
(1.3%) |
|
Minimum Statutory ratio |
10.5% |
10.5% |
0.0% |
|
Excess |
5.8% |
4.5% |
(1.3%) |
|
Total Capital/Total Risk Weighted Assets |
16.8% |
16.5% |
(0.3%) |
|
Minimum Statutory ratio |
14.5% |
14.5% |
0.0% |
|
Excess |
2.3% |
2.0% |
(0.3%) |
Key take-outs from the earnings release include;
- Core earnings per share increased by 18.0% to Kshs 1.7 in Q3’2021, from Kshs 1.4 in Q3’2020, not in line with our projections of a 12.4% increase to Kshs 1.6. The performance was driven by a 19.2% increase in total operating income to Kshs 44.4 bn in Q3’2021, from Kshs 37.2 bn in Q3’2020, despite a similar increase of 19.2% in the total operating expenses to Kshs 28.0 bn in Q3’2021, from Kshs 23.5 bn in Q3’2020,
- Interest income rose by 21.6% to Kshs 39.6 bn in Q3’2021, from Kshs 32.6 bn in Q3’2020 driven by a 40.3% increase in interest income from government securities to Kshs 13.8 bn, from Kshs 9.8 bn in Q3’2020, coupled with a 14.0% rise in interest income from loans and advances to Kshs 25.4 bn, from Kshs 22.3 bn in Q3’2020. This growth was however weighed down by a 24.1% decline in interest income from deposits with other financial institutions to Kshs 0.3 bn in Q3’2021, from Kshs 0.4 bn in Q3’2020,
- The Yield on Interest-Earning Assets (YIEA) increased to 11.5%, from 10.9% in Q3’2020 due to the faster 22.0% growth in trailing interest income, which outpaced the 15.5% growth in the average interest-earning assets,
- Interest expense increased by 22.4% to Kshs 10.9 bn in Q3’2021, from Kshs 8.9 bn in Q3’2020, largely due to a 26.7% rise in interest expense from customer deposits to Kshs 9.8 bn, from Kshs 7.8 bn in Q3’2020. This was however mitigated by a 7.6% decline in other interest expenses to Kshs 1.0 bn in Q3’2021, from Kshs 1.1 bn in Q3’2020. As such, Cost of Funds increased to 3.3%, from 3.2% in Q3’2020, owing to the faster 20.6% increase in trailing interest expense, compared to the 15.0% rise in the average interest-bearing liabilities,
- Net Interest Margin (NIM) increased to 8.5%, from 8.0% in Q3’2020, attributable to the 22.5% growth of trailing Net Interest Income (NII), which outpaced the 15.5% growth in average interest-earning assets,
- Total operating expenses rose by 19.2% to Kshs 28.0 bn in Q3’2021, from Kshs 23.5 bn in Q3’2020, largely driven by the 50.3% rise in Loan Loss Provisions (LLP) to Kshs 6.0 bn, from Kshs 4.0 bn in Q3’2020. The increased provisioning level is mainly attributable to the lender increasing its coverage for the high Non-Performing Loans from Kingdom Bank, which stood at Kshs 6.4 bn as of Q3’2021. On the other hand, Staff costs increased by 3.6% to Kshs 10.0 bn, from Kshs 9.7 bn in Q3’2020,
- The balance sheet recorded an expansion as total assets grew by 16.0% to Kshs 592.9 bn in Q3’2021, from Kshs 510.9 bn in Q3’2020, mainly attributable to the 35.9% growth in government securities to Kshs 193.3 bn, from Kshs 142.3 bn, coupled with a 7.8% growth in net loans and advances to Kshs 306.3 bn in Q3’2021, from Kshs 284.2 n in Q3’2020. The increase in allocation to government securities shows the bank’s cautious lending strategy considering the deteriorating asset quality, as evidenced by the bank’s NPL ratio rising to 14.6% in Q3’2021 from 13.2% in Q3’2020,
- Total liabilities grew by 16.4% to Kshs 497.5 bn, from Kshs 427.3 bn in Q3’2020, which was largely attributable to a 12.0% rise in customer deposits to Kshs 420.4 bn in Q3’2021, from Kshs 375.5 bn in Q3’2020,
- Deposits per branch increased by 0.6% to Kshs 2.38 bn, from Kshs 2.36 bn in Q3’2020, as the number of branches increased by 18 branches to 177 from 159 branches in Q3’2020, as a result of the acquisition of Kingdom Bank which contributed 17 branches to the total branch count,
- Gross Non-Performing Loans (NPLs) increased by 23.2% to Kshs 49.5 bn in Q3’2021, from Kshs 40.2 bn in Q3’2020. The NPL ratio rose to 14.6% in Q3’2021, from 13.2% in Q3’2020, owing to the faster 23.2% growth in gross non-performing loans compared to the 11.3% growth in gross loans,
- The NPL coverage ratio consequently improved to 65.5% in Q3’2021, from 50.1% in Q3’2020, due to the faster 81.1% growth in General Loan Loss Provisions which outpaced the 23.2% growth in Gross Non-Performing Loans (NPLs), and,
- Co-operative Bank remains sufficiently capitalized with a core capital to risk-weighted assets ratio of 15.0%, 4.5% points above the statutory requirement of 10.5%. Also, the total capital to risk-weighted assets ratio came in at 16.5%, exceeding the statutory requirement of 14.5% by 2.0% points. Adjusting for IFRS 9, the core capital to risk-weighted assets stood at 12.5%, while total capital to risk-weighted assets came in at 14.0%.
For a comprehensive analysis, please see our Co-operative Bank Q3’2021 Earnings Note.
Asset Quality
The table below is a summary of the asset quality for the companies that have released
|
|
Q3'2020 NPL Ratio** |
Q3'2021 NPL Ratio* |
Q3'2020 NPL Coverage** |
Q3'2021 NPL Coverage* |
% point change in NPL Ratio |
% point change in NPL Coverage |
|
Standard Chartered Bank Kenya |
14.8% |
15.3% |
78.2% |
82.8% |
0.5% |
4.6% |
|
Co-operative Bank of Kenya |
13.2% |
14.6% |
50.1% |
65.5% |
1.4% |
15.4% |
|
KCB |
15.3% |
13.7% |
58.5% |
63.4% |
(1.6%) |
4.9% |
|
Equity Group |
10.8% |
9.5% |
52.0% |
60.6% |
(1.3%) |
8.6% |
|
Mkt Weighted Average |
12.4% |
12.2% |
59.2% |
64.6% |
(0.2%) |
5.4% |
|
*Market cap weighted as at 19/11/2021 |
||||||
|
**Market cap weighted as at 01/12/2020 |
||||||
Key take-outs from the table include;
- Asset quality for the listed banks that have released improved during the period, with the weighted average NPL ratio declining marginally by 0.2% points to a market cap weighted average of 12.2%, from an average of 12.4% for the listed banking sector in Q3’2020. The improvement in asset quality is attributable to declining credit risk on the back of increased business activities in 2021 driven by the gradual economic recovery, and,
- NPL Coverage for the listed banks increased to a market cap weighted average of 64.6% in Q3’2021, from 59.2% recorded in Q3’2020, as the banks increased their provisioning levels.
Summary Performance
The table below highlights the performance of the banks that have released so far, showing the performance using several metrics, and the key take-outs of the performance;
|
Bank |
Core EPS Growth |
Interest Income Growth |
Interest Expense Growth |
Net Interest Income Growth |
Net Interest Margin |
Non-Funded Income Growth |
NFI to Total Operating Income |
Growth in Total Fees & Commissions |
Deposit Growth |
Growth in Government Securities |
Loan to Deposit Ratio |
Loan Growth |
Return on Average Equity |
|
KCB |
131.4% |
16.2% |
10.8% |
17.9% |
8.4% |
10.3% |
29.4% |
1.2% |
11.2% |
6.9% |
75.9% |
12.9% |
22.7% |
|
Equity Group |
78.6% |
28.7% |
45.0% |
23.3% |
7.0% |
28.8% |
39.7% |
34.2% |
26.6% |
25.8% |
63.9% |
23.2% |
22.2% |
|
SCBK |
33.7% |
(2.5%) |
(23.3%) |
2.8% |
6.7% |
19.1% |
33.9% |
17.9% |
6.4% |
(6.8%) |
51.0% |
0.1% |
14.5% |
|
CO-OP |
18.0% |
21.6% |
22.4% |
21.3% |
8.5% |
15.6% |
35.4% |
9.4% |
12.0% |
35.9% |
72.9% |
7.8% |
14.2% |
|
Q3'21 Mkt Weighted Average* |
81.3% |
20.4% |
23.5% |
19.1% |
7.6% |
19.9% |
35.2% |
18.2% |
17.3% |
18.0% |
67.8% |
15.1% |
20.3% |
|
Q3'20 Mkt Weighted Average** |
(32.4%) |
10.8% |
8.2% |
11.7% |
7.0% |
2.1% |
35.9% |
(7.9%) |
23.1% |
47.4% |
65.6% |
15.0% |
13.0% |
|
*Market cap weighted as at 19/11/2021 |
|||||||||||||
|
**Market cap weighted as at 01/12/2020 |
|||||||||||||
Key takeaways from the table above include:
- The listed banks that have released recorded an 81.3% weighted average growth in core Earnings per Share (EPS), compared to a weighted average decline of 32.4% in Q3’2020 for the listed banking sector. The performance is however largely skewed by the strong performance from KCB and Equity Group,
- The Banks have recorded a weighted average deposit growth of 17.3%, slower than the 23.1% growth recorded in Q3’2020,
- Interest expense grew at a faster pace, by 23.5%, compared to the 8.2% growth in Q3’2020, while cost of funds declined, coming in at a weighted average of 2.5% in Q3’2021, from 2.9% in Q3’2020, owing to the faster growth in average interest-bearing liabilities, an indication that the listed banks were able to mobilize cheaper deposits,
- Average loan growth came in at 15.1%, marginally higher than the 15.0% growth recorded in Q3’2020. The loan growth was however slower than the 18.0% growth in government securities, an indication of the banks continued preference to investing in Government securities compared to lending to individuals and businesses,
- Interest income grew by 20.4%, compared to a growth of 10.8% recorded in Q3’2020. Notably, the weighted average Yield on Interest Earning Assets (YIEA) for the four banks increased to 10.1%, from the 9.5% recorded in Q3’2020 for the listed banking sector, an indication of the increased allocation to higher-yielding assets by the sector during the period. Consequently, the Net Interest Margin (NIM) now stands at 7.6%, 0.6% points higher than the 7.0% recorded in Q3’2020 for the whole listed banking sector, and,
- Non-Funded Income grew by 19.9%, compared to the 2.1% growth recorded in Q3’2020. This can be attributable to the faster growth in the fees and commission which grew by 18.2% compared to a decline of 7.9% in Q3’2020, following the expiry of the waiver on fees on mobile transactions.
Universe of Coverage
|
Company |
Price as at 12/11/2021 |
Price as at 19/11/2021 |
w/w change |
YTD Change |
Year Open 2021 |
Target Price* |
Dividend Yield |
Upside/ Downside** |
P/TBv Multiple |
Recommendation |
|
I&M Group*** |
22.0 |
21.5 |
(2.3%) |
(52.2%) |
44.9 |
32.0 |
10.5% |
59.7% |
0.6x |
Buy |
|
Kenya Reinsurance |
2.3 |
2.3 |
(2.6%) |
(1.7%) |
2.3 |
3.3 |
8.8% |
54.9% |
0.2x |
Buy |
|
NCBA*** |
24.0 |
23.8 |
(0.8%) |
(10.7%) |
26.6 |
31.0 |
6.3% |
36.8% |
0.6x |
Buy |
|
ABSA Bank*** |
10.2 |
10.5 |
2.9% |
10.3% |
9.5 |
13.8 |
0.0% |
31.4% |
1.1x |
Buy |
|
Co-op Bank*** |
12.6 |
12.3 |
(2.0%) |
(2.0%) |
12.6 |
14.1 |
8.1% |
22.8% |
0.9x |
Buy |
|
Standard Chartered*** |
130.5 |
128.8 |
(1.3%) |
(10.9%) |
144.5 |
145.4 |
8.2% |
21.1% |
1.0x |
Buy |
|
KCB Group*** |
44.5 |
45.9 |
3.1% |
19.5% |
38.4 |
53.4 |
2.2% |
18.5% |
0.9x |
Accumulate |
|
Diamond Trust Bank*** |
58.0 |
57.0 |
(1.7%) |
(25.7%) |
76.8 |
67.3 |
0.0% |
18.1% |
0.2x |
Accumulate |
|
Jubilee Holdings |
340.0 |
328.0 |
(3.5%) |
18.9% |
275.8 |
371.5 |
2.7% |
16.0% |
0.6x |
Accumulate |
|
Britam |
7.5 |
7.2 |
(3.5%) |
3.4% |
7.0 |
8.3 |
0.0% |
15.2% |
1.2x |
Accumulate |
|
Equity Group*** |
52.5 |
52.0 |
(1.0%) |
43.4% |
36.3 |
57.5 |
0.0% |
10.6% |
1.3x |
Accumulate |
|
Stanbic Holdings |
94.0 |
91.8 |
(2.4%) |
7.9% |
85.0 |
96.6 |
4.1% |
9.4% |
0.8x |
Hold |
|
Sanlam |
11.5 |
11.5 |
0.0% |
(11.5%) |
13.0 |
12.1 |
0.0% |
5.3% |
1.2x |
Hold |
|
Liberty Holdings |
7.0 |
7.5 |
6.3% |
(3.1%) |
7.7 |
7.8 |
0.0% |
4.2% |
0.6x |
Lighten |
|
CIC Group |
2.4 |
2.3 |
(3.8%) |
9.0% |
2.1 |
2.0 |
0.0% |
(11.1%) |
0.8x |
Sell |
|
HF Group |
4.2 |
4.9 |
18.1% |
56.1% |
3.1 |
3.1 |
0.0% |
(36.7%) |
0.2x |
Sell |
|
Target Price as per Cytonn Analyst estimates **Upside/ (Downside) is adjusted for Dividend Yield ***For Disclosure, these are stocks in which Cytonn and/or its affiliates are invested in Key to note, I&M Holdings YTD share price change is mainly attributable to the counter trading ex-bonus issue |
||||||||||
We are “Neutral” on the Equities markets in the short term. With the market currently trading at a premium to its future growth (PEG Ratio at 1.4x), we believe that investors should reposition towards companies with a strong earnings growth and are trading at discounts to their intrinsic value. We expect the discovery of new COVID-19 variants coupled with slow vaccine rollout in developing economies to continue weighing down the economic outlook. On the upside, we believe that the recent relaxation of lockdown measures in the country will lead to improved investor sentiments in the economy.
- Industry Reports
During the week, Hass Consult, a Real Estate Development and Consultancy firm, released the House Price Index Q3’2021, a report highlighting the performance of Real Estate Residential properties in the Nairobi Metropolitan Area (NMA) in Q3’2021. The key take outs are as outlined below;
- Overall, residential properties within the Nairobi Metropolitan Area recorded a 1.0% q/q price appreciation and a 1.1% y/y price correction. Rents remained relatively stable over the review period, experiencing a marginal 0.1% q/q increase,
- Detached units recorded the highest q/q price appreciation at 1.7% attributable to the high demand in Satellite Towns such as Ruiru, as the units tend to be on more spacious parcels than similar detached units within the Nairobi Suburbs. Apartments recorded a q/q price correction of 0.7%, attributable to huge price corrections in areas such as Westlands and Kileleshwa at 2.5% and 2.2%, respectively,
- In the Suburbs, residential properties in Langata recorded the highest q/q price appreciation at 2.1%, while Runda recorded the lowest q/q performance with a price correction of 1.3%. Langata still recorded the highest y/y price appreciation at 11.9% with a 1.9% decline in y/y rental returns, confirming the area as more of a buyer than a renter’s market. Donholm recorded the lowest y/y performance with a 3.6% price correction,
- In the Satellite Towns, residential properties in Ongata Rongai recorded the highest q/q price appreciation of 2.7% while Juja recorded the lowest performance with a q/q price correction of 2.1%. In terms of annual performance, Ruiru was the best performing node with a price appreciation of 7.7% while Juja recorded the lowest performance with a y/y price correction of 7.5%, and,
- Notably, property prices along the touchpoints of the Nairobi Express Way such as Mlolongo, Athi River and Syokimau recorded a q/q price appreciation of 1.9%, 1.8% and 0.1%, respectively. This indicates that buyers expect a rise in prices when the project is completed and opt to enter the market at the current lower prices.
This report is in line with our Cytonn Q3’2021 Markets Review Report, indicating that overall y/y property prices in the Nairobi Metropolitan Area improved by 0.8%. This performance is attributable to the gradual economic recovery, supported by the return to normalcy of general economic activities thereby increasing revenues and subsequent investments in Real Estate markets.
Hass Consult, also released the Land Price Index Q3’2021, a report highlighting the performance of the Land Sector in the Nairobi Metropolitan Area in Q3’2021. Key take outs from the report are;
- Overall, land prices in the Nairobi Metropolitan Area appreciated on a q/q and y/y basis by 0.3% and 0.8%, respectively. This is attributable to major infrastructure projects in the Nairobi Metropolitan Area such as the Nairobi Express Way and the Western Bypass, leading to increased demand for land along the touchpoints of the development projects,
- Satellite Towns continued to lead in average price appreciation posting a q/q and y/y price appreciation of 2.5% and 5.6%. Affordability and availability of land triggered the investors return to Satellite Towns at a faster rate than in the Suburbs. In this category, Kiserian recorded the highest q/q and y/y increase in land prices at 5.3% and 18.3%, respectively. Ruaka on the other hand, posted a q/q price correction of 0.2%, as developer demand declined with investors adopting a wait and see approach considering the current huge supply of units with others in the pipeline, and the expectations that infrastructure developments such as the Western Bypass may open up other areas for investment
- The Nairobi suburbs recorded a q/q and y/y price appreciation of 0.5% and 1.4%, respectively. In this category, Land in Spring Valley recorded the highest q/q price appreciation at 2.2% while land in Loresho recorded the lowest performance q/q, with a price correction of 1.3%. In terms of annual performance, land in Nyari recorded the highest y/y price appreciation at 7.2% while that in Riverside recorded the highest y/y price correction of 5.1%, and,
- Overall, Kilimani recorded the highest average land value per acre at Kshs 413.1 mn while Kiserian recorded the lowest average land value per acre at Kshs 8.7 mn per acre compared to a market average of Kshs 190.5 mn per acre in the Nairobi Metropolitan Area.
This report is in line with our Cytonn Q3’2021 Markets Review Report, indicating that overall land prices in the Nairobi Metropolitan Area appreciated by an average of 1.7% y/y, in Q3’2021. According to the report, land prices in the Satellite towns realized the highest capital appreciation at 4.5% as a result of availability, affordability and prospect for development. This performance reiterates the investor confidence in land as a stable investment asset class.
Additionally during the week, Knight Frank, a Real Estate Consultancy firm, released the Africa Office Market Dashboard Report- Q3’2021, a report highlighting the performance of commercial office sector in different African Cities for the Q3’2021. The key take outs from the report are as follows;
- Major cities in Africa recorded a 49.0% q/q increase in office demand in Q3’2021 attributable to rising levels of investment as investors moved to deploy capital amassed throughout the course of the pandemic,
- Lagos, Nigeria, recorded the highest rental rates at Kshs 7,011 (USD 62.5) per SQM attributable to a strong occupier demand majorly from the vibrant tech sector supported by the high Fintech start-ups,
- Harare, Zimbabwe recorded the lowest rental rates at Kshs 785 (USD 7.0) per SQM attributable to occupier flight to suburban offices from the CBD, with businesses keen on occupying high-quality, convenient and affordable space away from the City, and,
- Nairobi City recorded the highest q/q increase in office asking rents by 9.0% to Kshs 1,458 (USD 13.0), from Kshs 1,324 (USD 11.8) per SQM, leading to a 30.0% market share of the overall office requirements recorded across Africa during Q3’2021. This is attributable to the post-COVID economic expansion currently underway in Kenya coupled with a stable, but steady return of occupiers. This increase in demand has driven occupancy levels up by 3.0% points to 77.0% in Q3’2021, from 74.0% in Q2’2021.
The table below indicates the summary of the 10 cities with the highest rent rates in Africa – Q3’2021;
|
Summary of the 10 Cities with the Highest Rent Rates in Africa – Q3’2021 |
||
|
Rank |
City and Country |
Asking Rents (USD) per SQM |
|
1. |
Lagos, Nigeria |
62.5 |
|
2. |
Luanda, Angola |
50.0 |
|
3. |
Kinshasa, Congo |
35.0 |
|
4. |
Cairo, Egypt |
33.0 |
|
5. |
Abidjan, Cote D'Ivore |
32.5 |
|
6. |
Accra, Ghana |
30.0 |
|
7. |
Malabo, Equatorial Quinea |
30.0 |
|
8. |
Algiers, Algeria |
28.0 |
|
9. |
Maputo, Mozambique |
28.0 |
|
10. |
Douala, Congo |
27.0 |
Source: Knight Frank Report NB: 1 USD=Kshs 112.2 as at 19/11/2021
The table below indicates the summary of the 10 cities with the lowest office rent rates in Africa – Q3’2021;
|
Summary of the 10 Cities with the Lowest Rent Rates in Africa – Q3’2021 |
||
|
Rank |
City and Country |
Asking Rents (USD) per SQM |
|
1. |
Harare, Zimbabwe |
7.0 |
|
2. |
Blantyre, Malawi |
7.0 |
|
3. |
Tunis, Tunisia |
9.0 |
|
4. |
Antananarivo, Madagascar |
11.0 |
|
5. |
Gaborone, Botswana |
12.0 |
|
6. |
Lilongwe, Malawi |
12.0 |
|
7. |
Nairobi, Kenya |
13.0 |
|
8. |
Kampala, Uganda |
14.4 |
|
9. |
Dar Es Salaam, Tanzania |
15.0 |
|
10. |
Johannesburg, South Africa |
15.0 |
Source: Knight Frank Report NB: 1 USD= Kshs 112.2 as at 19/11/2021
We expect uptake of offices to increase marginally driven by the resumption of businesses activities following the reopening the economy. However, the sector’s performance is expected to be weighed down by the current oversupply of offices in the Nairobi Metropolitan Area market at 7.3 mn SQFT as at 2021, and, the adoption of online meetings and work from home as a continuing norm in most companies.
- Infrastructure Sector
During the week, Kenya Urban Roads Authority (KURA) announced the commencement of the conversion of the 32.0 Km Eastern Bypass into a dual carriage way at a cost of Kshs 12.5 bn. The road will be constructed by China Community Construction Company Limited and is expected to be completed by 2023. Upon completion, the road will link Mombasa Road to the Thika Superhighway through City Cabanas, Pipeline, Njiru, and Ruiru. The road is expected to:
- Ease traffic congestion along the busy Mombasa Road by linking motorists from the Jomo Kenyatta International Airport and Mombasa-Nairobi highway to Thika Superhighway without passing through the CBD,
- Boost Real Estate investment along the Satellite Towns touchpoints such as Utawala and Ruiru through enhanced investor and client accessibility,
- Strategically serve as a link point to the planned Kshs 500.0 bn Northlands City Project in Ruiru, and,
- Boost trade activities along the region due to increased population residing and transiting through the areas.
The government continues to show a lot of commitment for infrastructure development in the country with current major pipeline projects in the Nairobi Metropolitan Area being the Nairobi Express Way which is 68.0% complete, and the Western Bypass (the Bypass will connect the towns of Kikuyu and Ruaka). The government has borrowed both internally by issuing infrastructure bonds, and externally through loans from countries such as China and Korea in order to finance FY’2021/2022 infrastructure budget at Kshs 182.5 bn, a 0.6% increase from Kshs 181.4 bn allocation for FY’2020/2021. We therefore expect these projects to be done to completion and open up more areas for investments through enhanced accessibility.
The graph below shows the budget allocation to the infrastructure sector over the last nine financial years:
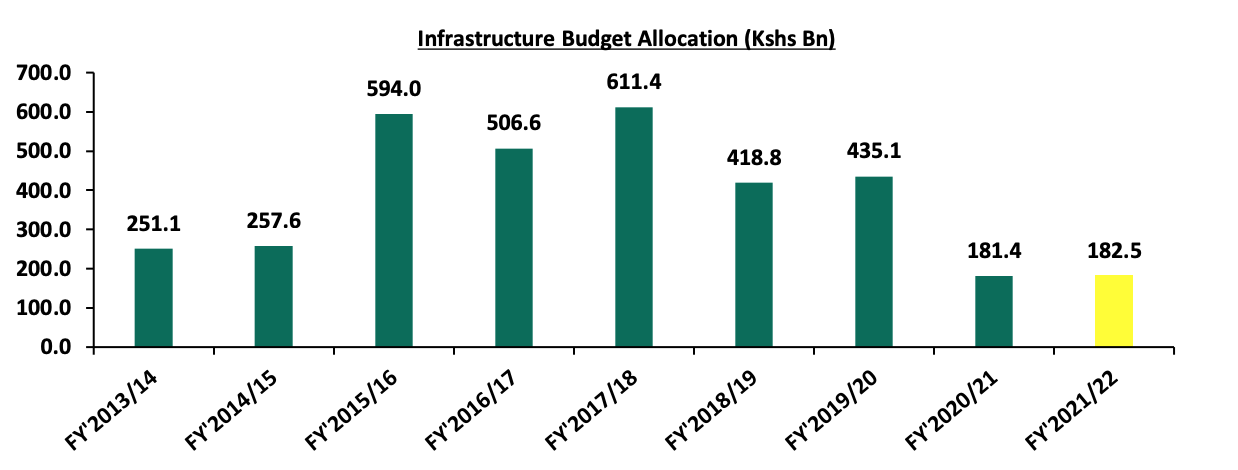
Source: National Treasury
The government’s continued focus on initiation and completion of infrastructure developments is expected to support the realization of the Vision 2030 Agenda on developing quality, safe and adequate roads to make Kenya an intra-regional hub for trade in East Africa.
- REIT Performance
During the week, Fahari I-REIT declined by 2.0% to close at Kshs 6.8 per share, from Kshs 7.0 per share recorded the previous week. On a YTD basis the REIT has gained by 21.3% from the Kshs 5.6 recorded at the beginning of the year. The REIT’s closing price also represented a 65.8% Inception to Date (ITD) loss in performance, from the listing price of Kshs 20.0 per share. Additionally, latest data from NSE Unquoted Securities Platform (USP) show that the Acorn DREIT closed the week at Kshs 20.2 while the I-REIT closed at Kshs 20.6 per unit, gaining by 0.9% and 3.1%, respectively, from the Kshs 20.0 Inception price. Volumes traded for D-REIT and the I-REIT were at 5.4 mn and 12.3 mn with a turnover of Kshs 108.9 mn and Kshs 254.1 mn, respectively.
The Kenyan REIT market continues to record subdued performance, forming a mere 0.04% of the total market cap compared to the REIT Market in South Africa at 1.6% of the total market capitalization. This is due to constraining by factors such as i) lack of general knowledge about the REIT market and products, ii) high minimum investment amounts set at Kshs 5.0 mn for the D-REIT which 100x the medium income at Kshs 50,000, iii) lengthy regulatory processes discouraging promoters, and, iv) few REIT Trustees currently at 3, due to the high minimum requirements at Kshs 100.0 mn. The graph below shows Fahari I-REIT’s performance from November 2015 to November 2021:
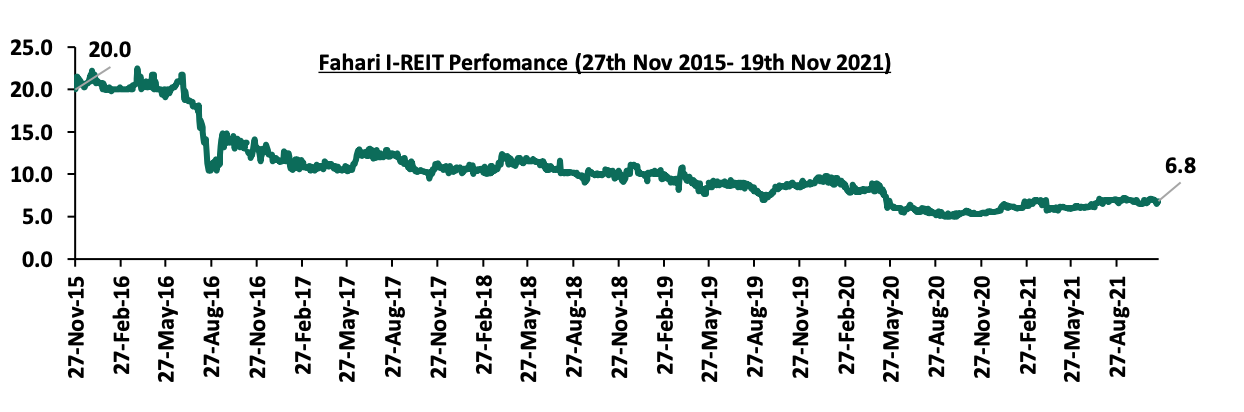
We expect the real estate sector to be supported by i) the reopening of the economy boosting property and commercial office prices as demand improves, ii) investor confidence in land as a stable investment, and, iii) the government’s continued support for infrastructure thus boosting investments through enhanced accessibility and sustainable transportation services. However, the subdued REIT performance is expected to constrain the performance of the sector.
In December 2020, we released the Nairobi Metropolitan Area Mixed-Use Developments (MUDs) Report-2020, which highlighted that Mixed-Use Developments (MUDs) recorded an average rental yield of 6.9%, 0.1% points higher than the respective single use Retail, Commercial Office and Residential themes with 6.8% in 2020. The relatively better performance by MUDs compared to single-use developments was attributed to the prime locations mostly serving the high and growing middle income class, coupled with the concept’s convenience that incorporates working, shopping and living spaces.
This week we update our report with the 2021 market research that was conducted in 7 nodes within the Nairobi Metropolitan Area (NMA), in order to determine the market performance of MUDs against the market performance of the Residential, Commercial Office and Retail sectors. Therefore, this topical will cover the following:
- Overview of Mixed-Use Developments
- Mixed-Use Developments Performance Summary in 2021
- Mixed-Use Developments Investment Opportunity and Outlook
Section I: Overview of Mixed-Use Developments
As a recap, a Mixed-Use Development (MUD) refers to an urban development that incorporates more than one Real Estate theme. This therefore means that a single development project will serve more than one purpose, that is, residential, commercial, retail, and, hospitality purposes, all at the same location. Due to the integration, MUDs offer benefits such as easier access to amenities and services, residential and working spaces all in one location.
Some of the factors that have been driving the growth of MUDs include;
- Convenience: Mixed-Use Developments are more convenient and preferred given that the development mix creates an upscale living environment with easy access to work places, retail stores, and/or, residential areas,
- Positive demographics: Kenya’s relatively high urbanization and population growth rates of 4.0% p.a and 2.3% p.a, respectively, against the world’s 1.8% p.a and 1.0% p.a, respectively, as at 2020, has also accelerated the growth and performance of MUDs through increased demand for the spaces,
- Relatively High Returns: MUDs offer operational synergies due to incorporation of different Real Estate themes hence enabling investors to maximize returns, either through Rental income or Capital appreciation. In addition to this, most developments are situated in superior locations with the capability to attract prospective clients and in return generate relatively higher returns,
- Risks Diversification: Overall, investments in MUDs provides diversification to risk of any one asset class that may be negatively affected i.e. by market forces such as low uptake or demand in specific themes, and,
- Maximum Use of Land: Due to the scarcity of suitable land particularly in the urban areas as a result of increasing population and urbanization growth rates, MUDs ensure efficient use of the available land due to the incorporation of the different asset classes in one project and location.
Despite the aforementioned supporting factors, Mixed- Use Developments face various challenges such as:
- Project Complexity: The complex nature of MUDs in comparison to the single use developments poses risks such as financial losses. This may lead to losses of returns to investors if not well executed, as they require more critical details and controls in addition to being well-planned and managed in order to be successful, and,
- High Development Costs: Due to the need to incorporate the various Real Estate themes, funding of MUD project poses a challenge due to the high development costs required to plan and implement the projects.
Section II: Mixed-Use Developments Performance Summary in 2021
- Summary of Thematic Performance in Comparison to General Market Performance
Mixed-Use Developments recorded an average rental yield of 7.2% in 2021, 0.7% points higher than the respective single use themes which recorded average rental yield of 6.5% in the similar period. The relatively better performance was mainly attributed to; i) an improved business environment, ii) strategic and prime locations of the developments with the capability to attract prospective clients, and, iii) preference by target clients due to their convenience hence improved demand and returns to investors. The retail and commercial office theme in the MUDs recorded a 1.3% and 0.2% points increase in the average rental yield to 8.4% and 7.1%, respectively in 2021, from 7.1% and 6.9% in 2020. This was mainly due to an improved business environment leading to increased demand and uptake of spaces. For the Residential theme in the MUDs, the average rental yield declined by 0.3% points to 6.0% in 2021, from 6.3% in 2020, attributed to other landlords still offering discounts in a bid to attract more tenants as well as retaining the existing ones. Additionally, the Retail, Commercial Office and Residential themes in the MUDs performed better in 2021 when compared to single Retail, Commercial Office and Residential themes which realized rental yields of 7.8%, 6.6%% and 5.2%, respectively in 2021. This was attributed to their incorporated live, work and play lifestyle thus more preferred, coupled with the adequate amenities available leading to their increased demand.
The table below shows the performance of single-use and mixed-use development themes between 2020 and 2021;
|
Thematic Performance of MUDs in Key Nodes 2020-2021 |
||||||
|
|
MUD Themes Average |
Market Performance Average |
||||
|
|
Rental Yield 2021 |
Rental Yield 2020 |
∆ in y/y MUD Rental yield |
Rental Yield 2021 |
Rental Yield 2020 |
∆ in y/y Market Average Rental Yield |
|
Retail |
8.4% |
7.1% |
1.3% |
7.8% |
7.7% |
0.1% |
|
Offices |
7.1% |
6.9% |
0.2% |
6.6% |
6.8% |
(0.2%) |
|
Residential |
6.0% |
6.3% |
(0.3%) |
5.2% |
5.8% |
(0.6%) |
|
Average |
7.2% |
6.9% |
0.3% |
6.5% |
6.8% |
(0.3%) |
|
* Market performance is calculated from nodes where sampled MUDs exist |
||||||
Source: Cytonn Research 2021
- Mixed-Use Developments Performance per Node
Karen was the best performing node with an average MUD rental yield of 8.7%, 1.5% points higher than the market average of 7.2% in 2021. In terms of respective performance of the MUD themes in Karen; Retail and Office themes recorded average rental yields of 8.8%, and 9.0%, respectively, 0.4%, and 1.9% points higher than the market average of 8.4%, and 7.1%, respectively. The remarkable performance was largely attributed to; i) the prime developments fetching higher rates, and, ii) the adequate amenities and infrastructure servicing the area.
Eastlands was the worst performing node with the average MUD rental yield coming in at 5.1%, 2.1% points lower than the market average of 7.2%. The respective themes i.e. Retail, commercial office and Residential sectors recorded average rental yield of 5.5%, 5.0% and 4.2%, respectively, 2.9%, 2.1% and 0.8% points lower than the market average of 8.4%, 7.1% and 6.0%, respectively. The poor performance was mainly attributed to low quality developments fetching lower rents thus affecting the overall yields, as well as inadequate amenities and infrastructure servicing the area.
The table below shows the performance of Mixed-Use Developments by node in 2021;
(All Values in Kshs Unless Stated Otherwise)
|
Nairobi’s Mixed-Use Developments Market Performance by Nodes 2021 |
|||||||||||||
|
|
Retail Performance |
Commercial Office Performance |
Residential Performance |
|
|||||||||
|
Location |
Price/SQFT |
Rent/SQFT |
Occup. (%) |
Rental Yield (%) |
Price/ SQFT |
Rent/SQFT |
Occup. %) |
Rental Yield (%) |
Price/ SQM |
Rent/ SQM |
Annual Uptake % |
Rental Yield % |
Average MUD yield |
|
Karen |
23,333 |
196 |
86.7% |
8.8% |
13,233 |
117 |
85.0% |
9.0% |
|
|
|
|
8.7% |
|
Westlands |
15,833 |
173 |
70.8% |
9.5% |
12,892 |
110 |
71.7% |
7.3% |
211,525 |
1,226 |
15.6% |
7.0% |
7.8% |
|
Kilimani |
18,500 |
162 |
79.0% |
8.3% |
13,713 |
106 |
79.0% |
6.7% |
|
|
|
|
7.4% |
|
Mombasa Rd |
20,000 |
185 |
70.0% |
8.4% |
13,000 |
100 |
60.0% |
5.5% |
156,079 |
853 |
13.3% |
6.6% |
7.4% |
|
Thika Rd |
23,750 |
215 |
82.5% |
9.2% |
13,250 |
105 |
72.5% |
6.9% |
128,545 |
612 |
17.9% |
6.1% |
7.0% |
|
Upper Hill |
15,485 |
130 |
62.5% |
6.4% |
12,000 |
102 |
70.0% |
7.0% |
|
|
|
|
6.8% |
|
Eastlands |
20,000 |
124 |
75.0% |
5.5% |
12,000 |
80 |
62.5% |
5.0% |
72,072 |
360 |
10.0% |
4.2% |
5.1% |
|
Average |
18,759 |
170 |
75.9% |
8.4% |
12,924 |
106 |
73.6% |
7.1% |
142,055 |
763 |
15.0% |
6.0% |
7.2% |
|
*The average MUDs performance is based on areas where sampled projects exist |
|||||||||||||
Source: Cytonn Research 2021
- Performance of Real Estate Themes in MUDs versus Single-themed Developments’ Performance
In our Mixed-Use Development analysis, we looked into the performance of the retail, commercial office and residential themes:
- Retail Space
The average rental yield of retail spaces in Mixed-Use Developments came in at 8.4% in 2021, 0.6% points higher than single use retail developments that realized an average rental yield of 7.8%. This was mainly attributed to the higher rental rates that MUDs generated at Kshs 170 per SQFT when compared to Kshs 168 per SQFT recorded for the single-use retail spaces. Moreover, the remarkable performance for the MUDs was attributed to their higher preference and demand resulting from their convenience as one-stop centers for consumers living and working in the area.
Westlands was the best performing node with the average rental yield at 9.5%, 1.1% points higher than the market average of 8.4%. This was mainly driven by; i) the presence of high and middle income earning residents with greater purchasing power, ii) relatively higher rental rates and prices fetching higher returns, and iii) adequate amenities and infrastructure servicing the developments. Contrary to this, Eastlands was the worst performing node with an average rental yield of 5.5%, 2.9% points lower than the market average of 8.4%, as a result of the higher competition of informal retail spaces, and the low supply of quality spaces which in turn generated lower rental rates.
The table below provides a summary of the performance of retail spaces in MUDs against market performance in 2021;
|
Performance of Retail in MUDs versus Market Performance 2021 |
|||||||
|
|
MUD Performance |
Market Performance |
|
||||
|
Location |
Rent/SQFT |
Occupancy (%) |
Rental Yield (%) |
Rent/SQFT |
Occupancy (%) |
Rental Yield (%) |
Rental Yield Difference |
|
Westlands |
173 |
70.8% |
9.5% |
209 |
80.4% |
9.7% |
(0.2%) |
|
Thika Rd |
215 |
82.5% |
9.2% |
158 |
74.2% |
6.7% |
2.5% |
|
Karen |
196 |
86.7% |
8.8% |
214 |
80.8% |
9.4% |
(0.5%) |
|
Mombasa Rd |
185 |
70.0% |
8.4% |
136 |
70.5% |
6.0% |
2.4% |
|
Kilimani |
162 |
79.0% |
8.3% |
172 |
83.6% |
9.0% |
(0.7%) |
|
Upper Hill |
130 |
62.5% |
6.4% |
|
|
|
|
|
Eastlands |
124 |
75.0% |
5.5% |
135 |
72.5% |
5.9% |
(0.4%) |
|
Average |
170 |
75.9% |
8.4% |
168 |
77.0% |
7.8% |
0.6% |
|
*Market performance is calculated from nodes where sampled MUDs exist |
|||||||
Cytonn Research 2021
- Commercial Office Space
The average rental yield for commercial office spaces in MUDs came in at 7.1%, 0.5% points higher than the market performance which realized an average rental yield of 6.6% in 2021. The performance by MUDs was largely attributed to; i) the presence of quality spaces generating higher rental rates at Kshs 105 per SQFT compared to the market’s average of Kshs 91 per SQFT, and, ii) higher prices at Kshs 12,924 per SQFT against market’s average of Kshs 12,306 per SQFT generating higher returns. In light of this, Karen was the best performing node with an average rental yield of 9.0% against the market average of 7.1% due to; i) the presence of high-end developments such as the Galleria business park and the Hub that offer higher rental rates and returns, ii) adequate infrastructure and amenities servicing the area, and, iii) prime location targeting clients who are willing to pay premiums for the spaces. Eastlands was the worst performing node with an average rental yield of 5.0% as a result of the availability of low quality office spaces generating lower rents at Kshs 80 per SQFT against the market average of Kshs 105 per SQFT.
The table below shows the performance of office spaces in MUDs against the single use themed market in 2021;
All Values in Kshs Unless Stated Otherwise
|
Performance of Commercial Offices in MUDs versus Market Performance 2021 |
|||||||||
|
|
MUD Performance |
Market Performance |
|
||||||
|
Location |
Price/SQFT |
Rent/SQFT |
Occupancy (%) |
Rental Yield (%) |
Price/SQFT |
Rent/SQFT |
Occupancy (%) |
Rental Yield (%) |
Rental Yield Difference |
|
Karen |
13,233 |
117 |
85.0% |
9.0% |
13,325 |
104 |
84.8% |
7.5% |
1.5% |
|
Westlands |
12,892 |
110 |
71.7% |
7.3% |
12,038 |
104 |
75.6% |
7.9% |
(0.6%) |
|
Upper Hill |
12,000 |
102 |
70.0% |
7.0% |
12,432 |
93 |
77.1% |
6.7% |
0.3% |
|
Thika Rd |
13,250 |
105 |
72.5% |
6.9% |
12,500 |
79 |
76.7% |
5.6% |
1.3% |
|
Kilimani |
13,713 |
106 |
79.0% |
6.7% |
12,293 |
92 |
79.8% |
7.1% |
(0.4%) |
|
Mombasa Rd |
13,000 |
100 |
60.0% |
5.5% |
11,250 |
71 |
61.3% |
4.7% |
0.8% |
|
Eastlands |
12,000 |
80 |
62.5% |
5.0% |
|
|
|
|
|
|
Average |
12,924 |
105 |
73.6% |
7.1% |
12,306 |
91 |
75.9% |
6.6% |
0.5% |
|
*Market performance is calculated from nodes where sampled MUDs exist |
|||||||||
Cytonn Research 2021
- Residential Space
Residential units within MUDs recorded an average rental yield of 6.0% in 2021, 0.8% points higher than the single-use residential market rental yield of 5.2%. The better performance was largely driven by; i) availability of adequate amenities and infrastructure, and ii) relatively higher prices and rents at Kshs 142,055 per SQFT and Kshs 763 per SQFT, respectively, compared to the Kshs 88,013 and Kshs 459 per SQFT realized for the single use residential theme, respectively. Westlands was the best performing node with an average rental yield of 7.0% due to the presence of affluent developments fetching high rents and prices, and the adequate infrastructure servicing the area such as Redhill and Mwanzi roads. However, Eastlands was the worst performing node with an average rental yield of 4.2% resulting from; i) lower rental prices and rates, ii) inadequate infrastructure to service the developments, and iii) availability of low quality units fetching lower rates that affect returns as well.
The table below summarizes the performance of residential spaces in MUDs against the single themed market in 2021;
All Values in Kshs Unless Stated Otherwise
|
Performance of Residential Units in MUDs versus Market Performance 2021 |
|||||||||
|
|
MUD performance |
Market performance |
|
||||||
|
Location |
Price/SQM |
Rent/SQM |
Uptake % |
Rental Yield % |
Price/SQM |
Rent/SQM |
Uptake % |
Rental Yield % |
Rental Yield Difference |
|
Westlands |
211,525 |
1,226 |
15.6% |
7.0% |
145951 |
833 |
27.9% |
4.6% |
2.4% |
|
Mombasa Rd |
156,079 |
853 |
13.3% |
6.6% |
81,578 |
428 |
12.6% |
5.5% |
1.1% |
|
Thika Rd |
128,545 |
612 |
17.9% |
6.1% |
83153 |
413 |
15.5% |
4.8% |
1.3% |
|
Eastlands |
72,072 |
360 |
10.0% |
4.2% |
71,971 |
327 |
13.8% |
5.1% |
(0.9%) |
|
Average |
142,055 |
763 |
15% |
6.0% |
88,013 |
459 |
15.1% |
5.2% |
0.8% |
|
Westlands and Limuru Road recorded the highest prices and rents attributed to the affluent developments with adequate amenities and infrastructure thus fetching higher rates *The average residential performance is based on areas where sampled MUDs exist |
|||||||||
Cytonn Research 2021
Section III: Mixed-Use Developments Investment Opportunity and Outlook
The table below summarizes our outlook on Mixed-Use Developments (MUDs), where we look at the general performance of the key sectors that compose MUDs i.e. retail, commercial office and residential and investment opportunities that lies in the themes;
|
|
Mixed-Use Developments (MUDs) Outlook |
|
|
|
Sector |
2021 Sentiment and Outlook |
2021 Outlook |
|
|
Retail |
|
Neutral |
|
|
Office |
|
Neutral |
|
|
Residential |
|
Neutral |
|
|
Outlook |
We are NEUTRAL of the Mixed-Use Developments (MUDs) outlook supported by the impressive returns recorded at 7.2% in 2021, from 6.9% in 2020. However, their performance is expected to be weighed down by existing oversupply at 7.3 mn SQFT in the NMA office market, and oversupply in the retail market at 3.0 mn SQFT in the NMA and 1.7 mn SQFT in Kenya retail market. The investment opportunity lies in areas with relatively high returns such as Karen and Westlands which recorded an average MUD rental yield of 8.7%, and, 7.8% respectively, against the market average of 7.2%. |
||
Source: Cytonn Research 2021
Disclaimer: The views expressed in this publication are those of the writers where particulars are not warranted. This publication, which is in compliance with Section 2 of the Capital Markets Authority Act Cap 485A, is meant for general information only and is not a warranty, representation, advice or solicitation of any nature. Readers are advised in all circumstances to seek the advice of a registered investment advisor.
- Talk to us
- Kenya
- P.O Box 20695 - 00200, Nairobi, Kenya
- Cell +254(0) 709 101 000
- Tel +254(0) 20 3929 000
- WhatsApp +254(0) 748 070 000
- United States
- +1 (240) 368-6217
- DOWNLOAD OUR APP
-


- Kenya
- Cysuites work spaces, Church Rd, Westlands, Nairobi, Kenya
- USA
- Suite 1150, 1775 Eye Street NW, USA, Washington DC 20006, USA
- Investments
- High Yield
- Private Equity
- Real Estate
- Real Estate
- RiverRun Estates
- Cytonn Towers
- The Ridge
- Taraji Heights
- The Alma