Understanding Exchange Regimes, & Cytonn Weekly #48/2020
By Research Team, Nov 29, 2020
Executive Summary
Fixed Income
During the week, T-bills were undersubscribed, with the overall subscription rate coming in at 64.3%, down from 104.2% the previous week. The highest subscription rate was in the 91-day paper, which came in at 114.5%, down from 139.6% recorded the previous week. The subscription for the 182-day paper declined to 63.7% from 65.0%, while that of the 365-day paper dropped to 44.7% from 129.3% recorded the previous week. During the week, the World Bank released the 22nd Edition of the Kenya Economic Outlook: Navigating the pandemic, highlighting that the pandemic has had severe impact on the Kenyan Economy with the GDP projected to contract by 1.0% in 2020 but recover faster to grow at 6.9% in 2021. The Monetary Policy Committee (MPC) met on 26th November 2020 to review the prevailing macroeconomic conditions and decide on the direction of the Central Bank Rate (CBR). The MPC retained the CBR at 7.0% which is in line with our expectations in our MPC November 2020 Note;
Equities
During the week, the equities market was on a downward trajectory, with NSE 20, NASI and NSE 25 recording losses of 1.6%, 0.3% and 0.4% respectively, taking their YTD performance to losses of 33.8%, 20.9% and 13.9%, for NSE 20, NSE 25 and NASI, respectively. The equities market performance was driven by losses recorded by large cap stocks such as Diamond Trust Bank, Equity Group and EABL of 2.8%, 2.7% and 0.8%, respectively. The losses were however mitigated by gains recorded by KCB Group, NCBA Group and BAT of 2.6%, 1.1% and 0.5%, respectively. During the week, KCB Group disclosed that it had entered into an agreement with Atlas Mara Limited (ATMA) to acquire 62.1% stake in Banque De Populaire du Rwanda (BPR) in Rwanda and 100.0% stake in African Banking Corporation Ltd Tanzania (ABC Tanzania). Additionally, during the week, Diamond Trust Bank (DTB-K), NCBA Group and Stanbic Bank released their Q3’2020 financial results;
Real Estate
During the week, Hydro Developers Limited, a real estate developer based in Nairobi, partnered with the Kenyan government in the construction of approximately 30,489 affordable units under the Big Four Agenda, at a cost of Kshs 3.0 bn. In the retail sector, Naivas supermarket opened two new branches, one located at Ananas mall in Thika and the other one in Nairobi CBD’s Hazina Mall bringing the retailer’s total operational outlets to 68. In the infrastructure sector, Kenya Urban Roads Authority (KURA) announced plans to construct two elevated carriage ways within the Nairobi Central Business District (CBD);
Focus of the Week
In this week’s focus, following the continued depreciation of the Kenya Shilling against the US Dollar and various accusations on the Central Bank of Kenya, (CBK), with regards to currency manipulation, we decided to do a note focused on understanding the various currency regimes and how countries use them to ensure currency stability, how to find the value of a currency and the factors that have been driving the performance of the Kenya shilling. Due to Covid-19 pandemic related occurrences, the Kenyan shilling has remained under pressure with the CBK conducting interventions that have been interpreted as influences to undervalue the shilling so as to protect it from further depreciation.
- Weekly Rates:
- Cytonn Money Market Fund closed the week at a yield of 10.52%. To invest, just dial *809#;
- Cytonn High Yield Fund closed the week at a yield of 13.03% p.a. To invest, email us at sales@cytonn.com and to withdraw the interest you just dial *809#;
- For an exclusive tour of Cytonn’s real estate developments, visit: Sharp Investor's Tour and for more information, email us at sales@cytonn.com;
- We continue to offer Wealth Management Training daily, from 9:00 am to 11:00 am, through our Cytonn Foundation. The training aims to grow financial literacy among the general public. To register for any of our Wealth Management Training, click here;
- For Pension Scheme Trustees and members, we shall be having different industry player’s talk about matters affecting Pension Schemes and the pensions industry at large. Join us every Wednesday from 9:00 am to 11:00 am for in-depth discussions on matters pension;
- If interested in our Private Wealth Management Training for your employees or investment group, please get in touch with us through wmt@cytonn.com;
- For recent news about the company, see our news section here;
Money Markets, T-Bills & T-Bonds Primary Auction:
During the week, T-bills were undersubscribed, with the overall subscription rate coming in at 64.3%, down from 104.2% the previous week. The highest subscription rate was in the 91-day paper, which came in at 114.5%, down from 139.6% recorded the previous week. The subscription for the 182-day paper declined to 63.7% from 65.0%, while that of the 365-day paper dropped to 44.7% from 129.3% recorded the previous week. The yields on the 91-day, 182-day and 364-day increased marginally by 2.4 bps, 4.1 bps and 5.7 bps to 6.7%, 7.2% and 8.2%, respectively. The government continued to reject expensive bids with the acceptance rate declining to 87.2%, from 96.6% recorded the previous week, accepting bids worth Kshs 13.4 bn out of the Kshs 15.4 bn worth of bids received.
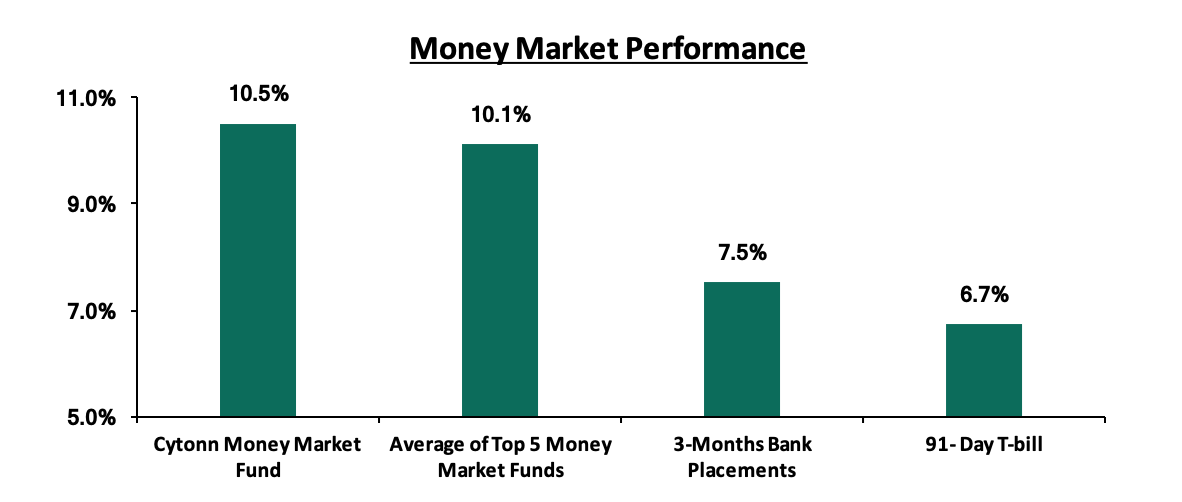
In the money markets, 3-month bank placements ended the week at 7.5% (based on what we have been offered by various banks), while the yield on the 91-day increased marginally by 2.4 bps to close at 6.7%. The average yield of the Top 5 Money Market Funds increased by 0.1% points to 10.1% from 10.0% recorded the previous week. The yield on the Cytonn Money Market Fund remained unchanged at 10.5%, similar to what was recorded the previous week.
Liquidity:
The money markets remained liquid during the week, with the average interbank rate increasing marginally by 0.5% points to 3.5%, from the 2.9% recorded the previous week. This was supported by government payments, which partly offset tax receipts. The average interbank volumes also increased by 173.2% to Kshs 12.8 bn from Kshs 4.7 bn, recorded the previous week. According to the Central Bank of Kenya’s weekly bulletin released on 27th November 2020, commercial banks’ excess reserves stood at Kshs 6.3 bn in relation to the 4.25% cash reserves requirement (CRR).
Kenya Eurobonds:
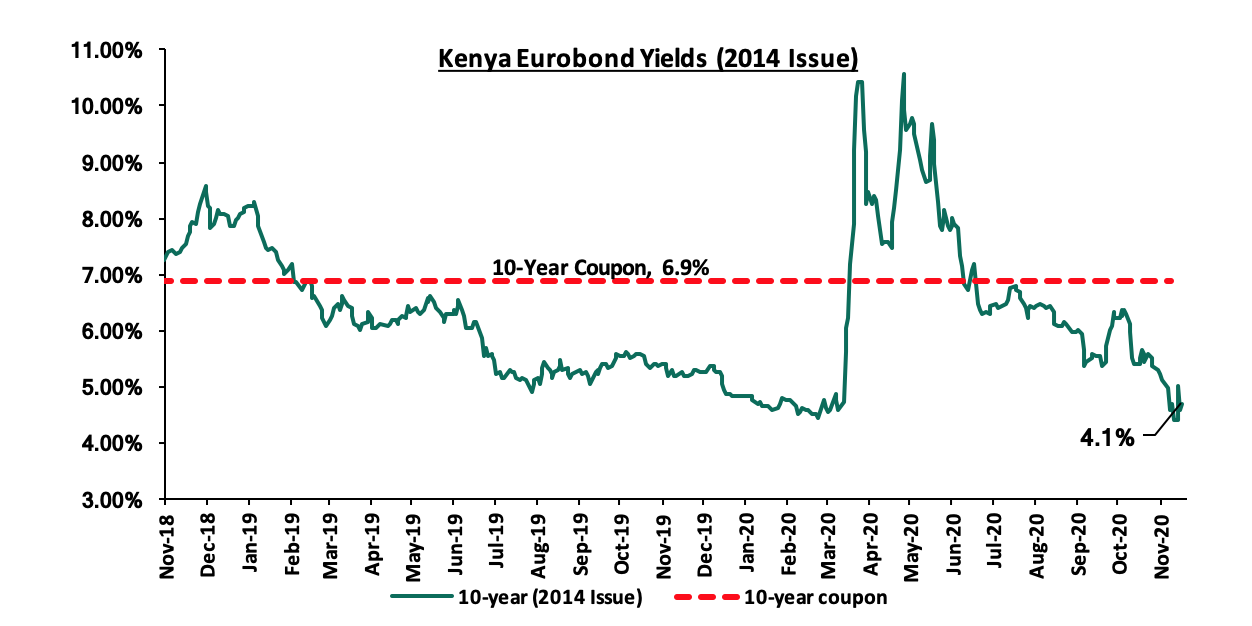
During the week, the yields on all Eurobond yields declined pointing to improved foreign investor sentiments. This was following the announcement of a USD 2.3 bn IMF drawdown facility to help mitigate Covid-19 related economic shocks and the news of Kenya’s intention to join the Paris club - Debt Service Suspension Initiative (DSSI) that will aid in debt sustainability. According to Reuters, the yield on the 10-year Eurobond issued in June 2014 declined by 0.6% points to 4.1% from 4.7%, as was recorded the previous week.
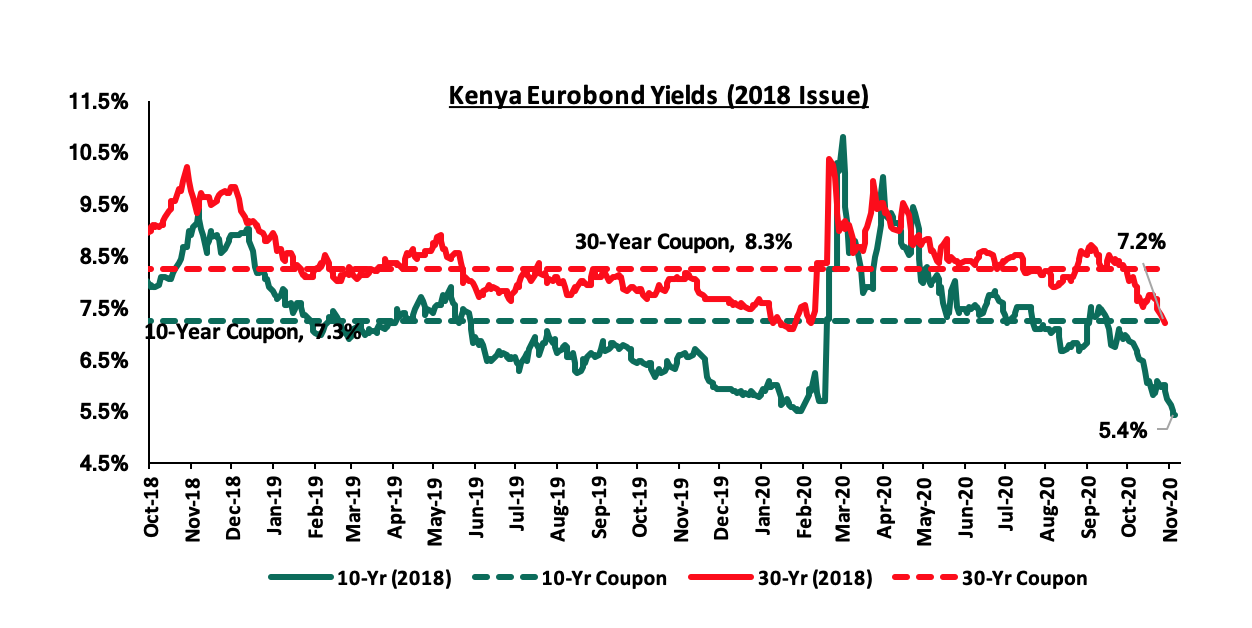
During the week, the yields on the 10-year and 30-year Eurobonds issued in 2018, on the other hand, declined by 0.5% points and 0.4% points to 5.4% and 7.2%, respectively, from 5.9% and 7.6% recorded previous week
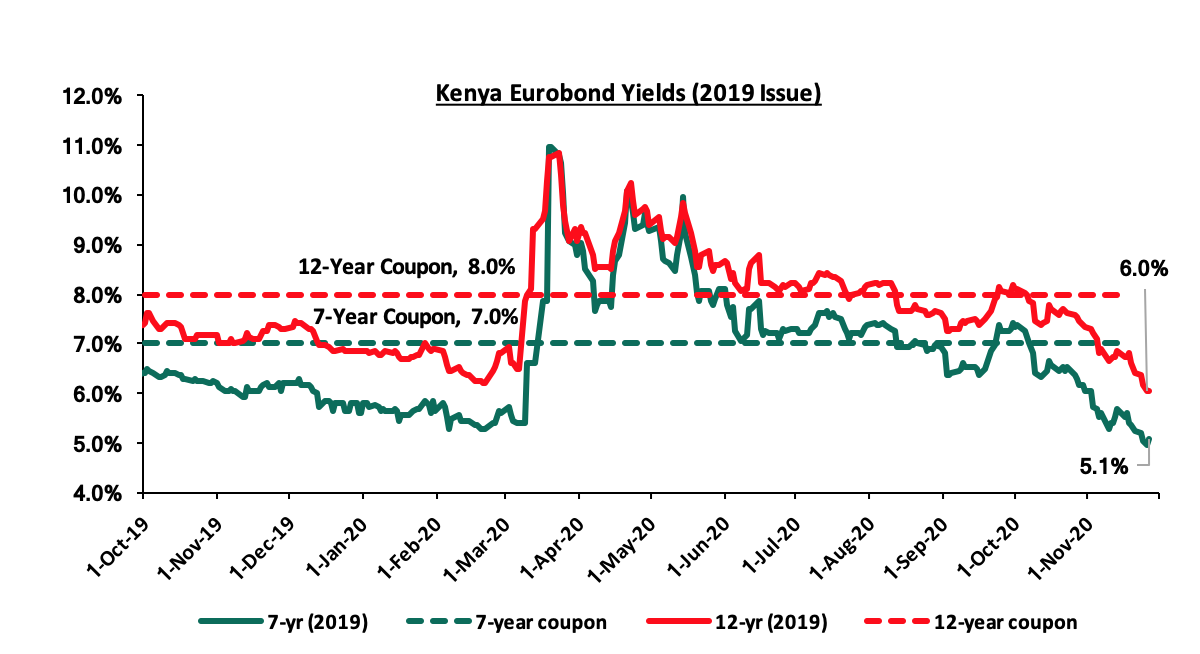
During the week, the yields on the 2019 dual-tranche Eurobonds also declined, with the 7-year Eurobond and the 12-year Eurobond declining by 0.3% points and 0.6% points to 5.1% and 6.0%, from 5.4% and 6.6% recorded last week.
Kenya Shilling:
During the week, the Kenyan shilling depreciated against the US dollar by 0.4% to Kshs 109.9 from Kshs 109.4, mainly attributable to the persistent dollar demand from general importers as they meet their end of month obligations, as well as low inflows from sectors like horticulture and tourism. On a YTD basis, the shilling has depreciated by 8.4% against the dollar, in comparison to the 0.5% appreciation in 2019. We expect continued pressures on the Kenyan shilling due to:
- Demand from merchandise and energy sector importers as they beef up their hard currency positions amid a slowdown in foreign dollar currency inflows, and,
- Continued uncertainty globally making people prefer holding dollars and other hard currencies.
However, in the short term, the shilling is expected to be supported by:
- The Forex reserves which are currently at USD 8.0 bn (equivalent to 4.9-months of import cover), which is above the statutory requirement of maintaining at least 4.0-months of import cover, and the EAC region’s convergence criteria of 4.5-months of import cover, and,
- The improving current account position which narrowed to 4.9% of GDP in the 12 months to October 2020 compared to 5.3% of GDP during a similar period in 2019, and,
- Improving diaspora remittances evidenced by a 17.3% y/y increase to USD 263.1 mn in October 2020, from USD 224.3 mn recorded over the same period in 2019, has cushioned the shilling against further depreciation.
Weekly Highlight:
During the week, the World Bank released the 22nd edition of the Kenya economic outlook – Navigating the pandemic. The report highlighted that Kenya’s economic outlook remains highly uncertain, as the COVID-19 pandemic has severely affected the country, with the GDP contracting by 5.7% as discussed in our Q2’2020 GDP Note. Some of the key take-outs include:
- Economic Growth: The report noted that the economy contracted sharply, by 5.7% year on year in H1’2020. Tourism and education sectors were the worst hit sectors contracting by 83.3% and 56.2% respectively, due to the Covid-19 containment measures put in place. There has been a couple of response measures by the government that are now starting to help with the economic recovery in the second half. Some of the measures include gradual reopening of the economy and also implementation of accommodative fiscal and monetary policies. The report’s baseline assumption is that normal weather will support agricultural production and its strong linkage to industrial and services output will stimulate a faster recovery,
- Fiscal and monetary Measures undertaken to support the economy: The government’s fiscal policy counter measures against the COVID-19 pandemic in Q4 of FY2019/20, coupled with the weaker economy, reversed the fiscal consolidation efforts
Tax revenue underperformed by Kshs 41.7 bn (0.4% of GDP) to close at Kshs 342.5 bn (3.0% of GDP), below the target of Kshs 384.3bn, for Q1 of FY2020/21. The revenue under-collection arose from shortfalls due to tax relief granted to mitigate the impact of COVID-19 and low economic activity. On the other hand, Monetary policy has been accommodative to mitigate the impact of the pandemic with the Central Bank reducing the policy rate to 7.0% in April from the previous 8.25% at the beginning of the year and the cash requirement ratio to 4.25% from 5.25% in March and maintaining them up to now,
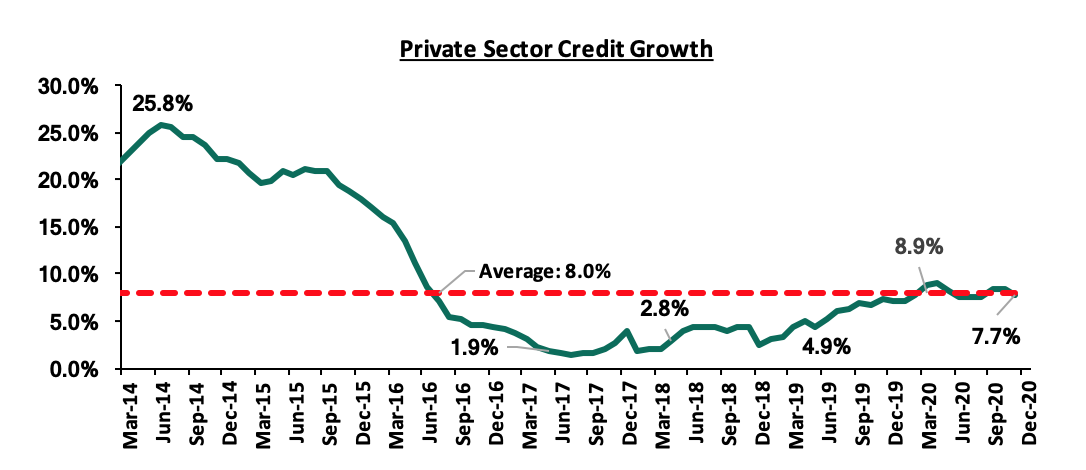
- Private Sector Credit Growth: Private sector credit growth has remained moderate in 2020, since despite the lower Central Bank Rate the banks have remained cautious to lending due to increased risk and also since government papers have remained attractive. According to the latest data from the MPC release growth in private sector lending stood at 7.7% in the 12 months to October, 2020. There was strong growth in lending to sectors like: manufacturing (7.8%), transport and communications (21.1%), real estate (7.6%) and consumer durables (15.7%). The imminent operationalization of the Credit Guarantee Scheme for the vulnerable Micro Small and Medium sized Enterprises (MSMEs), will de-risk lending by commercial banks, as is aimed at increasing credit to this sector.
The chart below indicates the growth in private credit growth over the last few years:
- Public Debt: The fiscal measures have led to revenue underperformance as the government tries to find a balance between Covid - 19 containment and providing tax relief. In order to finance the revenue shortfall the government has resulted in borrowing where public debt rose to 65.6% of GDP in June 2020 from 62.4% of GDP in June 2019. The increase in debt has been driven by widening fiscal deficit due to revenue underperformance. Following the significant slowdown in GDP growth and nominal exchange rate depreciation, debt vulnerabilities have risen and interest payments will continue to add to the burden. The report also noted that; the composition of Kenya’s debt remains balanced between external and domestic sources and the share of multilateral debt in external debt remains substantial.
The figure below shows Kenya’s debt composition as of June 2020 with 55.2% of the total debt being foreign borrowing:
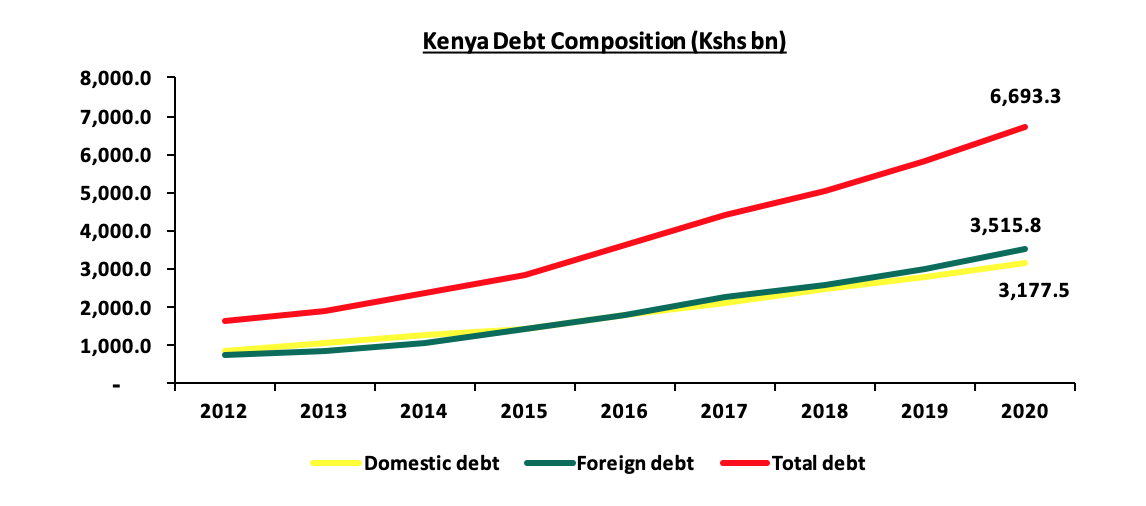
As at June 2020, external debt composition comprised of multilateral, bilateral and commercial debt at 37.8%, 30.7% and 31.5% of the total external debt, respectively. Below is a breakdown of Kenya’s external debt:
|
|
Jun-18 |
Jun-19 |
Jun-20 |
|||
|
|
USD mn |
|
USD mn |
|
USD mn |
|
|
Multilateral debt |
8,031.40 |
33.5% |
8,938.50 |
30.2% |
12,407.10 |
37.8% |
|
Bilateral debt |
7,533.40 |
31.5% |
9,736.80 |
32.9% |
10,084.80 |
30.7% |
|
Commercial debt |
8,219.70 |
34.3% |
10,711.40 |
36.2% |
10,340.00 |
31.5% |
|
Export Credit |
165.5 |
0.7% |
165.5 |
0.6% |
0 |
0.0% |
|
Total |
23,950.00 |
|
29,552.20 |
|
32,831.90 |
|
-
Balance of Payments: Kenya’s external trade position has been supported by import compression and resilient remittances. The current account deficit fell to 4.5 % of GDP in the 12-month to August 2020, from 5.2 % of GDP over the same period 2019, driven by resilient diaspora remittance inflows, and lower imports of goods and services which more than outweighed a decline in exports of goods and services. Following containment measures in Kenya and its trading partners, both merchandise exports and imports contracted sharply year to date. The current account deficit is financed through borrowings and private investments, these has led to the capital and financial account balance declining to 3.8% of GDP in the year to August 2020 compared to 6.7% of GDP in the year to August 2019. The external financing pressures has increased with the continued depreciation of the shilling against the dollar.
In conclusion, the report takes a baseline assumption that Kenya’s economic output is projected to contract by 1.0 % in 2020, and rebound in 2021 to grow by 6.9%. The base case projections assume that the economic effects of COVID-19 are expected to fade by early to mid-2021, as vaccines and additional treatments become available. Even with the economy set for recovery, as shown by an improvement in the leading economic indicators; We are of the view that the 6.9% growth in 2021 is quite ambitious given that we are already in the last quarter of 2020 and there has been a recent spike in the number of Covid infection, not only in Kenya but globally.
MPC November 2020 Meeting
The Monetary Policy Committee (MPC) met on 26th November 2020 to review the prevailing macroeconomic conditions and decide on the direction of the Central Bank Rate (CBR). The MPC retained the CBR at 7.0% which is in line with our expectations MPC November 2020 Note. This is the fifth straight time that the committee is retaining the rate at 7.0% following the rate cut in April 2020, indicating that it was having its intended outcome. The key highlights from the meeting:
- Inflation remains well anchored. Month-on-month overall inflation stood at 4.8% in October compared to 4.2% in September, and is expected to remain within the target range in the near term, supported by lower food prices and muted demand pressures.
- The banking sector remains stable and resilient, with strong liquidity and capital adequacy ratios. The ratio of gross non-performing loans (NPLs) to gross loans remained stable at 13.6% in October and August. NPL increases were noted in the transport and communication, energy and water, tourism, restaurant and hotels and real estate sectors, mainly due to the disruption of businesses.
- Total loans amounting to Kshs 1.38 tn have been restructured 46.5% of the total banking sector loan book of Kshs 2.97 tn by the end of October, in line with the emergency measures announced by CBK on March 18 to provide relief to borrowers. For other sectors, a total of Kshs 1,076.9 billion had been restructured mainly to trade (18.7%), manufacturing (22.7%), real estate (14.5%) and agriculture (12.8%).
- Following the lowering of the Cash Reserve Ratio (CRR) in March, Kshs 32.6 bn of the Kshs 35.2 bn, representing 92.7%, has been used to support lending, especially to the tourism, trade and transport and communication, real estate, manufacturing and agriculture sectors.
- Current account deficit is projected at about 5.1% of GDP in 2020 from 5.8% in 2019. Exports of goods have strengthened from the disruptions of COVID-19, growing by 2.8% in the period January to October 2020 compared to a similar period in 2019. Receipts from tea exports rose by 13.2% during this period, largely reflecting increased output. Horticulture and flower exports have rebounded, reflecting the normalization of demand in the international market, and the availability of adequate cargo space.
The MPC concluded that the current accommodative monetary policies together with the fiscal measures are still being transmitted to support the economy, and therefore decided to retain the Central Bank Rate (CBR) at 7.0%. The Committee will meet again in January 2021, but remains ready to re-convene earlier if necessary.
Rates in the fixed income market have remained relatively stable due to the high liquidity in the money markets, coupled with the discipline by the Central Bank as they reject expensive bids. The government is 48.7% ahead of its prorated borrowing target of Kshs 196.4 bn having borrowed Kshs 291.9 bn. In our view, due to the current subdued economic performance brought about by the effects of the COVID-19 pandemic, the government will record a shortfall in revenue collection with the target having been set at Kshs 1.9 tn for FY’2020/2021 thus leading to a larger budget deficit than the projected 7.5% of GDP, ultimately creating uncertainty in the interest rate environment as additional borrowing from the domestic market may be required to plug the deficit. Owing to this uncertain environment, our view is that investors should be biased towards short-term to medium-term fixed income securities to reduce duration risk.
During the week, the equities market was on a downward trajectory, with NSE 20, NASI and NSE 25 recording losses of 1.6%, 0.3% and 0.4% respectively, taking their YTD performance to losses of 33.8%, 20.9% and 13.9%, for NSE 20, NSE 25 and NASI, respectively. The equities market performance was driven by losses recorded by large cap stocks such as Diamond Trust Bank, Equity Group and EABL of 2.8%, 2.7% and 0.8%, respectively. The losses were however mitigated by gains recorded by KCB Group, NCBA Group and BAT of 2.6%, 1.1% and 0.5%, respectively.
Equities turnover rose by 6.5% during the week to USD 21.3 mn, from USD 20.0 mn recorded the previous week, taking the YTD turnover to USD 1.3 bn. Foreign investors turned net sellers during the week, with a net selling position of USD 3.0 mn, from a net buying position of USD 0.2 mn recorded the previous week, taking the YTD net selling position to USD 280.9 mn.
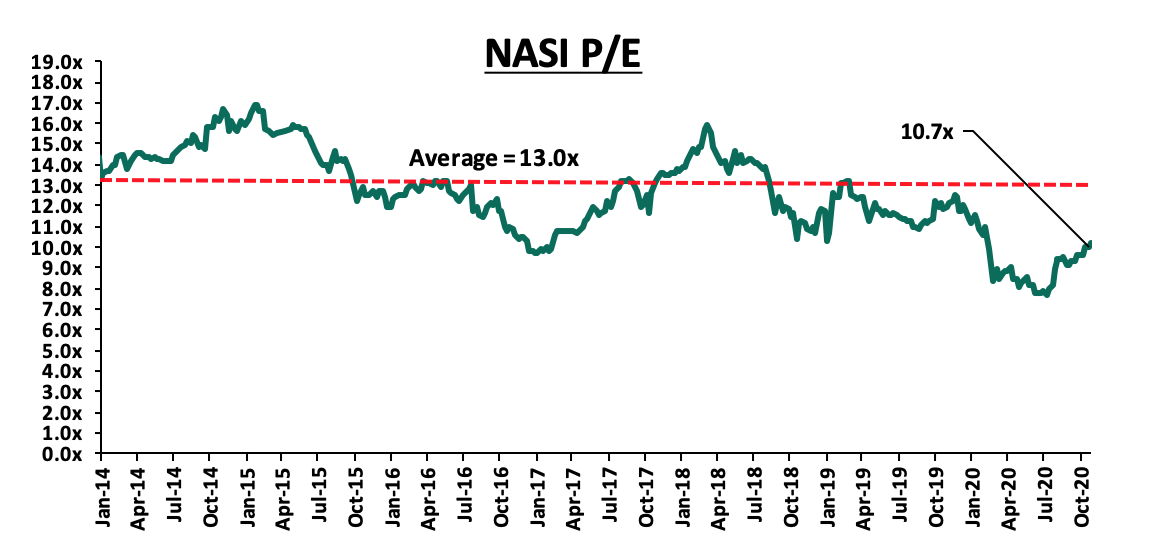
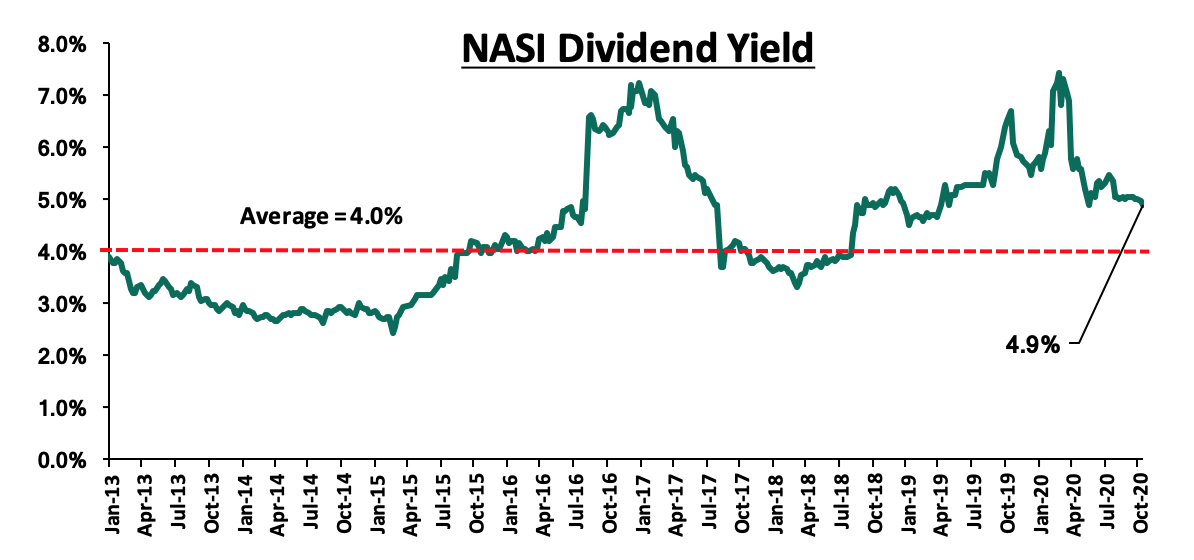
The market is currently trading at a price to earnings ratio (P/E) of 10.7x, 17.3% below the 11-year historical average of 13.0x. The average dividend yield is currently at 4.9%, unchanged from what was recorded the previous week, and 0.9% points above the historical average of 4.0%.
With the market trading at valuations below the historical average, we believe there are pockets of value in the market for investors with higher risk tolerance and are willing to wait out the pandemic. The current P/E valuation of 10.7x is 39.1% above the most recent valuation trough of 7.7x experienced in the first week of August 2020. The charts below indicate the historical P/E and dividend yields of the market.
Weekly Highlight:
During the week, KCB Group disclosed that it had entered into an agreement with Atlas Mara Limited (ATMA) to acquire 62.1% stake in Banque De Populaire du Rwanda (BPR) in Rwanda and 100.0% stake in African Banking Corporation Ltd Tanzania (ABC Tanzania).
Key to note, Equity Group had previously entered into a binding agreement in April 2019 with Atlas Mara on the acquisition of banking assets in four countries (Rwanda, Tanzania, Zambia and Mozambique); 62.0% of the share capital of Banque Populaire du Rwanda (BPR); 100.0% of the share capital of Africa Banking Corporation Zambia (ABCZam) Ltd; 100.0% of the share capital of Africa Banking Corporation Tanzania (ABCTz); and, 100.0% of the share capital of Africa Banking Corporation Mozambique Ltd (ABCMoz). The transaction was to be funded by a share swap whereby Atlas Mara would be allotted Kshs 252.5 mn shares of Equity Group, equivalent to a 6.7% stake valued at about Kshs 8.9 bn using the closing price of Kshs 35.1 on 26th June 2020 and effectively valuing Equity Group at Kshs 132.3 bn. However, as highlighted in our Cytonn Weekly #26/2020, in June 2020, the two parties mutually agreed to call off the acquisition plans as the Group was working to enhance their strategy following the COVID-19 pandemic which involved conserving cash and having liquidity.
In the 62.1% BPR acquisition, KCB will pay a cash consideration based on the net asset value of the BPR at completion of the transaction using a price to book multiple of 1.1x. Key to note, according to the latest BPR financials, the bank had a book value of Rwf 46.6 bn (Kshs 5.2 bn), and thus at the trading multiple of 1.1x, we estimate KCB will have to part with Kshs 5.7 bn. The Group also separately intends to make an offer to acquire the remaining shares from the respective shareholders. The proposed acquisition is subject to approval from the shareholders, the Central Bank of Kenya, the National Bank of Rwanda, the COMESA Competition Commission and the Capital Markets Authority. KCB has also agreed to purchase 96.6% stake of ABC Tanzania held by ABC Holdings Limited (ABCH), the wholly owned subsidiary of Atlas Mara. Additionally, KCB separately intends to make an offer to acquire the remaining shares of 3.4% from the Tanzania Development Finance Company Limited. Subject to the approval of the shareholders and the regulatory authorities in Kenya and Tanzania, the current price to book multiple for the acquisition stands at 0.4x.
In our view, the proposed acquisition of the banks by KCB Group will see the group increase its footprint in the region in line with its expansion strategy. Additionally, the acquisitions will present an opportunity for increased profitability as the bank expects the two banks to help drive business growth in the future. We believe that this deal will lead to the growth in the Group’s interest income which stood at Kshs 63.3 bn in Q3’2020 given that both banks being acquired rely heavily on funded income at a mix of 76:24 for BPR and 84:16 for ABC Tanzania according to their H1’2020 results. Key to note, BPR recorded a profit after tax (PAT) of Rwf 2.2 bn (Kshs 243.2 mn) in H1’2020, a 65.2% increase from Rwf 1.3 bn (Kshs 147.2 mn) in H1’2019. ABC Tanzania, on the other hand, recorded losses of Tshs 46.4 mn (Kshs 2.2 mn) in H1’2020, from Tshs 2.7 bn (Kshs 126.1 mn) losses recorded in H1’2019. Given the poor performance of ABC Tanzania over the years, we believe that the acquisition might be a net negative for the Group in the short term, as the Group works towards saving the struggling bank, additionally, at an acquisition multiple of 1.1x book, it appears expensive given the recent acquisition multiple average of 0.8x over the last 3 years.
Below is a summary of the deals in the last 5-years that have either happened, been announced, or expected to be concluded;
|
Acquirer |
Bank Acquired |
Book Value at Acquisition (Kshs. Bns) |
Transaction Stake |
Transaction Value |
P/Bv Multiple |
Date |
|
KCB Group |
Banque Commerciale Du Congo |
5.2 |
62.1% |
5.7 |
1.1x |
Nov-20* |
|
KCB Group |
ABC Tanzania |
Unknown |
100.0% |
Undisclosed |
0.4x |
Nov-20* |
|
Co-operative Bank |
Jamii Bora Bank |
3.4 |
90.0% |
1 |
0.3x |
Aug-20 |
|
Commercial International Bank |
Mayfair Bank Limited |
1 |
51.0% |
Undisclosed |
N/D |
May-20* |
|
Access Bank PLC (Nigeria) |
Transnational Bank PLC. |
1.9 |
100.0% |
1.4 |
0.7x |
Feb-20* |
|
Equity Group ** |
Banque Commerciale Du Congo |
8.9 |
66.5% |
10.3 |
1.2x |
Nov-19* |
|
KCB Group |
National Bank of Kenya |
7 |
100.0% |
6.6 |
0.9x |
Sep-19 |
|
CBA Group |
NIC Group |
33.5 |
53%:47% |
23 |
0.7x |
Sep-19 |
|
Oiko Credit |
Credit Bank |
3 |
22.8% |
1 |
1.5x |
Aug-19 |
|
CBA Group** |
Jamii Bora Bank |
3.4 |
100.0% |
1.4 |
0.4x |
Jan-19 |
|
AfricInvest Azure |
Prime Bank |
21.2 |
24.2% |
5.1 |
1.0x |
Jan-18 |
|
KCB Group |
Imperial Bank |
Unknown |
Undisclosed |
Undisclosed |
N/A |
Dec-18 |
|
SBM Bank Kenya |
Chase Bank Ltd |
Unknown |
75.0% |
Undisclosed |
N/A |
Aug-18 |
|
DTBK |
Habib Bank Kenya |
2.4 |
100.0% |
1.8 |
0.8x |
Mar-17 |
|
SBM Holdings |
Fidelity Commercial Bank |
1.8 |
100.0% |
2.8 |
1.6x |
Nov-16 |
|
M Bank |
Oriental Commercial Bank |
1.8 |
51.0% |
1.3 |
1.4x |
Jun-16 |
|
I&M Holdings |
Giro Commercial Bank |
3 |
100.0% |
5 |
1.7x |
Jun-16 |
|
Mwalimu SACCO |
Equatorial Commercial Bank |
1.2 |
75.0% |
2.6 |
2.3x |
Mar-15 |
|
Centum |
K-Rep Bank |
2.1 |
66.0% |
2.5 |
1.8x |
Jul-14 |
|
GT Bank |
Fina Bank Group |
3.9 |
70.0% |
8.6 |
3.2x |
Nov-13 |
|
Average |
|
|
75.2% |
|
1.2x |
|
|
* Announcement Date ** Deals that were dropped |
||||||
Earnings Releases:
During the week, NCBA Group, Diamond Trust Bank Kenya (DTB-K) and, Stanbic Bank released their Q3’2020 financial results. Below is a summary of their performance;
- NCBA Group
*Note that the figures for Q3’2019 are combined from CBA’s and NIC’s Q3’2019 releases.
|
NCBA Group Q3’2020 Key Highlights |
|||
|
Balance Sheet |
|||
|
Balance Sheet Items |
Q3’2019 (Kshs bn) |
Q3’2020 (Kshs bn) |
y/y change |
|
Government Securities |
147.7 |
166.2 |
12.5% |
|
Net Loans and Advances |
248.8 |
249.7 |
0.4% |
|
Total Assets |
487.9 |
519.2 |
6.4% |
|
Customer Deposits |
372.4 |
402.6 |
8.1% |
|
Deposits per Branch |
4.5 |
5.9 |
30.4% |
|
Total Liabilities |
416.9 |
448.5 |
7.6% |
|
Shareholders’ Funds |
70.7 |
70.4 |
(0.4%) |
|
Income Statement |
|||
|
Income Statement Items |
Q3’2019 (Kshs bn) |
Q3’2020 (Kshs bn) |
y/y change |
|
Net Interest Income |
16.1 |
17.0 |
5.3% |
|
Net non-Interest Income |
14.4 |
16.1 |
11.8% |
|
Total Operating income |
30.5 |
33.1 |
8.4% |
|
Loan Loss provision |
4.3 |
13.4 |
210.6% |
|
Total Operating expenses |
18.9 |
28.6 |
51.2% |
|
Profit before tax |
10.9 |
3.8 |
(65.3%) |
|
Profit after tax |
7.7 |
2.5 |
(67.3%) |
|
Core EPS |
5.1 |
1.7 |
(67.3%) |
|
Key Ratios |
|||
|
Ratios |
Q3’2019 |
Q3’2020 |
% point change |
|
Yield on Interest Earning Assets |
9.7% |
6.1% |
(3.6%) |
|
Cost of Funding |
4.6% |
3.1% |
(1.5%) |
|
Net Interest Margin |
5.0% |
3.1% |
(1.9%) |
|
Non-Performing Loans (NPL) Ratio |
12.4% |
14.1% |
1.7% |
|
NPL Coverage |
60.2% |
58.3% |
(1.9%) |
|
Cost to Income with LLP |
62.0% |
86.5% |
24.5% |
|
Loan to Deposit Ratio |
66.8% |
63.0% |
(3.8%) |
|
Cost to Income Without LLP |
48.0% |
46.2% |
(1.8%) |
|
Return on Average Assets |
14.9% |
3.9% |
(11.0%) |
|
Return on Average Equity |
2.2% |
0.5% |
(1.7%) |
|
Equity to Assets Ratio |
14.5% |
13.6% |
(0.9%) |
|
Capital Adequacy Ratios |
|||
|
Ratios |
Q3’2019 |
Q3’2020 |
% point change |
|
Core Capital/Total Liabilities |
17.2% |
16.9% |
(0.3%) |
|
Minimum Statutory ratio |
8.0% |
8.0% |
0.0% |
|
Excess / Deficit |
9.2% |
8.9% |
(0.3%) |
|
Core Capital/Total Risk Weighted Assets |
16.6% |
18.1% |
1.5% |
|
Minimum Statutory ratio |
10.5% |
10.5% |
0.0% |
|
Excess / Deficit |
6.1% |
7.6% |
1.5% |
|
Total Capital/Total Risk Weighted Assets |
17.5% |
18.6% |
1.1% |
|
Minimum Statutory ratio |
14.5% |
14.5% |
0.0% |
|
Excess / Deficit |
3.0% |
4.1% |
1.1% |
Key take-outs from the earnings release include;
- Core earnings per share declined by 67.3% to Kshs 1.7 from Kshs 5.1 in Q3’2019 which was not in line with our projections of an 88.9% decline to Kshs 0.6. The variance can be attributed to our expectations of a 17.7% decline in total operating income, which was not in line with the actual of 8.4%. The performance can be attributed to an 8.4% increase in total operating income, but was weighed down by the 51.2% growth in total operating expenses,
- Interest income rose by 4.8% to Kshs 31.2 bn, from Kshs 29.8 bn in Q3’2019. This was mainly driven by a 17.3% rise in interest income from government securities to Kshs 12.6 bn from Kshs 10.8 bn in Q3’2019. This was however weighed down by a 2.0% decline in interest income from loans and advances to Kshs 17.9 bn, from Kshs 18.3 bn, and a 17.4% decline in other interest income to Kshs 80.3 mn in Q3’2020, from Kshs 97.2 mn.
- Yield on interest-earning assets declined to 6.1% in Q3’2020 from 9.7% in Q3’2019, attributable to the faster 6.8% growth in average interest-earning assets to Kshs 436.7 bn from Kshs 408.7 bn in Q3’2019, compared to the 31.8% decline in trailing Interest Income,
- Interest expense rose by 4.1% to Kshs 14.2 bn from Kshs 13.6 bn in Q3’2019, mainly attributable to a 10.3% increase in interest expense on customer deposits to Kshs 12.7 bn from Kshs 11.5 bn in Q3’2019, but the increase was mitigated by the 35.3% decline in in other interest expenses to Kshs 1.1 bn in Q3’2020, from Kshs 1.8 bn the previous year. Cost of funds fell to 3.1% from 4.6% in Q3’2019 owing to a 28.9% decline in trailing interest expense compared to the 8.4% growth recorded on average interesting bearing liabilities to Kshs 420.0 bn in Q3’2020, from Kshs 387.3 bn in Q3’2019,
- Total operating expenses rose by 51.2% to Kshs 28.6 bn, from Kshs 18.9 bn in Q3’2019, largely driven by the 210.6% increase in loan loss provision to Kshs 13.4 bn in Q3’2020 from Kshs 4.3 bn in Q3’2019, coupled with other operating expenses which rose by 18.4% to Kshs 10.0 bn in Q3’2020 from Kshs 8.4 bn in Q3’2019,
- The balance sheet recorded an expansion with a total assets growth of 6.4% to Kshs 519.2 bn from Kshs 487.9 bn in Q3’2019. This growth was largely driven by a 12.5% increase in government securities to Kshs 166.2 bn, from the Kshs 147.7 bn recorded in Q3’2019. The loan book on the other hand expanded by 0.4% to Kshs 249.7 bn in Q3’2020 from Kshs 248.8 bn in Q3’2019,
- Total liabilities rose by 7.6% to Kshs 448.5 bn from Kshs 416.9 bn in Q3’2019, driven by an 8.1% increase in customer deposits to Kshs 402.6 bn from Kshs 372.4 bn in Q3’2019. Placements increased by 48.5% from the Kshs 7.9 bn recorded in Q3’2019 to Kshs 11.7 bn in Q3’2020. Deposits per branch increased by 30.4% from Kshs 4.5 bn, to Kshs 5.9 bn in Q3’2020, with the number of branches declining to 68 from 82 branches,
- Gross non-performing loans (NPLs) rose by 15.3% to Kshs 38.4 bn in Q3’2020 from Kshs 30.3 bn in Q3’2019. Consequently, the NPL ratio deteriorated to 14.1% in Q3’2020 from 12.4% in Q3’2019 attributable to the faster 15.3% rise in NPLs that outpaced the 1.2% increase in gross loans which came in at Kshs 272.1 bn in Q3’2020, from the Kshs 268.8 bn in Q3’2019,
- NPL Coverage ratio dropped to 58.3% from 60.2%, which could suggest an under-provisioning. Had NPL Coverage remained at the 60.2% level recorded in Q3’2019, we would have had an additional provisioning of Kshs 0.7 bn, which would have reduced Earnings per Share (EPS) from the reported Kshs 1.7 to Kshs 1.2, and,
- NCBA Group is currently sufficiently capitalized with a core capital to risk weighted assets ratio of 18.1%, 7.6% above the statutory requirement. In addition, the total capital to risk weighted assets ratio was 18.6%, exceeding the statutory requirement by 4.1%.
For a comprehensive analysis, please see our NCBA Group Q3’2020 Earnings Note
- Diamond Trust Bank
|
Diamond Trust Bank Q3’2020 Key Highlights |
|||
|
Balance Sheet |
|||
|
Balance Sheet Items |
Q3’2019 (Kshs bn) |
Q3’2020 (Kshs bn) |
y/y change |
|
Government Securities |
127.5 |
134.1 |
5.1% |
|
Net Loans and Advances |
192.0 |
205.6 |
7.1% |
|
Total Assets |
382.5 |
394.0 |
3.0% |
|
Customer Deposits |
283.1 |
288.2 |
1.8% |
|
Deposits per Branch |
2.1 |
2.1 |
0.0% |
|
Total Liabilities |
317.8 |
324.9 |
2.2% |
|
Shareholders’ Funds |
58.9 |
62.8 |
6.6% |
|
Income Statement |
|||
|
Income Statement Items |
Q3’2019 (Kshs bn) |
Q3’2020 (Kshs bn) |
y/y change |
|
Net Interest Income |
13.8 |
13.9 |
0.9% |
|
Net non-Interest Income |
4.4 |
5.0 |
15.3% |
|
Total Operating income |
18.2 |
18.9 |
4.4% |
|
Loan Loss provision |
0.9 |
2.9 |
232.1% |
|
Total Operating expenses |
9.5 |
12.4 |
30.4% |
|
Profit before tax |
8.7 |
6.6 |
(24.0%) |
|
Profit after tax |
6.0 |
4.3 |
(27.8%) |
|
Core EPS |
21.4 |
15.5 |
(27.8%) |
|
Key Ratios |
|||
|
Ratios |
Q3’2019 |
Q3’2020 |
% point change |
|
Yield on Interest Earning Assets |
9.9% |
9.3% |
(0.6%) |
|
Cost of Funding |
4.6% |
4.2% |
(0.4%) |
|
Net Interest Margin |
5.3% |
5.1% |
(0.2%) |
|
Non-Performing Loans (NPL) Ratio |
8.9% |
8.7% |
(0.2%) |
|
NPL Coverage |
48.0% |
54.7% |
6.7% |
|
Cost to Income with LLP |
52.2% |
65.2% |
13.0% |
|
Loan to Deposit Ratio |
67.8% |
71.4% |
3.6% |
|
Cost to Income Without LLP |
47.4% |
50.0% |
2.6% |
|
Return on Average Assets |
13.4% |
9.2% |
(4.2%) |
|
Return on Average Equity |
1.4% |
1.4% |
0.0% |
|
Equity to Assets Ratio |
15.4% |
15.9% |
0.5% |
|
Capital Adequacy Ratios |
|||
|
Ratios |
Q3’2019 |
Q3’2020 |
% point change |
|
Core Capital/Total Liabilities |
21.0% |
23.3% |
2.3 |
|
Minimum Statutory ratio |
8.0% |
8.0% |
0.0% |
|
Excess/Deficit |
13.0% |
15.3% |
2.3% |
|
Core Capital/Total Risk Weighted Assets |
19.1% |
19.2% |
0.1% |
|
Minimum Statutory ratio |
10.5% |
10.5% |
0.0% |
|
Excess/Deficit |
8.6% |
8.7% |
0.1% |
|
Total Capital/Total Risk Weighted Assets |
21.2% |
20.8% |
(0.4%) |
|
Minimum Statutory ratio |
14.5% |
14.5% |
0.0% |
|
Excess/Deficit |
6.7% |
6.3% |
(0.4%) |
The bank’s core earnings per share declined by 27.8% to Kshs 15.5, from Kshs 21.4 in Q3’2019, which was not in line with our expectation of a 41.2% decline to Kshs 12.6 per share. The variance was mainly attributable to the 4.4% rise in total operating income, against our expectations of an 8.9% decline. The bank’s performance was driven by the 30.4% rise in total operating expenses, which outweighed the 4.4% increase in total operating income,Key take-outs from the earnings release include;
- Interest income declined by 3.4% to Kshs 23.7 bn from Kshs 24.5 bn in Q3’2019. This was driven by a 3.3% decline in interest income from loans and advances to Kshs 14.3 bn from Kshs 14.8 bn in Q3’2019, coupled with the 1.1% decline in interest income from deposit placements to Kshs 9.2 bn, from Kshs 9.3 bn in Q3’2019,
- The yield on interest-earning assets declined as well to 9.3% from 9.9% in Q3’2019, attributable to the faster 5.3% increase in average interest-earning assets to Kshs 351.4 bn, from Kshs 333.8 bn in Q3’2019, despite a 3.9% decline in trailing interest income,
- Interest expense declined by 8.9% to Kshs 9.8 bn from Kshs 10.7 bn in Q3’2019, following an 11.8% decline in interest expense on placement liabilities to Kshs 487.2mn from Kshs 552.6 mn in Q3’2019, coupled with an 8.3% decline in interest expense on customer deposits to Kshs 8.4 bn, from Kshs 9.2 bn in Q3’2019. Cost of funds, declined to 4.2% from 4.6% in Q3’2019, owing to the 8.9% decline in interest expenses, against a slower 1.8% growth in interest-bearing liabilities, an indication that the bank managed to mobilize cheaper deposits,
- Total operating expenses rose by 30.4% to Kshs 12.4 bn, from Kshs 9.5 bn in Q3’2019, largely driven by the 232.1% increase in Loan Loss Provisions (LLP) to Kshs 2.9 bn from Kshs 0.9 bn in Q3’2019. Other expenses rose by 12.6%, to Kshs 5.9 bn from Kshs 5.2 bn in Q3’2019, and staff costs which increased by 5.9% to Kshs 3.6 bn, from Kshs 3.4 bn,
- The balance sheet recorded an expansion as total assets increased by 3.0% to Kshs 394.0 bn from Kshs 382.5 bn in Q3’2019. This growth was largely driven by a 7.1% increase in net loans to Kshs 205.6 bn from Kshs 192.0 bn in Q3’2019, coupled with a 5.1% increase in government securities to Kshs 134.1 bn from Kshs 127.5 bn in Q3’2019. The growth in assets was however slowed down by a 19.9% decline in cash and bank placements to Kshs 22.4 bn from Kshs 28.0 bn in Q3’2019,
- Total liabilities also rose by 2.2% to Kshs 324.9 bn from Kshs 317.8 bn in Q3’2019, driven by a 60.8% increase in borrowings to Kshs 20.2 bn from Kshs 12.6 bn in Q3’2019, coupled with a 1.8% increase in deposits to Kshs 288.2 bn from Kshs 283.1 bn in Q3’2019. Key to note, the bank has three long-term subordinate debts facilities from the International Finance Corporation (IFC) and African Development Bank amounting to USD 46.0 mn (Kshs 5.0 bn). The growth in total liabilities was weighed down by the 35.6% decline in placements to Kshs 9.2 bn from Kshs 14.3 bn in Q3’2019. Deposits per branch remained unchanged at Kshs 2.1 bn, as the number of branches remained unchanged at 137 in Q3’2020,
- Gross Non-Performing Loans (NPLs) rose by 3.4% to Kshs 18.5 bn in Q3’2020 from Kshs 17.9 bn in Q3’2019. Consequently, the NPL ratio improved to 8.7% in Q3’2020, from 8.9% in Q3’2019, due to the faster 11.2% growth in gross loans which outpaced the 3.4% growth in gross NPLs,
- The Banks NPL coverage (having added interest in suspense) increased to 54.7% in Q3’2020 from 48.0% in Q3’2019, owing to the faster 86.4% growth in interest suspense to Kshs 5.3 bn from Kshs 2.8 bn in Q3’2019, that outpaced the 25.0% growth in Gross NPLs, and,
- Diamond Trust Bank is currently sufficiently capitalized with a core capital to risk-weighted assets ratio of 19.2%, 8.7% points above the statutory requirement. In addition, the total capital to risk-weighted assets ratio was 20.8%, exceeding the 14.5% statutory requirement by 6.3% points.
For a comprehensive analysis, please see our Diamond Trust Bank Kenya Q3’2020 Earnings Note
III. Stanbic Bank
|
Stanbic Bank Q3’2020 Key Highlights |
|||
|
Balance Sheet |
|||
|
Balance Sheet Items |
Q3’2019 (Kshs bn) |
Q3’2020 (Kshs bn) |
y/y change |
|
Government Securities |
27.0 |
55.1 |
103.8% |
|
Net Loans and Advances |
161.7 |
158.9 |
(1.8%) |
|
Total Assets |
294.3 |
317.8 |
8.0% |
|
Customer Deposits |
191.3 |
226.0 |
18.2% |
|
Deposits per Branch |
7.4 |
8.7 |
18.2% |
|
Total Liabilities |
256.5 |
277.5 |
8.2% |
|
Shareholders’ Funds |
37.8 |
40.3 |
6.6% |
|
Income Statement |
|||
|
Income Statement Items |
Q3’2019 (Kshs bn) |
Q3’2020 (Kshs bn) |
y/y change |
|
Net Interest Income |
9.6 |
8.9 |
(7.3%) |
|
Net non-Interest Income |
8.8 |
7.2 |
(18.2%) |
|
Total Operating income |
18.4 |
16.1 |
(12.5%) |
|
Loan Loss provision |
(1.7) |
(2.9) |
70.6% |
|
Total Operating expenses |
(11.7) |
(10.7) |
(8.5%) |
|
Profit before tax |
5.9 |
5.4 |
(8.5%) |
|
Profit after tax |
5.1 |
3.6 |
(30.1%) |
|
Core EPS |
12.2 |
9.0 |
(30.1%) |
|
Key Ratios |
|||
|
Ratios |
Q3’2019 |
Q3’2020 |
% point change |
|
Yield on Interest Earning Assets |
8.2% |
5.6% |
(2.6%) |
|
Cost of Funding |
2.5% |
2.4% |
(0.1%) |
|
Net Interest Margin |
7.3% |
5.9% |
(1.4%) |
|
Non-Performing Loans (NPL) Ratio |
10.9% |
12.3% |
1.4% |
|
NPL Coverage |
58.9% |
61.8% |
2.9% |
|
Cost to Income with LLP |
63.5% |
66.3% |
2.8% |
|
Loan to Deposit Ratio |
84.6% |
70.3% |
(14.3%) |
|
Cost to Income Without LLP |
54.4% |
48.1% |
(6.3%) |
|
Return on Average Assets |
22.3% |
12.0% |
(10.3%) |
|
Return on Average Equity |
2.9% |
1.8% |
(1.1%) |
|
Equity to Assets Ratio |
12.8% |
12.7% |
(0.1%) |
|
Capital Adequacy Ratios |
|||
|
Ratios |
Q3’2019 |
Q3’2020 |
% point change |
|
Core Capital/Total Liabilities |
17.2% |
17.1% |
(0.1%) |
|
Minimum Statutory ratio |
8.0% |
8.0% |
0.0% |
|
Excess / Deficit |
9.2% |
9.1% |
(0.1%) |
|
Core Capital/Total Risk Weighted Assets |
13.9% |
15.5% |
1.6% |
|
Minimum Statutory ratio |
10.5% |
10.5% |
0.0% |
|
Excess / Deficit |
3.4% |
5.0% |
1.6% |
|
Total Capital/Total Risk Weighted Assets |
17.2% |
17.7% |
0.5% |
|
Minimum Statutory ratio |
14.5% |
14.5% |
0.0% |
|
Excess / Deficit |
2.7% |
3.2% |
0.5% |
Key take-outs from the earnings release include;
- Profit after tax declined by 30.1% to Kshs 3.6 bn in Q3’2020, from Kshs 5.1 bn in Q3’2019. The performance was driven by a 12.5% decline in total operating income from Kshs 16.1 bn, from Kshs 18.4 bn in Q3’2019. The decline was however mitigated by the 3.4% decline in the interest expense to Kshs 5.6 bn from Kshs 5.8 bn in Q3’2019,
- Interest income declined by 5.2% to Kshs 14.6 bn in Q3’2020, from Kshs 15.4 bn in Q3’2019. This was largely due to the 8.5% decline on interest income on loans and advances to Kshs 10.7 bn in Q3’2020, from Kshs 11.7 bn in Q3’2019. The yield on interest-earning assets declined as well to 9.3% from 9.9% in Q3’2019, attributable to the faster 5.3% increase in average interest-earning assets to Kshs 351.4 bn, from Kshs 333.8 bn in Q3’2019, despite the 3.9% decline in trailing interest income,
- Interest expense declined by 3.4% to Kshs 5.6 bn from Kshs 5.8 bn in Q3’2019, following a 66.7% decline in Interest expense on deposits and placements from banking institutions, to Kshs 0.4 bn from Kshs 1.2 bn in Q3’2019. The decline was however mitigated by the 15.0% increase in the interest expense on customer deposits to Kshs 4.6 bn from Kshs 4.0 bn in Q3’2019. Cost of funds, on the other hand, declined marginally by 0.2% points to 2.4%, from 2.5% in Q3’2019, owing to the faster 7.0% growth in average interest bearing liabilities, despite a 3.4% decline in trailing interest expense,
- Total operating expenses declined by 8.5% to Kshs 10.7 bn in Q3’2020 from Kshs 11.7 bn in Q3’2019, largely driven by a 7.0% decline in the staff costs to Kshs 4.0 bn from Kshs 4.3 bn in Q3’2019. Depreciation on property and equipment, however rose by 8.6% to Kshs 0.62 bn from Kshs 0.58 bn in Q3’2019,
- The balance sheet recorded an expansion as total assets rose by 8.0% to Kshs 317.8 bn from Kshs 294.3 bn in Q3’2019. This growth was largely driven by a 103.8% increase in the government securities to Kshs 55.1 bn from Kshs 27.0 bn in Q3’2019. The growth was however slowed down by a sharp decline in placements by 75.6% to Kshs 1.1 bn from Kshs 4.5 bn in Q3’2019, coupled with a 1.8% decline in the loan book to Kshs 158.9 bn, from Kshs 161.7 bn in Q3’2019,
- Total liabilities rose by 8.2% to Kshs 277.5 bn from Kshs 256.5 bn in Q3’2019, largely driven by a 72.2% increase in other liabilities to Kshs 18.6 bn in Q3’2020 from Kshs 10.8 bn in Q3’2019, coupled with a 18.1% increase in customer deposits to Kshs 226.0 bn in Q3’2020 from Kshs 191.3 bn in Q3’ 2019.The increase was however weighed down by a 32.3% decline in borrowings to Kshs 8.4 bn from Kshs 12.4 bn in Q3’2019, following the Kshs 1.5 bn payment made to a corporate customer that had taken out a contract to protect itself against default by its partner in international trade,
- Gross Non-Performing Loans (NPLs) increased by 21.2% to Kshs 21.2 bn in Q3’2020, from Kshs 18.9 bn in Q3’2019. The NPL ratio thus, increased to 12.3% in Q3’2020 from 10.9% in Q3’2019, attributable to the faster 12.1% growth in Gross Non-Performing Loans (NPLs), which outpaced the 0.5% decline in Gross Loans,
- The Banks NPL coverage increased to 61.8% in Q3’2020 from 58.9% in Q3’2019 mainly due to the 12.2% growth in Non-performing loans to Kshs 21.2 bn from Kshs 18.9 bn in Q3’2019 which outpaced the growth in loan loss provision, and,
- Stanbic Bank is currently sufficiently capitalized with a core capital to risk weighted assets ratio of 15.5%, 5.0% points above the statutory requirement. In addition, the total capital to risk weighted assets ratio was 17.7%, exceeding the statutory requirement by 3.2% points.
For a comprehensive analysis, please see our Stanbic Bank Kenya Q3’2020 Earnings Note
Asset Quality:
|
Bank |
Q3’2019 NPL Ratio |
Q3’2020 NPL Ratio |
Q3’2019 NPL Coverage |
Q3’2020 NPL Coverage |
|
KCB Group |
8.3% |
15.3% |
56.5% |
58.5% |
|
NCBA Group |
12.4% |
14.1% |
60.2% |
58.3% |
|
Standard Chartered Bank Kenya |
14.9% |
14.8% |
77.0% |
78.2% |
|
Co-operative Bank of Kenya |
10.5% |
13.2% |
55.5% |
50.1% |
|
Stanbic Bank |
10.9% |
12.3% |
58.9% |
61.8% |
|
Equity Group |
8.4% |
10.8% |
45.8% |
52.0% |
|
Diamond Trust Bank |
8.9% |
8.7% |
48.0% |
62.5% |
|
ABSA Bank Kenya |
6.8% |
7.6% |
78.6% |
64.9% |
|
Mkt Weighted Average |
9.8%** |
12.5%* |
57.8%** |
58.7%* |
|
*Market cap weighted as at 27/11/2020 **Market cap weighted as at 29/11/2019 |
||||
Key take-outs from the table include;
- Asset quality for the 8 banks that have released their Q3’2020 results deteriorated during the period of review, with the NPL ratio rising by 2.7% points to a market cap weighted average of 12.5% from 9.8% in Q3’2019. The deterioration in asset quality was as a result of the coronavirus-induced downturn in the economy which led to an uptick in the non-performing loans,
- NPL Coverage has risen to a market cap weighted average of 58.7% in Q3’2020 from 57.8% recorded in Q3’2019, as the banks increased their provisioning levels to proactively manage risks given the tough economic conditions. We expect higher provisional requirements to subdue profitability during the year across the banking sector on account of the tough business environment, and,
- ABSA, NCBA and COOP recorded a decline in their NPL Coverage despite their NPL ratios rising, which could suggest modest provisioning. Given the current economic environment and elevated risk of loans defaults, we expected high provisioning for the banks. Key to note, during the Co-operative Bank Q3’2020 briefing, management indicated that the decline in the NPL Coverage was attributable to the downgrade on some of the non-performing loan book. The management however indicated that the 123.4% Q/Q and 89.4% Y/Y growth in provisions was an adequate response to the disruption occasioned by the ongoing pandemic more so in the personal consumer sector, which once in a while might not be fully collateralized and as such the Bank had to have higher provisioning for them due to the risk.
The table below highlights the performance of the banks that have released so far, showing the performance using several metrics, and the key take-outs of the performance.
|
Bank |
Core EPS Growth |
Interest Income Growth |
Interest Expense Growth |
Net Interest Income Growth |
Net Interest Margin |
Non-Funded Income Growth |
NFI to Total Operating Income |
Growth in Total Fees & Commissions |
Deposit Growth |
Growth in Government Securities |
Loan to Deposit Ratio |
Loan Growth |
Return on Average Equity |
|
NCBA |
(67.3%) |
4.8% |
4.1% |
5.3% |
3.2% |
11.8% |
48.7% |
47.7% |
8.1% |
12.5% |
63.0% |
0.4% |
3.9% |
|
ABSA |
(65.4%) |
1.4% |
0.8% |
1.6% |
7.1% |
4.5% |
32.7% |
(10.7%) |
4.7% |
13.1% |
84.9% |
7.8% |
15.2% |
|
KCB |
(43.2%) |
23.0% |
20.8% |
23.7% |
7.8% |
1.5% |
30.8% |
(14.2%) |
31.7% |
83.9% |
74.7% |
18.7% |
13.1% |
|
SCBK |
(30.4%) |
(5.8%) |
(17.3%) |
(2.4%) |
7.0% |
(8.8%) |
31.1% |
(9.7%) |
8.0% |
7.6% |
54.2% |
11.2% |
12.9% |
|
Stanbic |
(30.2%) |
(5.4%) |
(3.1%) |
(7.3%) |
5.9 |
(18.4%) |
44.5% |
(33.3%) |
18.2% |
103.8% |
70.3% |
7.5% |
12.0% |
|
DTB-K |
(27.80%) |
(3.4%) |
(8.9%) |
0.9% |
5.5% |
15.3% |
26.6% |
17.7% |
1.8% |
5.1% |
71.4% |
7.1% |
9.2% |
|
Equity |
(13.9%) |
21.7% |
21.6% |
21.8% |
7.6% |
10.1% |
38.7% |
(1.3%) |
44.5% |
37.2% |
65.7% |
30.1% |
16.9% |
|
CO-OP |
(10.2%) |
7.1% |
(3.5%) |
11.7% |
8.0% |
(3.5%) |
36.5% |
(31.7%) |
16.4% |
50.5% |
75.7% |
5.7% |
16.4% |
|
Q3'20 Mkt Weighted Average* |
(32.7%) |
11.4% |
8.1% |
12.6% |
7.1% |
2.3% |
35.9% |
(7.9%) |
24.1% |
45.7% |
64.9% |
15.5% |
13.8% |
|
Q3'19Mkt Weighted Average** |
8.7% |
4.5% |
4.3% |
4.9% |
7.7% |
15.8% |
37.9% |
22.6% |
11.0% |
3.3% |
75.7% |
11.6% |
19.3% |
|
*Market-cap-weighted as at 27/11/2020 |
|||||||||||||
|
**Market-cap-weighted as at 29/11/2019 |
|||||||||||||
Key takeaways from the table above include:
- For the eight banks that have released, they have recorded a (32.7%) weighted average decline in core Earnings Per Share (EPS), compared to a weighted average growth of 8.7% in Q3’2019 for the entire listed banking sector,
- The Banks have recorded a weighted average deposit growth of 24.1%, faster than the 11.0% growth recorded in Q3’2019,
- Interest expense, on the other hand, grew faster by 8.1%, compared to 4.3% in Q3’2019. Cost of funds, however, declined, coming in at a weighted average of 2.8% in Q3’2020, from 3.1% in Q3’2019, owing to the faster growth in average interest-bearing liabilities, an indication that the listed banks were able to mobilize cheaper deposits,
- Average loan growth came in at 15.5%, faster than the 11.6% recorded in Q3’2019, but slower than the 45.7% growth in government securities, an indication of the banks preference of investing in Government securities as opposed to lending due to the elevated credit risk occasioned by the pandemic,
- Interest income rose by 11.4%, compared to a growth of 4.5% recorded in Q3’2019. Despite the rise in interest income, the Yield on Interest Earning Assets (YIEA) declined to 9.5% from the 10.3% recorded in Q3’2019, an indication of the increased allocation to lower-yielding government securities by the sector. The decline in the YIEA can also be attributed to the reduced lending rates for customers by the sector, in line with the Central Bank Rate cuts. Consequently, the Net Interest Margin (NIM) now stands at 7.1%, 0.6% points lower than the 7.7% recorded in Q3’2019 for the whole listed banking sector, and,
- Non-Funded Income grew by 2.3% y/y, slower than 15.8% growth recorded in Q3’2019. The performance in NFI was on the back of declined growth in fees and commission of (7.9%), which was slower than the 22.6% growth recorded in Q3’2019. The poor performance of the growth in fees and commission can be attributed to the waiver on fees on mobile transactions below Kshs 1,000 and the free bank-mobile money transfer. Banks with a large customer base who rely heavily on mobile money transactions are likely to take the biggest hit.
Universe of Coverage:
We are currently reviewing our target prices for the Banking Sector coverage.
|
Company |
Price at 20/11/2020 |
Price at 27/11/2020 |
w/w change |
YTD Change |
Year Open |
Target Price* |
Dividend Yield |
Upside/ Downside** |
P/TBv Multiple |
Recommendation |
|
Kenya Reinsurance |
2.1 |
2.1 |
0.0% |
(30.0%) |
3.0 |
4.0 |
5.2% |
93.9% |
0.2x |
Buy |
|
Sanlam |
11.6 |
11.0 |
(5.2%) |
(36.0%) |
17.2 |
18.4 |
0.0% |
67.3% |
1.2x |
Buy |
|
Liberty Holdings |
7.5 |
7.5 |
0.0% |
(27.5%) |
10.4 |
9.8 |
0.0% |
30.7% |
0.6x |
Buy |
|
Britam |
7.5 |
7.2 |
(3.7%) |
(20.0%) |
9.0 |
8.6 |
3.5% |
22.9% |
0.8x |
Buy |
|
Jubilee Holdings |
266.0 |
280.0 |
5.3% |
(20.2%) |
351.0 |
313.8 |
3.2% |
15.3% |
0.5x |
Accumulate |
|
CIC Group |
2.1 |
2.1 |
(0.5%) |
(23.1%) |
2.7 |
2.1 |
0.0% |
1.9% |
0.7x |
Lighten |
|
*Target Price as per Cytonn Analyst estimates **Upside/ (Downside) is adjusted for Dividend Yield ***For Disclosure, these are banks in which Cytonn and/ or its affiliates are invested in |
||||||||||
We are “Neutral” on equities for investors because, despite the sustained price declines, which have seen the market P/E decline to below its historical average presenting investors with attractive valuations in the market. The economic outlook remains grim.
I. Residential Sector
During the week, Hydro Developers Limited, a real estate developer based in Nairobi, partnered with the Kenyan government for the construction of approximately 30,489 affordable units under the Big Four Agenda, at a cost of Kshs 3.0 bn. The project dubbed Hydro City, will sit on a 302acre piece of land in Kamiti area along the Northern Bypass Road in Kiambu County. The project will comprise of 10,166 studio units of 31 SQM, 9,384 one-bedroom units of 45 SQM, 6,256 two-bedroom units of 62 SQM and 4,692 three-bedroom units of 91 SQM (specific unit prices are yet to be disclosed). Kiambu County is one of the areas that the government enlisted that will be used in the implementation of the affordable housing projects, others being, Machakos County, Lang’ata Sub-County and Starehe Sub-County. Focus on Kiambu county is mainly supported by; i) positive demographics having recorded a population growth of rate 48.9% from 1,623,282 in 2009 to 2,417,735 in 2019 according to the population and housing censure report by the Kenya National Bureau of Statistics (KNBS), ii) relatively good transport network as the area is served by the Northern Bypass, Thika Super Highway and Kamiti Road, iii) availability of land in bulk, and, iv) recognition of Kiambu as Nairobi’s dormitory thus hosting a huge working class population.
Hydro City will be the third Public Private Partnership (PPP) project under the affordable housing initiative, with some of the other projects being River Estate Project in Ngara being developed by Edermann Property Limited, and Pangani Housing Project in Pangani by Tecnofin Kenya Limited. The above partnership is an indication that the government continues to enlist the help of the private sector for development and financing of affordable housing with aim of achieving its target of approximately 500,000 housing units by 2022. However, so far PPPs have not been achieved their full potential due to their ineffectiveness resulting from;
- Regulatory hindrances such as lack of a mechanism to transfer public land to a Special Purpose Vehicle (SPV) to facilitate access to private capital through the use of the land as security,
- Lack of clarity on returns and revenue-sharing,
- The extended time-frame of PPPs while private developers prefer to exit projects within 3-5 years, and,
- Bureaucracy and slow approval processes.
Nevertheless, in our view, the partnership is a stride in the right direction and will drive the supply of affordable housing which is currently lagging behind on its target number of housing units having only delivered approximately 228 housing units so far through the Park Road affordable housing Project in Ngara. Key to note, in some developed countries the private sector developers were key players in resolving the country’s housing deficit, casing point Singapore. It is therefore important for the Kenyan government reviews the current PPP structure to make it more favourable to private developers and thus boost the achievement of the Big Four Agenda on provision of affordable housing.
II. Retail
During the week, Naivas, a local retail chain opened 2 branches one in Hazina towers in Nairobi CBD taking up space previously occupied by Nakumatt Lifestyle and House of Leather which relocated to another location, and the other at Ananas Mall in Thika Town taking up space left behind by struggling retailer, Tuskys . This brings the total number of outlets by the retailer to 68 with 7 outlets opened during this year. The move by the retailer to open the branch in the Nairobi CBD is supported by the relatively high footfall within the CBD and ease of accessibility. On the other hand, the investment in Thika is supported by; i) positive demographics with Thika West having a population of 245,820 as of 2019, a 12.8% growth from the 218,544 recorded in 2009, according to the Kenya National Bureau of Statistics (KNBS) Population and housing census report, iii) a growing middle class with increased consumer purchasing power, and iii) accessibility with the area being served by the Thika Super Highway.
The continued expansion of the local retailer, taking up space left behind by struggling counter parts continues to cushion the real estate retail sector which has continued to feel the pressure of the tough economic environment due to i) reduced demand for retail space as some retailers halt operations to cushion themselves from the effects of the pandemic, ii) reduced revenues amid reduced disposable income among consumers, iii) the shift to e-commerce, and, iv) the existing oversupply in some cities such as Nairobi with a surplus of 3.1 mn SQFT retail space thus resulting in pressure on landlords to provide concessions and other incentives to attract new clientele or retain existing tenants. In terms of performance, according to Cytonn’s Kenya Real Estate Retail Sector Report 2020, the Kenya retail sector recorded subdued performance with the rental yield coming in at 6.7%, 0.3% point lower than 7.0% recorded in 2019. Mt Kenya Region which includes Thika, Meru, Nyeri and Nanyuki was the best performing urban city recording an average rental yield of 7.7%, while Nairobi Metropolitan Area was ranked second with an average rental yield at 7.5%.
The table below shows a summary of 2020 retail performance in key urban cities in Kenya;
(All values in Kshs unless stated otherwise)
|
Summary of Retail Performance in Key Urban Cities in Kenya |
|||
|
Region |
Rent/SQFT 2020 |
Occupancy% 2020 |
Rental Yield 2020 |
|
Mount Kenya |
125.0 |
78.0% |
7.7% |
|
Nairobi |
168.5 |
74.5% |
7.5% |
|
Mombasa |
114.4 |
76.3% |
6.6% |
|
Kisumu |
97.2 |
74.0% |
6.3% |
|
Eldoret |
130.0 |
80.2% |
5.9% |
|
Nakuru |
55.7 |
76.6% |
5.9% |
|
Average |
115.1 |
76.6% |
6.7% |
Source: Cytonn Research
The table below shows the summary of the number of stores of the key local and international retail supermarket chains in Kenya;
|
Main Local and International Retail Supermarket Chains |
||||||
|
Name of Retailer |
Initial number of branches |
Number of branches opened in 2020 |
Closed branches |
Current number of Branches |
Branches expected to be opened / closed |
Projected total number of branches |
|
Naivas Supermarket |
61 |
7 |
0 |
68 |
2 |
70 |
|
Tuskys |
64 |
2 |
14 |
52 |
27 |
25 |
|
QuickMart |
29 |
6 |
0 |
35 |
0 |
35 |
|
Chandarana Foodplus |
19 |
1 |
0 |
20 |
0 |
20 |
|
Carrefour |
7 |
1 |
0 |
8 |
3 |
11 |
|
Uchumi |
37 |
0 |
33 |
4 |
0 |
4 |
|
Game Stores |
2 |
1 |
0 |
3 |
0 |
3 |
|
Choppies |
15 |
0 |
13 |
2 |
0 |
2 |
|
Shoprite |
4 |
0 |
2 |
2 |
0 |
2 |
|
Nakumatt |
65 |
0 |
65 |
0 |
0 |
0 |
|
Total |
303 |
18 |
127 |
194 |
32 |
172 |
Source: Online research
III. Infrastructure
During the week, Kenya Urban Roads Authority (KURA) announced plans to construct two elevated carriage ways in the Nairobi Central Business District (CBD). The Kshs 2.9 bn project which has been assigned to China Road and Bridge Corporation will take shape after the completion of the Nairobi Expressway which is currently under construction by the Kenya National Highways Authority (KENHA), and is expected to be completed by 2023. The carriage ways are expected to be along Valley Road-Kenyatta Avenue junction around Integrity Centre through to the CBD, and Nyerere Road interchange through to UpperHill-Haile Selassie Avenue. One of the carriage ways will be from Integrity Centre to Serena Hotel and the other one will be on the Milimani Close. The two overpasses are intended to link Ngong Road to the CBD. The overpass will be designed to approach the Nairobi Express way at the lower levels thus easing traffic into the CBD through the Kenyatta Avenue and Haile Selassie Avenue.
The implementation of infrastructural projects in Kenya has been affected by the reduced budget allocation through the National Budget to the infrastructural sector. For financial year 2020/2021, the sector was allocated Kshs 172.4 bn, 60.4% lower than the 435.1 bn allocated in the 2019/2020 budget. This is the lowest allocation in the last 10 financial years attributed to a projected revenue shortfall brought about by slowdown in the economy due to disruptions by the COVID-19 pandemic which prompted diversion of funds towards mitigation of the pandemic. Despite the reduced budget allocation, we expect the government to continue with the implementation of selected infrastructural projects thus opening up areas for development hence boosting the real estate sector. On completion, we expect the carriage ways to result in reduced traffic congestion in and out of the CBD thus making it more attractive to real estate investors. Other infrastructural projects underway include the Nairobi Express way, Nairobi-Western Bypass, Lamu Port and Lamu-Southern Sudan-Ethiopia Transport Corridor Project (LAPSSET), and, Mombasa Port Development Project.
We expect the real estate sector to record activities supported by continued implementation of infrastructural projects by the government thus opening up areas for investment, focus on affordable housing which is expected to boost the performance of the residential sector and the ongoing expansion of local retailers which is expected to cushion the performance of the retail sector.
Following the continued depreciation of the Kenya Shilling against the US Dollar and various sentiments being raised in the recent past with regards to currency manipulation, we decided to do a note to demystify the various currency regimes, the mechanisms under which they operate, and how countries use them to ensure currency stability. We shall also focus on the various techniques used to estimate the value of a currency and the factors that have been driving the downward performance of the Kenya shilling.
In our focus on Currency and Interest Rates, where we looked at the factors that were expected to affect the performance of the Kenyan shilling against the US Dollar. We expected the currency and the interest rates to remain under pressure with the currency depreciation to continue. This mainly because of the predicted reduction in export inflows as some of Kenya’s key trading partners had instituted lockdown measures, as well as, a decline in diaspora remittances;
In this focus we shall cover the following:
- A brief history of currency regimes and the various types used by governments globally,
- How to estimate the value of a currency,
- Kenyan foreign exchange markets and recent events,
- Conclusion and Our View Going Forward
Section I: A Brief History of Currency Regimes
An exchange rate can be widely defined as the value of one currency for the purpose of conversion to another. An example, how many Kenyan shillings you would need to acquire one US Dollar. However, just like in the exchange of goods and services, we must take into account what determines that price. As such, the monetary authority of a country or currency union manages the currency in relation to other currencies and the foreign exchange market through exchange rate regimes which are the frameworks under which the price is determined.
Initially, most countries used the gold standard whose value was directly linked to gold and the money supply was tied to their trade balance; but in the 1930s, most countries abandoned it for the Bretton Woods model due to decline in global trading activities. Under this model, the value of the US dollar was pegged on Gold and all the other currencies were pegged on the value of the US dollar.
An ideal currency regime would have three characteristics. First, all the currencies would be freely exchangeable for any purpose and any amount thus ensuring the free flow of capital. Second, the exchange rate between any two currencies would be fixed to eliminate currency-related uncertainties, especially for goods and services. Third, each country would be free to pursue independent monetary policy objectives.
Types of Currency Regimes across the World:
There are three broad exchange regimes used by various governments across the world, these three regimes as explained in depth in our understanding currency regimes note. This include:
- Fixed Exchange Rate Regime -The monetary authority, or the Central Bank of a given country, tries to maintain a currency value that is constant against another country’s currency or a basket of other countries’ currencies or a specific commodity e.g. gold. Examples of countries using a fixed regimes include Saudi Arabia, UAE and Qatar. The purpose of a fixed exchange rate system is to keep a currency's value within a narrow range,
- Floating Exchange Rate Regime - This is a regime where the currency value of a given country is allowed to vary according to the foreign exchange market. An example of this is Kenya where we have a floating regime. The currency fluctuates in relation to what is happening in the market and therefore the rate is determined by the forces of demand and supply. However, there might be periods of intervention though they are aimed at preventing undue fluctuations rather than setting the rate
- Pegged exchange rate regime - This is an exchange rate regime where the currency is pegged to a band or value, which is fixed or periodically adjusted or also pegged on other countries currency. The band is determined by international bilateral agreements or by a monetary authority and are adjusted periodically in response to economic conditions and indicators. An example of countries using this regime is; Ethiopia and China – whose currencies are fixed to a basket weighted towards the US dollar.
It is difficult to maintain the three conditions for an ideal currency regime, therefore each country chooses the regime that suits their policy objectives. Previously, there have been instances where a country has switched from one regime to another. Here is a look at examples of countries that have shifted their exchange regimes over the years;
- Botswana – In 1976, Botswana broke ranks with the rand zone and established its currency - the Pula and an adjustable peg regime, initially to the dollar and later to a basket composed of the rand at 70% and the IMF’s Special drawing rights (SDR) SDR at 30%. The Pula remained pegged to the US dollar until June 1980 when a significant appreciation of the rand against the US dollar, due to the increase in gold prices necessitated South Africa, a key component of the basket, to shift to a managed float. In particular, the depreciation of the Pula against the rand caused inflation in Botswana to accelerate to around 16.4%. Subsequently, Botswana shifted to a fixed peg regime, which was considered appropriate for their relatively small undiversified economy that was unlikely to sustain a floating currency. In 2005, Botswana introduced the crawling band regime intending to enable an automatic nominal adjustment of the exchange rate with a view of maintaining its stability and avoiding the need for sizeable discrete adjustments as it had been the case in the past,
- Nigeria - Before 1985, Nigeria operated a fixed exchange rate regime. The Government switched to a floating regime, following the fall in oil prices and the push by the World Bank for a Structural adjustment program that would devalue the currency and restore economic growth. Over the years the Nigerian government has switched in between various exchange regimes as they try to find a regime that would facilitate the achievement of both external and internal balances on the economy. In 1986 the government switched to a managed float system, with introduction of the Second-tier Foreign Exchange Market (SFEM) as a market-driven mechanism for foreign exchange allocation. The most of the 90’s the government used the Autonomous Foreign Exchange Market (AFEM) and introduced the Dutch auction system in 2002 – which reduced the dependence of authorized dealers on the Central Bank of Nigeria for foreign exchange and help achieve a convergence in exchange rates. However, following the 2008 financial crisis the Naira gradually depreciated against the dollar to N153.90/USD in 2011. When the initial devaluation in 2014 failed to counter the depreciation in the value of the naira, the Central Bank in February 2015 sought to limit the amount of foreign currencies that could be procured directly from them, by closing both its retail and wholesale auction windows. Despite these interventions, the value of the Nigerian naira continued to depreciate as a lot of demand could not be met by the market. Therefore, in June 2016, the managed float exchange rate system titled “Flexible Exchange Rate Inter-bank Market” was reintroduced. The system brought about a fragmented exchange rate system which offered multiple rates at different windows, the system has however led to speculative demand, profit taking pressures and thriving of a recognized black market dollar exchange rate.
Section II: How to Determine the Value of a Currency
One would then ask how you estimate the exchange rate between 2 countries and the value of the country’s currency. The most widely used methods are:
- The purchasing power parity (PPP) model - which states that the exchange rate between the domestic currency and any foreign currency will adjust to reflect differences in the inflation rates between them. The PPP looks at the prices of commodities in different countries and is the widely used method of forecasting exchange rates. According to PPP, the price of a loaf of bread in Kenya should the same price in any other country even after taking into account the prevailing exchange rate and excluding the accompanying transaction costs. However, PPP is faced with several challenges since countries typically have different baskets of goods and services produced and consumed. Hence, most of these goods and services are not traded internationally due to trade barriers and transaction costs (e.g., shipping costs and import taxes). Consequently, nominal exchange rates persistently deviate from PPP as relative purchasing power among countries displays a weak propensity to long-term equalization.
- Real effective exchange rate (REER): This is a measure of the value of a currency determined as the weighted average of a country’s currency that is relative to a basket of other currencies. The weights are a function of the relative trade balance of a given country’s currency against each country in that basket. An increase in the REER implies that exports have become more expensive with imports becoming cheaper; subsequently, an increase indicates a loss in trade competitiveness.A country’s REER is found by taking the bilateral exchange rates between itself and all of its trading partners, then weighting by the trade allocation associated with each country and multiplying by 100 to form an index.
- Behavioral equilibrium exchange rate (BEER): The model was developed by Clark and MacDonald (1999) and estimates the fair value of currencies according to short, medium and long-run determinants. The model attempts to measure possible exchange rate misalignment between any given two currencies based on monetary policy, terms of trade, chance disturbances, national savings and current economic fundamentals in relation to their sustainable levels. The method is often employed using econometric applications and can often be used to explain cyclical changes in the currency. The choice of variables for the BEER approach is discretionary and is based on beliefs of what impacts an exchange rate and the available data.
- Fundamental Equilibrium Exchange Rate (FEER): The method assumes the fundamental value should be one that is expected to generate a current account of some surplus or deficit that is equal to the country’s underlying capital flow. This makes the assumption that a country is looking to pursue internal balance and not restricting trade and capital flows to keep its balance of payments at a certain level. For example, if a country wants to peg its exchange rate, it either needs to forgo having an independent monetary policy - so as to allow capital inflows and outflows to move as needed or restrict its capital account with the intention to continue the autonomy over its monetary policy.
With countries trying to implement various exchange rates the question of finding the true value of a currency then comes in. Currency manipulation has been one of the most controversial economic issues in the limelight for the past years. Central banks across the world have been accused of managing the value of their currency during their routine interventions to counter monetary shocks. Currency manipulation is the artificial lowering of a country’s currency value that provides it with an unfair advantage of lowering the cost of their exports. The US produces a bi-annual report identifying countries that are classified as manipulators. In 2019, the US accused China of manipulation but later withdrew the claims. Currently, the IMF has developed guidelines on identification and control of currency manipulation. However, it faces challenges in implementation and is still looking at the best way to deal with manipulators.
Factors that affect the performance of the currency
- Economic stability: Factors like the Economic growth, interest rates and inflation rates influence the perception of a countries attractiveness as an investment destination affecting the performance of the of the country,
- Balance of payment position: The currency will always adjust based on the performance of the net inflow position from both trade and also capital inflows. A significant change in either direction would lead to a complete shift in the normal pegging of the currency,
- Forex reserves amounts held: depending on the country’s economic performance they are required to maintain certain levels of reserves significant deviation of those leads to changes in the currency performance,
- Political stability: In cases where there has been a lot of political turmoil the currencies are significantly affected meaning that people would be fleeing from those countries, and,
- Monetary policies: The aim of monetary policies is to maintain price stability and any changes in that could lead to significant volatilities to the currency.
Section III: Kenya's Foreign Exchange Market and Recent Events
Since independence, the Kenyan exchange rate has undergone various regime shifts, which have mainly been attributed to economic events. From independence to 1974, the rate was pegged to the dollar, which later shifted to a crawling peg after a series of devaluations, then it became fully liberalized in 1993. The current exchange rate regime is free-floating in nature and is determined by the market forces of demand and supply. However, the Central Bank of Kenya frequently participates in the foreign exchange market when; it needs to curtail volatility originating from external shocks, build stocks of foreign reserves, effect government payments and regulate liquidity in the market.
During a country review report released in 2018, the IMF suggested that the Kenyan exchange rate was overvalued by 17.5%. This was attributed partly to CBK engaging in periodic foreign exchange interventions, reflecting the limited movement of the shilling relative to the US dollar. The Central Bank of Kenya (CBK) governor, Dr. Patrick Njoroge, however, refuted the claims in a media briefing, coming out to clarify that the Central Bank does interventions in the market which can be seen as manipulations but they were actions that fall within the purview of the bank. Recently, there were also suggestions that the US had cautioned the Kenyan government against currency manipulation, a fact that the Governor clarified that it is a clause the US government includes in all its trade negotiations.
At the start of 2020 the Kenyan Shilling was exchanging at Kshs 101.4 against the US Dollar but due to the effects of COVID-19 weighing down on the economy the shilling has since depreciated by 8.4% to close at Kshs 109.9 at 27th November 2020 as highlighted in the chart below:
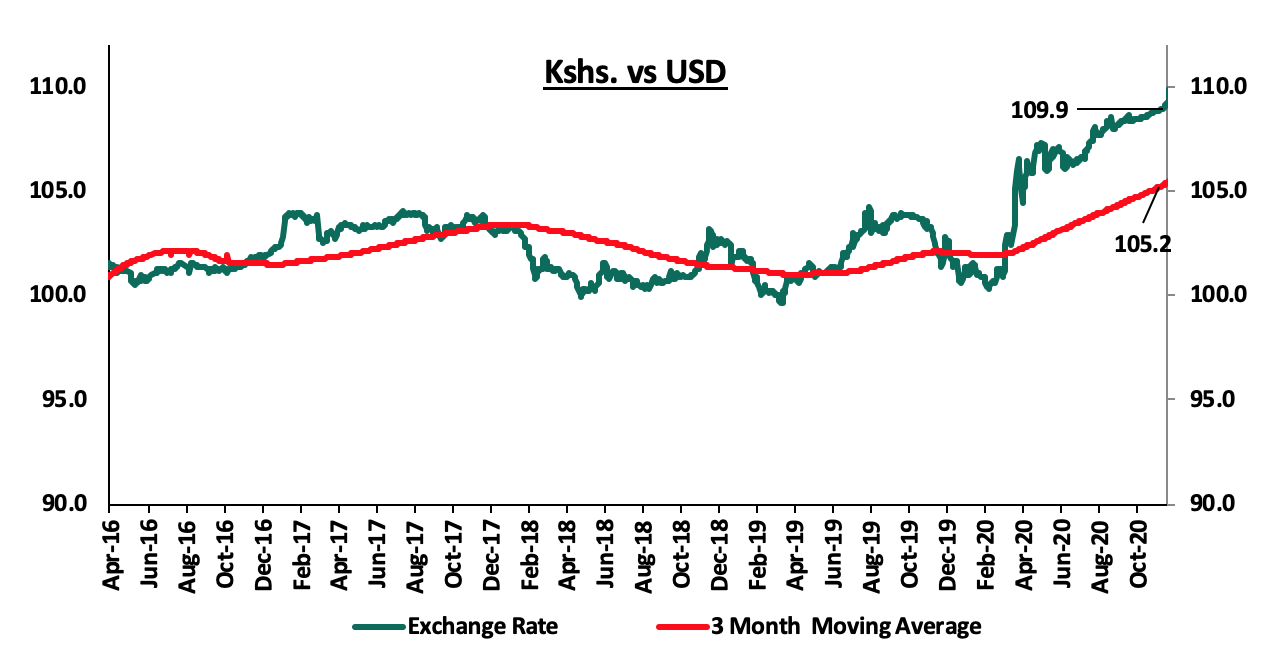
The recent performance of the shilling has been affected by:
- The Covid-19 pandemic weighing down on the economy by creating continued uncertainty that increases the demand for dollars globally, as people prefer holding dollars and other hard currencies. Thus pilling pressure on the Kenyan shilling and even after CBK’s intervention the shilling has continued to depreciate,
- The US Dollar appreciating by 6.8% in Q1’2020 against other currencies in the world. Though the gains have since been reversed the Dollar remains strong especially against currencies from emerging economies, Kenya included,
- Dwindling Forex reserves, after a decline in inflows from supporting sectors like tourism, currently stand at USD 7.9 bn (equivalent to 4.9-months of import cover). This has been mitigated by the resilient diaspora remittance inflows – with a 17.3% y/y increase to USD 263.1 mn in October 2020, from USD 224.3 mn recorded over the same period in 2019. This has cautioned the shilling against further depreciation.
Our in- house view is that the shilling will remain under pressure and we expect it to trade against the dollar at a range of Kshs 107.5- 109.5 in the short term. We expect the shilling to be cushioned from further shocks by:
- The Government agreed a USD 2.3 bn credit drawdown facility with the IMF, Kenya targeting an initial disbursement of about USD 725.0 mn in this fiscal year. The facility will be a welcome relief to the currency as it will aid in boosting the forex reserves and help improve market sentiments. This was after the IMF completed its virtual mission to Kenya identifying that the country has suffered unprecedented shock from pandemic and held discussions on discussed with the authorities on a program to support the next phase of their COVID-19 response.
- The fast-tracking of the Covid-19 vaccine that will help in containment of the pandemic and opening of economies. This will be most beneficial to struggling sectors like tourism and horticultural exports who are huge forex contributors, and,
- Monetary policy support from CBK by maintaining the policy rate at the current 7.0%, a further reduction would lead to a further depreciation of the shilling.
Section IV: Conclusion and Recommendations going forward
Determining the “true value” of a currency can be challenging given the various models used and the fact that countries have diverse economic dynamics and challenges.
The continued depreciation of the Kenyan shilling is expected to have the following effects to the economy;
- Foreign debt Repayment: The current debt mix comprises of Kshs 3.2 tn of domestic debt against Kshs 3.5 tn of foreign debt. The government in its Q1 budget outturn for Fiscal year 2020/21 has indicated that it expects to spend Kshs 154.6 bn in foreign debt interest payments. Further depreciation of the shilling will increase the interest debt payments. For instance a 1% depreciation in currency value would increase the interest payments by Kshs 15.5 bn.
The figure below shows Kenya’s debt composition as of June 2020 with 55.2% of the total debt being foreign borrowing:
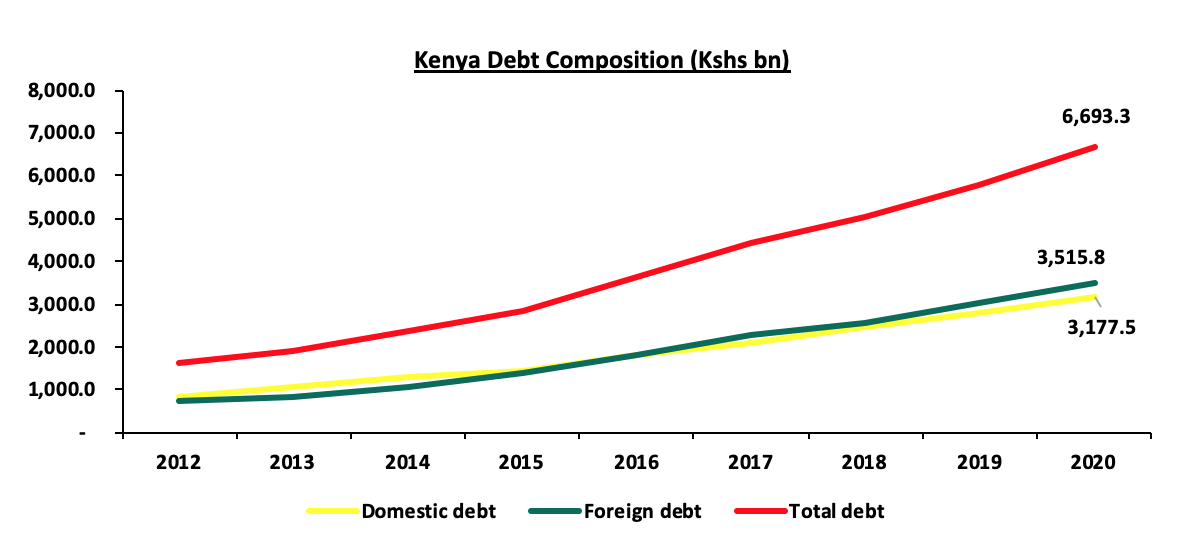
However, the government has also indicated on a possibility of joining the Debt Service Suspension Initiative (DSSI), aimed at allowing low-income countries to concentrate resources on fighting the pandemic. The ministry has also indicated that joining the initiative could save the country around Kshs 70-75 bn in interest payments.
2. Making imports more expensive: Kenya is a Net importer meaning that Kenya Imports more than it exports goods and services, therefore further depreciation will make the imports more expensive and with the current account deficit improving in will see the importers spend more to bring commodities into the country. The adjustment in Kenya’s price levels relative to those of its trading partners is however expected to be positive in helping the economy adjust to the COVID-19 shock and stage a recovery, by increasing the international competitiveness of goods and services produced in Kenya.
Disclaimer: The views expressed in this publication are those of the writers where particulars are not warranted. This publication, which is in compliance with Section 2 of the Capital Markets Authority Act Cap 485A, is meant for general information only and is not a warranty, representation, advice or solicitation of any nature. Readers are advised in all circumstances to seek the advice of a registered investment advisor.
- Talk to us
- Kenya
- P.O Box 20695 - 00200, Nairobi, Kenya
- Cell +254(0) 709 101 000
- Tel +254(0) 20 3929 000
- WhatsApp +254(0) 748 070 000
- United States
- +1 (240) 368-6217
- DOWNLOAD OUR APP
-


- Kenya
- Cysuites work spaces, Church Rd, Westlands, Nairobi, Kenya
- USA
- Suite 1150, 1775 Eye Street NW, USA, Washington DC 20006, USA
- Investments
- High Yield
- Private Equity
- Real Estate
- Real Estate
- RiverRun Estates
- Cytonn Towers
- The Ridge
- Taraji Heights
- The Alma