Nairobi Metropolitan Serviced Apartments 2020, & Cytonn Monthly-November 2020
By Research Team, Dec 6, 2020
Executive Summary
Fixed Income
During the month of November, T-bill auctions recorded an oversubscription, with the overall subscription rate coming in at 102.5%, a rise from 90.4% recorded in the month of October. The yield on the 91-day paper remained unchanged at 6.7%, while the 182-day and 364-day papers all increased by 0.2% points and 0.3% points to 7.2% and 8.2%, respectively from 7.0% and 7.9%, recorded the previous month. The T-bills acceptance rate increased to 96.4% during the month, compared to 90.2% recorded in October, with the government accepting a total of Kshs 94.8 bn of the Kshs 98.3 bn worth of bids received;
During the week, T-bills remained undersubscribed, with the overall subscription rate coming in at 45.5%, down from 64.3% the previous week. The highest subscription rate was in the 91-day paper, which came in at 74.3%, down from 114.5% recorded the previous week. The subscription for the 182-day paper declined to 26.9% from 63.7%, while that of the 365-day paper dropped to 52.6% from 44.7% recorded the previous week. Also, during the week, the Kenya National Bureau of Statistics (KNBS) released inflation data, revealing the y/y inflation for November increased to 5.5%, from the 4.8% recorded in October 2020. During the week, Stanbic Bank released the Monthly Purchasing Managers’ Index (PMI) for November 2020, which came in at 51.3, a decline from the 59.1 recorded in October 2020. During the week, The Cabinet secretary for National treasury, through a press statement indicated that some of the tax incentives effected in April 2020 will revert back to pre-COVID rates effective January 1st 2021;
Equities
During the month of November, the equities market recorded mixed performance, with the NASI and NSE 25 gaining by 3.7% and 2.9%, respectively, while the NSE 20 declined by 1.3%. The equities market performance was driven by gains recorded by large cap stocks, such as Bamburi, BAT, Safaricom and KCB Group, which gained by 16.5%, 8.8%, 6.0% and 2.6%, respectively. During the month, KCB Group disclosed that it had entered into an agreement with Atlas Mara Limited (ATMA) to acquire 62.1% stake in Banque De Populaire du Rwanda (BPR) in Rwanda and 100.0% stake in African Banking Corporation Ltd Tanzania (ABC Tanzania). Additionally, during the month, the listed banking sector released their Q3’2020 financial results, recording a 32.4% decline in their Core Earnings per Share (EPS), as compared to a growth of 8.7% in Q3’2019;
Real Estate
During the month, various industry reports were released, namely; Kenya Bankers Association Housing Price Index November 2020, Hass Consult Q3’2020 House Price Index, Hass Consult Q3’2020 Land Price Index, and, the Leading Economic Indicators - September 2020. In the residential sector, the Kenyan national government floated to the public, the first lot of 488 completed units at its Park Road low-cost housing project in Nairobi, and started allocation of the first block of 160 units. In the retail sector, Carrefour supermarket opened its first outlet in Mombasa County at City Mall in Nyali, bringing its total number of operational outlets countrywide to 9. In the hospitality sector, the United States (US) government issued a travel advisory to Kenya, citing an increase in the number of COVID-19 cases; the Tourism Research Institute citied a 72.0% drop in the number of international arrivals to 470,971 between January to October compared to 1,718,155 international arrivals during a similar period last year, and, the Kenya government announced plans to merge the management of its two iconic conferencing facilities, Bomas of Kenya with the Kenyatta International Convention Centre (KICC), in efforts to accelerate the recovery of the tourism sector. In infrastructure, Kenya Rural Roads Authority commenced the tarmacking of the first 7.0 km of Juja Farm Road in Kiambu County at a cost of Kshs 3.9 bn while Kenya Urban Roads Authority (KURA), announced plans to construct two elevated carriage ways in the Nairobi Central Business District (CBD). In Listed real estate the Fahari I-REIT continued to perform poorly, closing the month of November at Kshs 5.5 per share, trading at an average of Kshs 5.4 in the month thus representing a 43.8% loss of value on YTD from Kshs 9.6 recorded in January 2020 and a 72.5% drop from the listing price of Kshs 20.0;
Focus of the Week
This week, we focus on the hospitality sector in Kenya, where we update our Nairobi Metropolitan Area Serviced Apartments Report 2019 by covering the state of the serviced apartments market through looking into the drivers, challenges facing the sector, current and incoming supply, performance, and conclude by pointing out the investment opportunity. Serviced apartments within the Nairobi Metropolitan Area (NMA) recorded an average rental yield of 4.0% in 2020, 3.6% points lower than the 7.6% recorded in 2019. This is attributed to declines in monthly charges per SQM and occupancies from an average of Kshs 2,806 to Kshs 2,448 and 48.0% from 79.4%, respectively. The decline in performance is attributable to subdued demand for hospitality facilities and services due to the COVID-19 pandemic which saw the government ban all international flights and local flights into Mombasa and Nairobi, implement partial lockdown within the NMA among other restrictive measures aimed at curbing the spread of the coronavirus;
- Weekly Rates:
- Cytonn Money Market Fund closed the week at a yield of 10.52%. To invest, just dial *809#;
- Cytonn High Yield Fund closed the week at a yield of 13.38% p.a. To invest, email us at sales@cytonn.com and to withdraw the interest you just dial *809#;
- Beatrice Mwangi, a research analyst at Cytonn Investments was on Metropol TV Kenya discussing the state of affordable housing in Kenya. Watch Beatrice here;
- For an exclusive tour of Cytonn’s real estate developments, visit: Sharp Investor's Tour and for more information, email us at sales@cytonn.com;
- We continue to offer Wealth Management Training daily, from 9:00 am to 11:00 am, through our Cytonn Foundation. The training aims to grow financial literacy among the general public. To register for any of our Wealth Management Training, click here;
- For Pension Scheme Trustees and members, we shall be having different industry player’s talk about matters affecting Pension Schemes and the pensions industry at large. Join us every Wednesday from 9:00 am to 11:00 am for in-depth discussions on matters pension;
- If interested in our Private Wealth Management Training for your employees or investment group, please get in touch with us through wmt@cytonn.com;
- For recent news about the company, see our news section here.
Money Markets, T-Bills & T-Bonds Primary Auction:
During the month of November, T-bill auctions recorded an oversubscription, with the overall subscription rate coming in at 102.5%, a rise from 90.4% recorded in the month of October. The highest subscription rate was in the 364-day paper, which came in at 129.2%, an increase from 99.3% recorded the previous month. The subscription for the 182-day paper increased to 63.6% from 50.0%, while that of the 91-day paper declined to 106.2% from 146.7% recorded in the month of October. The yield on the 91-day paper remained unchanged at 6.7%, while the 182-day and 364-day papers all increased by 0.2% points and 0.3% point to 7.2% and 8.2%, respectively from 7.0% and 7.9%, recorded the previous month. The T-bills acceptance rate increased to 96.4% during the month, compared to 90.2% recorded in October, with the government accepting a total of Kshs 94.8 bn of the Kshs 98.3 bn worth of bids received.
During the week, T-bills remained undersubscribed, with the overall subscription rate coming in at 45.5%, down from 64.3% the previous week. This can be attributed to the tightening liquidity in the market as evidenced by 0.3% points increase in the average interbank rate to 3.9% from 3.6%, recorded last week. The highest subscription rate was in the 91-day paper, which came in at 74.3%, down from 114.5% recorded the previous week. The subscription for the 182-day paper declined to 26.9% from 63.7%, while that of the 364-day paper increased to 52.6% from 44.7% recorded the previous week. The yields on the 91-day, 182-day and 364-day increased by 13.1 bps, 14.0 bps and 5.3 bps to 6.9%, 7.3% and 8.2%, respectively. The government continued to reject expensive bids with the acceptance rate increasing to 90.6%, from 87.2% recorded the previous week, accepting bids worth Kshs 9.9 bn out of the Kshs 10.9 bn worth of bids received.
During the month of November, The Central Bank of Kenya re-opened 2 bonds the FXD2/2013/15 and FXD1/2018/20 with coupons of 12.0% and 13.2% and effective tenors of 7.5 years and 17.4 years, respectively. There was a high demand for the bond offers, with the overall subscription rate for the two bonds coming in at 140.0%, partly supported by the favourable liquidity in the market, and financial institutions bias towards the fixed income market in this period of economic uncertainty. The government received bids worth Kshs 56.0 bn, higher than the Kshs 40.0 bn offered and accepted only Kshs 53.7 bn. Investors preferred the longer-term paper i.e. FXD1/2018/20, which received bids worth Kshs 28.9 bn, representing 51.2% of the total bids received. The weighted average rate of accepted bids for the two bonds came in at 11.4% and 13.3%, for FXD2/2013/15 and FXD1/2018/20, respectively. The government rejected high bids only accepting Kshs 53.7 bn out of the Kshs 56.0 bn worth of bids received, translating to an acceptance rate of 96.0%.
Additionally, during the month of November, there was low demand for the 25-year bond tap sale, FXD1/2018/25, with the overall subscription rate coming in at 39.8%. The government accepted Kshs 7.9 bn out of the Kshs 8.0 bn worth of bids received, representing an acceptance rate of 99.3%, which can be attributed to the undersubscription. The allocated average rate for accepted bids was 13.5% while the coupon rate for the bond is 13.4%
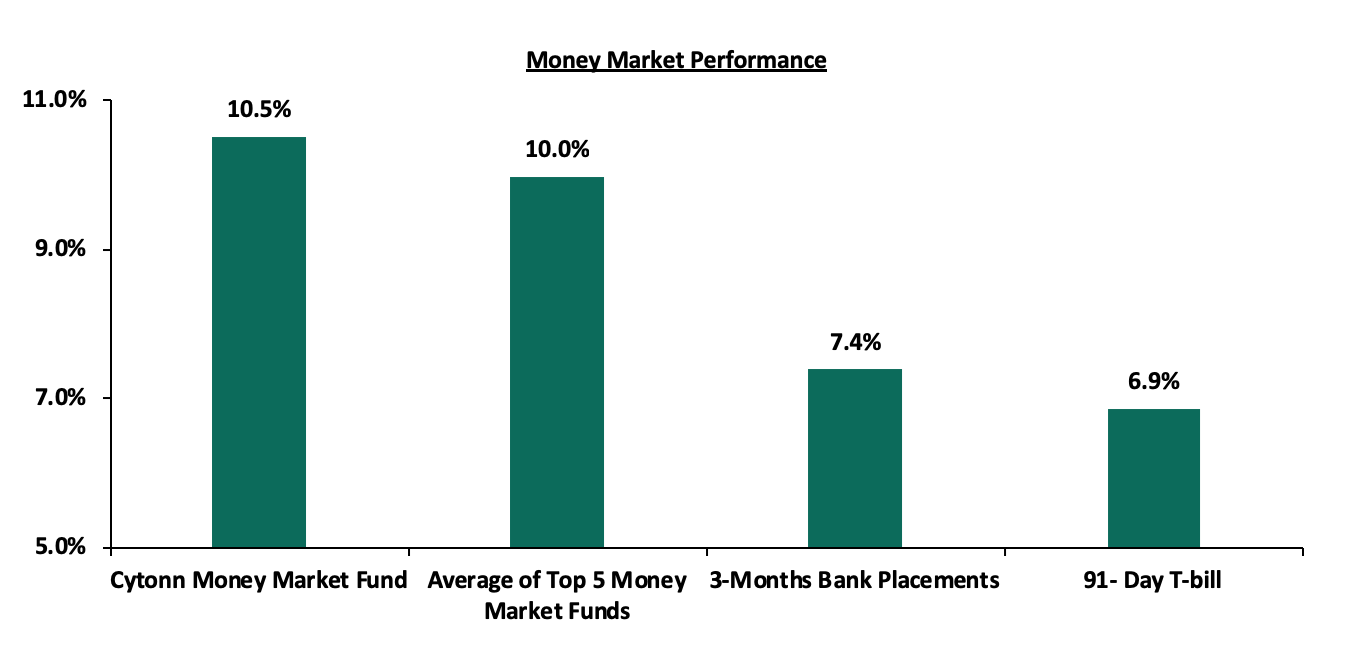
In the money markets, 3-month bank placements ended the week at 7.4% (based on what we have been offered by various banks), while the yield on the 91-day T-bill increased to 6.9% from 6.7% recorded the previous week. The average yield of Top 5 Money Market Funds declined marginally by 0.1% points to 10.0% from 10.1% recorded the previous week. The yield on the Cytonn Money Market remained unchanged at 10.5%, recorded the previous week.
Secondary Bond Market:
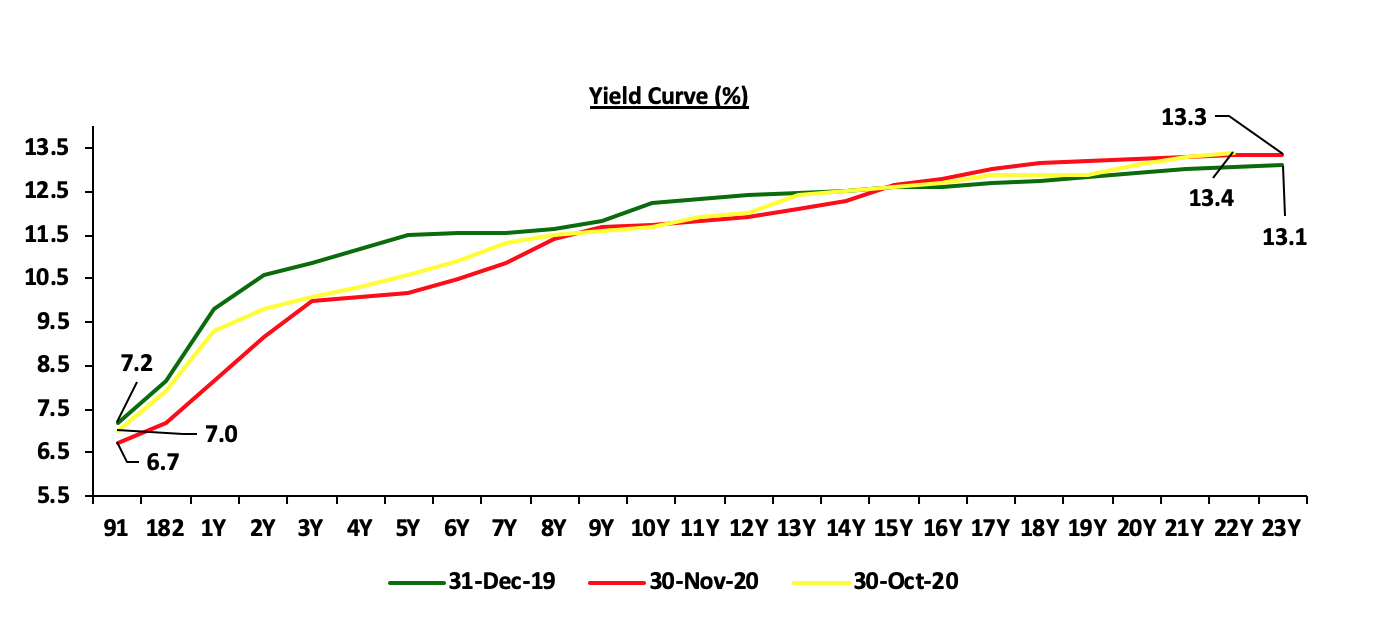
In the Month of November, the yields on government securities in the secondary market remained relatively stable and the bond turnover declined by 22.4% to Kshs 46.0 bn, from Kshs 59.3 bn recorded in October. The FTSE NSE bond index increased marginally by 0.1% to close the month at 98.3 from 98.2 in October and bringing the YTD return to 2.9%. The chart below is the yield curve movement during the period;
Liquidity:
The money markets remained liquid during the month of November mainly supported by government payments. The average interbank rate increased marginally to 3.2%, from 2.7% recorded in October. During the week, liquidity in the market tightened with the average interbank rate increasing by 0.3% points, to 3.9% from 3.6% recorded the previous week attributable to government payments. The average interbank volumes declined by 52.8% to Kshs 6.0 bn, from Kshs 12.7 bn recorded the previous week. According to the Central Bank of Kenya’s weekly bulletin, commercial banks’ excess reserves came in at Kshs 8.5 bn in relation to the 4.25% Cash Reserve Ratio.
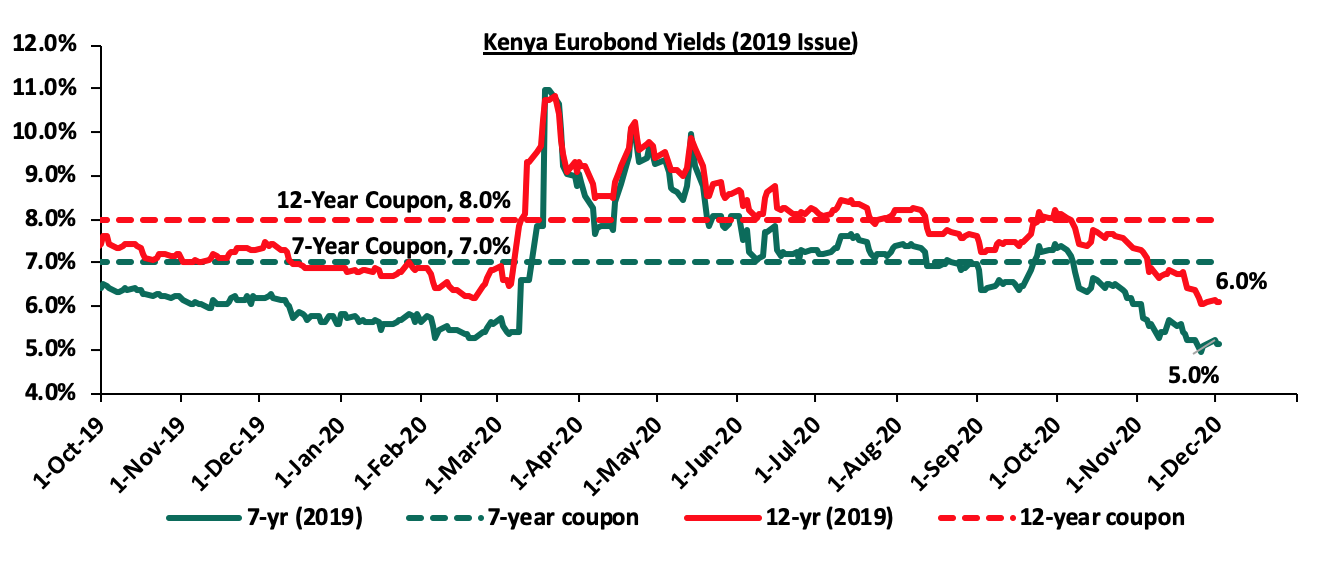
Kenya Eurobonds:
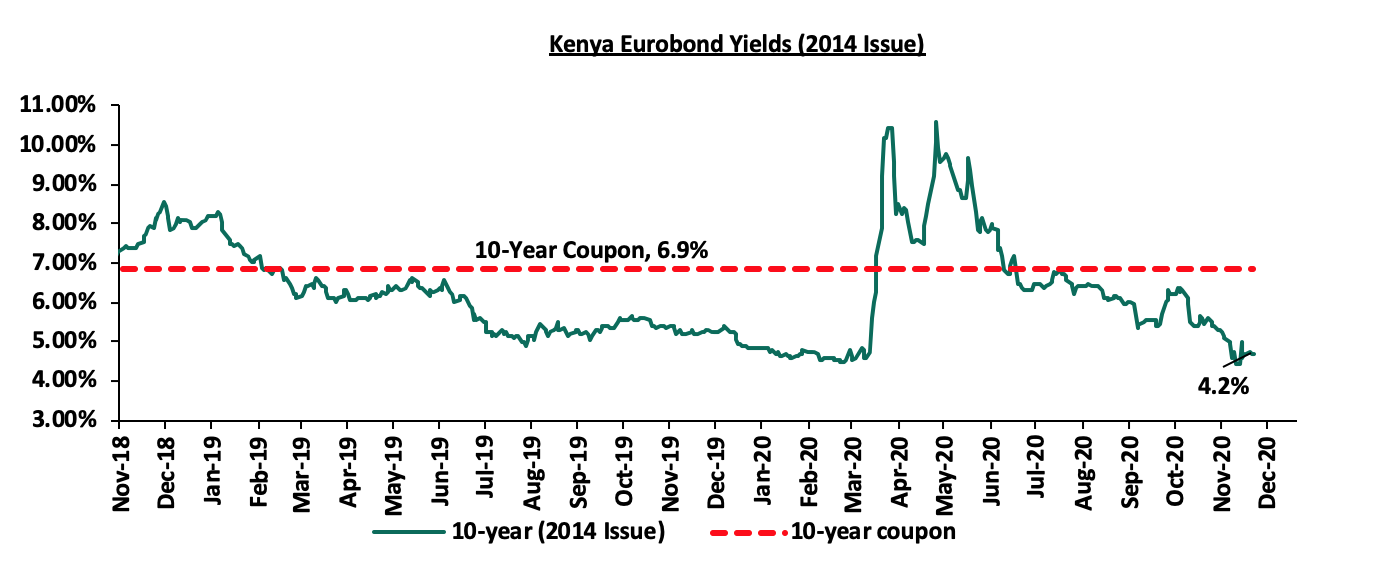
During the month, the yields on all Eurobonds declined, pointing towards improved foreign investor sentiments. This was following the announcement of a USD 2.3 bn IMF drawdown facility to help mitigate Covid-19 related economic shocks.
According to Reuters, the yield on the 10-year Eurobond issued in September 2014 declined by 0.8% points to 4.3% in November, from 5.1% in October.
During the week, the yield on the 10-year Eurobond issued in June 2014 increased marginally by 0.1% points to 4.2% from 4.1%, as was recorded the previous week.
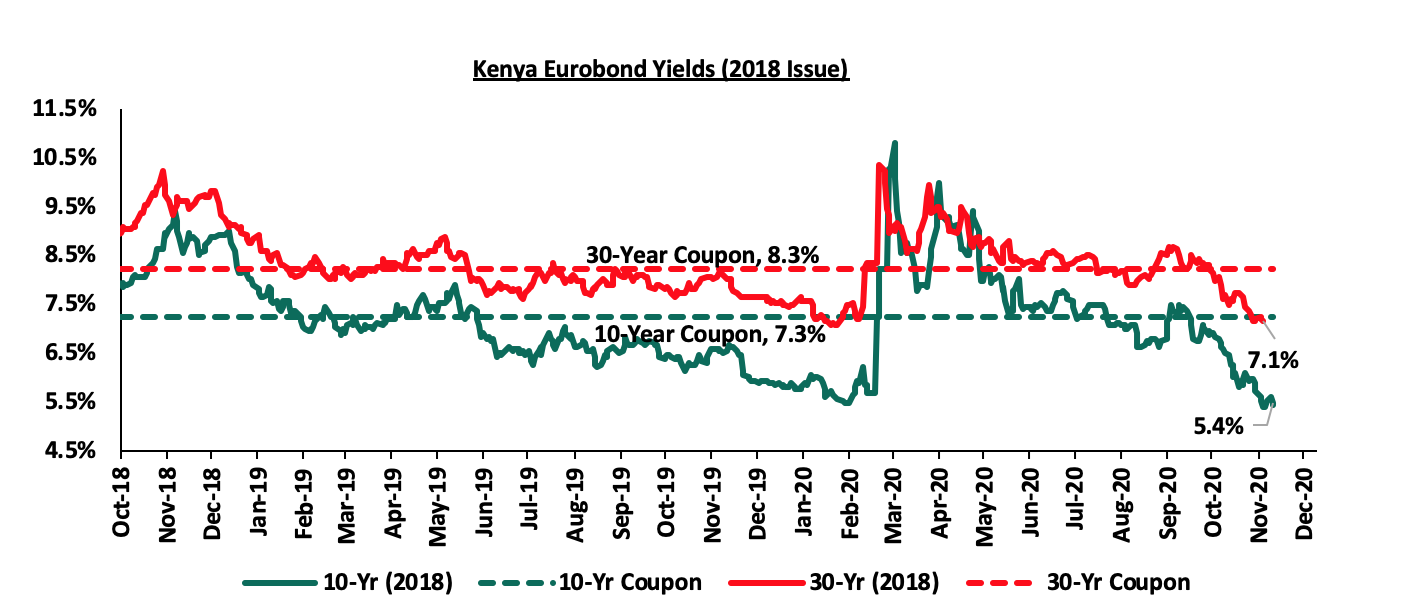
During the month, the yields on the 10 year Eurobond issued in February 2018 declined by 0.9% points to close at 5.6% in November, from the 6.5% recorded in October. The 30-year Eurobond, on the other hand, also declined by 0.8% points to close at 7.2% in October, from the 8.0% recorded in September.
During the week, the yields on the 10-year and 30-year Eurobonds issued in 2018 recorded mixed performances. The 10-year issue remained unchanged from the 5.4%, recorded last week. The 30-year issue declined marginally by 0.1% points to 7.1% from 7.2%, recorded last week.
During the month, the yields on the 2019 issued dual-tranche Eurobond with 7-years declining by 0.9% points to 5.2% in November, from 6.1% in October. The 12-year Eurobond declined by 1.1% points to 6.2% in, from 7.3% in October.
During the week, the yields on the 2019 dual-tranche Eurobonds recorded mixed performances. The 7-year Eurobond declined marginally by 0.1% points to 5.0% from 5.1% recorded last week. While, the 12-year Eurobond remained unchanged from the 6.0%, recorded last week.
Kenya Shilling:
During the month, the Kenya Shilling depreciated by 1.1% against the US Dollar to close at Kshs 110.1, from Kshs 108.8 recorded at the end of October, mostly attributable to the persistent dollar demand from general importers, as well as low inflows from sectors like horticulture and tourism. During the week, the Kenyan shilling depreciated against the US dollar by 0.7% to an all-time low of Kshs 110.7 from Kshs 109.9. On an YTD basis, the shilling has depreciated by 9.2% against the dollar, in comparison to the 0.5% appreciation in 2019. We expect continued pressures on the Kenyan shilling due to:
- Demand from merchandise and energy sector importers as they beef up their hard currency positions amid a slowdown in foreign dollar currency inflows, and,
- Continued uncertainty globally making people prefer holding dollars and other hard currencies.
However, in the short term, the shilling is expected to be supported by:
- The Forex reserves which are currently at USD 8.0 bn (equivalent to 4.9-months of import cover), which is above the statutory requirement of maintaining at least 4.0-months of import cover, and the EAC region’s convergence criteria of 4.5-months of import cover,
- The improving current account position which narrowed to 4.9% of GDP in the 12 months to October 2020 compared to 5.3% of GDP during a similar period in 2019, and,
- Improving diaspora remittances evidenced by a 17.3% y/y increase to USD 263.1 mn in October 2020, from USD 224.3 mn recorded over the same period in 2019, has cushioned the shilling against further depreciation.
Weekly Highlight
Stanbic November PMI
During the week, Stanbic Bank released the Monthly Purchasing Managers’ Index (PMI) for November 2020, which came in at 51.3, a decline from the 59.1 recorded in October 2020. Key to note, a reading of above 50 indicates improvements in the business environment, while a reading below 50 indicates a worsening outlook. Notably, the rate of growth is the least marked in five months, which signals a much softer and only modest improvement in overall business conditions. Key to the slowdown were weaker increases in business activity and sales, as the rise in local COVID-19 cases led to issues to do with money circulation and economic stress, while lockdowns in Europe curtailed growth in foreign new orders. Subsequently, after a renewed rise during October, Kenyan companies kept job numbers stable in November, reflecting a drop in revenues and reduced pressure on capacity. Purchases of inputs meanwhile rose at the slowest rate for three months, leading to a softer expansion in stock levels. Competition among vendors, due to difficulties with sourcing some inputs, led to a further shortening of supplier lead times taking the rate of improvement to the least marked since June. Although the rate of inflation softened for the first time in six months, the Purchasing costs continued to rise moderately in November, with salaries decreasing slightly from that seen in October. Despite the outlook for business activity in 12 months' time falling to its lowest on record during November, with worries over a rise in COVID-19 cases and new curfew measures, many businesses still reported plans for expansion. We have a cautious outlook in the short term owing to the increase in COVID-19 infections, despite the recent improvement in some of the leading economic indicators.
Inflation
The y/y inflation for the month of November rose to 5.5%, from the 4.8% recorded in October 2020. M/M inflation on the other hand came in at 1.2%. The rise was due to:
- A 1.5% increase in the Food and Non-Alcoholic Drinks’ Index, mainly driven by an increase in prices of beef with bones, wheat flour-white and tomatoes by 1.0%, 0.7% and 0.7 %, respectively, among other food items,
- A 0.1% increase in Housing, Water and Electricity, Gas and Other Fuels’ Index, mainly attributed to an increase in the cost of; some cooking fuels (i.e. gas, charcoal, firewood), and household utilities. However, there were some notable decreases in the cost of kerosene and electricity, and,
- A 0.2% decrease in the Transport Index, mainly driven by a decrease in pump prices of diesel and petrol,
|
Major Inflation Changes – November 2020 |
|||
|
Broad Commodity Group |
Price change m/m (November - 20/October -20) |
Price change y/y (November -20/November -19) |
Reason |
|
Food & Non-Alcoholic Beverages |
1.5% |
6.1% |
The m/m increase was mainly contributed by an increase in prices of beef with bones, wheat flour-white and tomatoes among other food items |
|
Housing, Water, Electricity, Gas and other Fuel |
0.1% |
2.7% |
The m/m increase was as a result of the increase in the cost some cooking fuels (i.e. gas, charcoal, firewood), and household utilities |
|
Transport Cost |
(0.2%) |
12.8% |
The m/m decrease was mainly on account decrease in pump prices of diesel and petrol |
|
Overall Inflation |
1.2% |
5.5% |
The m/m increase was due to a 1.5% increase in the food and non-alcoholic drinks’ cost, mainly driven by the increase in prices of food items |
Going forward, we expect the inflation rate to remain within the government’s set range of 2.5% - 7.5% even with the anticipated price hikes in the festive season. Food prices are likely to remain low due to favourable rainfall received.
During the week, The Cabinet secretary for National treasury, Amb. Ukur Yatani, through a press statement indicated that the tax incentives effected in April 2020 were to revert back to pre-COVID rates effective January 1st 2021. The incentives had been issued under the economic stimulus package as a way to mitigate the effects of COVID-19 on individual and businesses incomes. However, the government will continue to cushion the low income earners by retaining the 100% relief to those earning a monthly income of Kshs 24,000 and below. The rates affected include:
- Corporate Tax rate which will revert to 30.0% from 25.0%,
- Individual Income Tax rate which will revert to 30.0% from the current 25.0%, and,
- Value-added Tax Rate which will revert to 16.0% from the current 14.0%,
This comes on the back of revenue underperformance reported in Q1’ of the 2020/21 Fiscal year. The Ordinary revenue collection declined by 10.9% to Kshs 342.6 bn against a target of Kshs 384.3 bn, representing a Kshs 41.7 bn reduction. The reduction was mainly attributable to reduced tax collections, where PAYE collections declined by 27.1% and Local VAT also reduced by 30.8%.
The table below shows a breakdown in revenue collected:
|
Q1' FY 2020/2021 Budgetary Review |
|||||
|
Amounts in Kshs bn unless stated otherwise |
|||||
|
|
2019/2020 Actual |
20220/2021 |
Deviation Kshs |
Growth (%) |
|
|
|
Actual** |
Target |
|||
|
Total Revenue (a+b) |
421,159 |
378,677 |
428,898 |
(50,221) |
(10.1%) |
|
(a) Ordinary Revenue |
384,351 |
342,580 |
384,327 |
(41,747) |
(10.9%) |
|
Import duty |
25,729 |
23,167 |
26344 |
(3,177) |
(10.0%) |
|
Excise duty |
49,725 |
47,354 |
56,947 |
(9,593) |
(4.8%) |
|
PAYE |
98,199 |
71,556 |
90,712 |
(19,156) |
(27.1%) |
|
Other Income Tax |
82,522 |
79,692 |
76,642 |
3,050 |
(3.4%) |
|
VAT local |
59,462 |
41,151 |
61,180 |
(20,029) |
(30.8%) |
|
VAT Import |
46,317 |
41,911 |
52,901 |
(10,990) |
(9.5%) |
|
Investment Revenue |
6,087 |
21,321 |
2,593 |
18,728 |
250.3% |
|
Traffic Revenue |
1,092 |
1,052 |
972 |
80 |
(3.7%) |
|
Taxes on inter trade(IDF Fee) |
5,750 |
8,408 |
6,826 |
1,582 |
46.2% |
|
Others |
9,468 |
6,968 |
9,210 |
(2,242) |
(26.4%) |
|
(b) Appropriation in Aid |
36,808 |
36,097 |
44,571 |
(8,474) |
(1.9%) |
|
o/w Railway Dev levy |
5,538 |
6,279 |
6,901 |
(622) |
13.4% |
|
(c) External Grants |
2,802 |
3,915 |
8,412 |
(4,497) |
39.7% |
|
|
- |
||||
|
Total Revenue and External Grants |
423,961 |
382,592 |
437,310 |
(54,718) |
(9.8%) |
|
Total Revenue and External Grants as a percentage of GDP |
4.1% |
3.4% |
3.9% |
||
*Amounts in Kshs bn unless stated otherwise
The move comes at a time when other governments across the world are planning on another round of economic stimulus packages. Therefore, we are of the view that, the reversal will still not help the government achieve its revenue targets since; many people have lost their jobs affecting the PAYE and many companies are reporting losses due to reduced business activities. The prospects of a sudden recovery are forestalled by the recent spike in the number of new Covid-19 infections in the country. The increase in VAT will likely be reflected in an increase in inflation as traders pass the burden to consumers.
Monthly Highlights
- Energy and Petroleum Regulatory Authority (EPRA) released their monthly statement on the Maximum Retail Prices in Kenya for the period 15th November 2020 to 14th December 2020. Petrol prices have declined by 1.3% to Kshs 105.9 per litre from Kshs 107.3 per litre previously, while diesel prices declined by 2.4% to Kshs 90.7 per litre from Kshs 92.9 per litre. Kerosene prices also declined by 2.5% to Kshs 81.6 per litre from Kshs 83.7 per litre. We expect a slight decline, not only in the transport and fuel index, which carries a weighting of 8.7% in the total consumer price index (CPI), but also on the prices of other commodities such as food prices because of a trickle-down effect due to the lower cost of transport. For more information, see our, Cytonn Weekly #47/2020,
- The World Bank released the 22nd edition of the Kenya economic outlook – Navigating the pandemic. The report highlighted that Kenya’s economic outlook remains highly uncertain, as the COVID-19 pandemic has severely affected the country. The report took a baseline assumption that Kenya’s economic output is projected to contract by 1.0 % in 2020, and rebound in 2021 to grow by 6.9%. The base case projections assume that the economic effects of COVID-19 are expected to fade by early to mid-2021, as vaccines and additional treatments become available. For more information, see our, Cytonn Weekly #48/2020, and,
- The Monetary Policy Committee (MPC) met on 26th November 2020 to review the prevailing macroeconomic conditions and decide on the direction of the Central Bank Rate (CBR). The MPC concluded that the current accommodative monetary policies together with the fiscal measures are still being transmitted to support the economy, and therefore decided to retain the Central Bank Rate (CBR) at 7.0%. The Committee will meet again in January 2021, but remains ready to re-convene earlier if necessary. For more information, see our, Cytonn Weekly #48/2020,
Rates in the fixed income market have remained relatively stable due to the high liquidity in the money markets, coupled with the discipline by the Central Bank as they reject expensive bids. The government is 33.7% ahead of its prorated borrowing target of Kshs 205.7 bn having borrowed Kshs 275.1 bn. In our view, due to the current subdued economic performance brought about by the effects of the COVID-19 pandemic, the government will record a shortfall in revenue collection with the target having been set at Kshs 1.9 tn for FY’2020/2021 thus leading to a larger budget deficit than the projected 7.5% of GDP, ultimately creating uncertainty in the interest rate environment as additional borrowing from the domestic market may be required to plug the deficit. Owing to this uncertain environment, our view is that investors should be biased towards short-term to medium-term fixed income securities to reduce duration risk.
Markets Performance
During the month of November, the equities market recorded mixed performance, with NASI and NSE 25 gaining by 3.7% and 2.9%, respectively, while NSE 20 declined by 1.3%. The equities market performance was driven by gains recorded by large cap stocks such as Bamburi, BAT and Safaricom, which gained by 16.5%, 8.8% and 6.0%, respectively. The gains were however weighed down by losses recorded by other large-cap stocks such as Standard Chartered Bank and NCBA Group, which declined by 5.2% and 0.7%, respectively.
During the week, the equities market was on an upward trajectory, with NASI, NSE 20 and NSE 25 gaining by 3.4%, 1.6% and 2.2%, respectively, taking their YTD performance to losses of 11.0%, 32.7%, and 19.2%, for NASI, NSE 20 and NSE 25, respectively. The equities market performance was mainly driven by gains recorded by large-cap stocks such as BAT, Bamburi and Safaricom, which gained by 7.5%, 7.0% and 5.0%, respectively. Key to note, Safaricom hit an all-time high of Kshs 33.5, taking its market capitalization to Kshs 1.3tn, representing 59.8% of NASI.
Equities turnover rose by 92.8% during the month to USD 104.2 mn, from USD 54.1 mn recorded in October 2020. Foreign investors remained net sellers during the month, with a net selling position of USD 10.9 mn, compared to October’s net selling position of USD 10.4 mn.
During the week, equities turnover increased by 126.5% to USD 48.2 mn, from USD 21.3 mn recorded the previous week, taking the YTD turnover to USD 1.4 bn. Key to note, Safaricom was the top market mover during the week, with a turnover of USD 28.5 mn (Kshs 3.2 bn). Foreign investors turned net buyers, with a net buying position of USD 5.0 mn, from a net selling position of USD 3.0 mn recorded the previous week, taking the YTD net selling position to USD 275.9 mn.
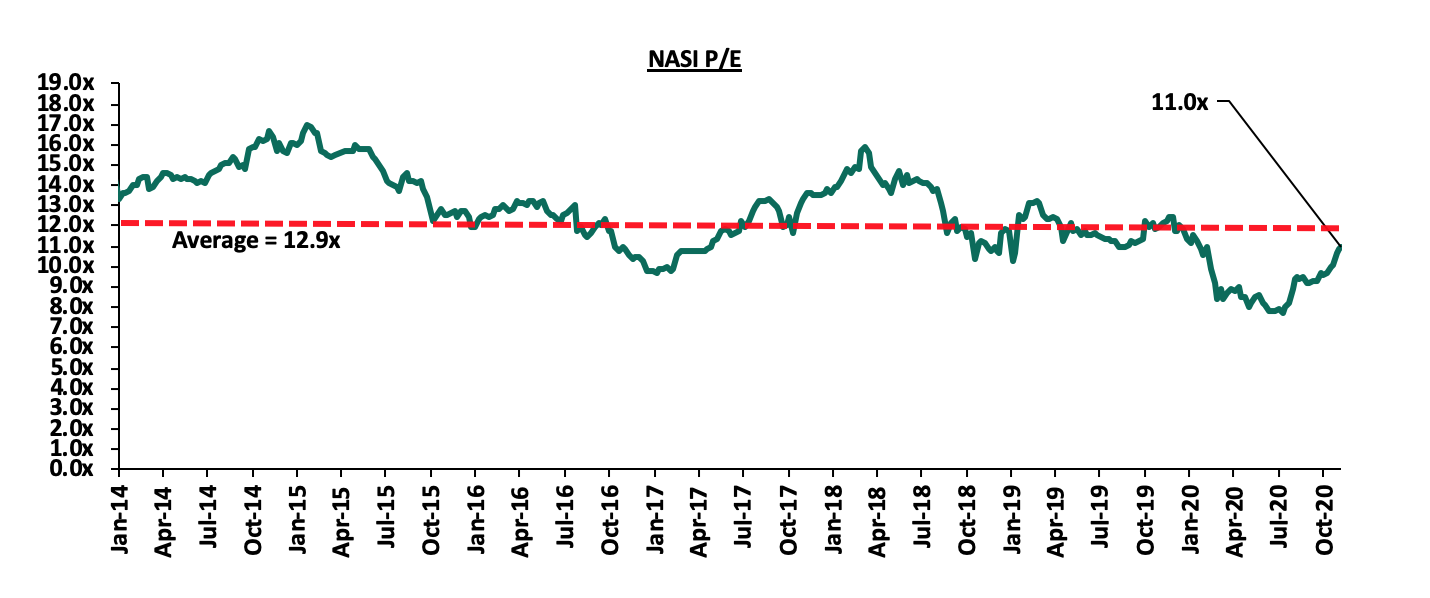
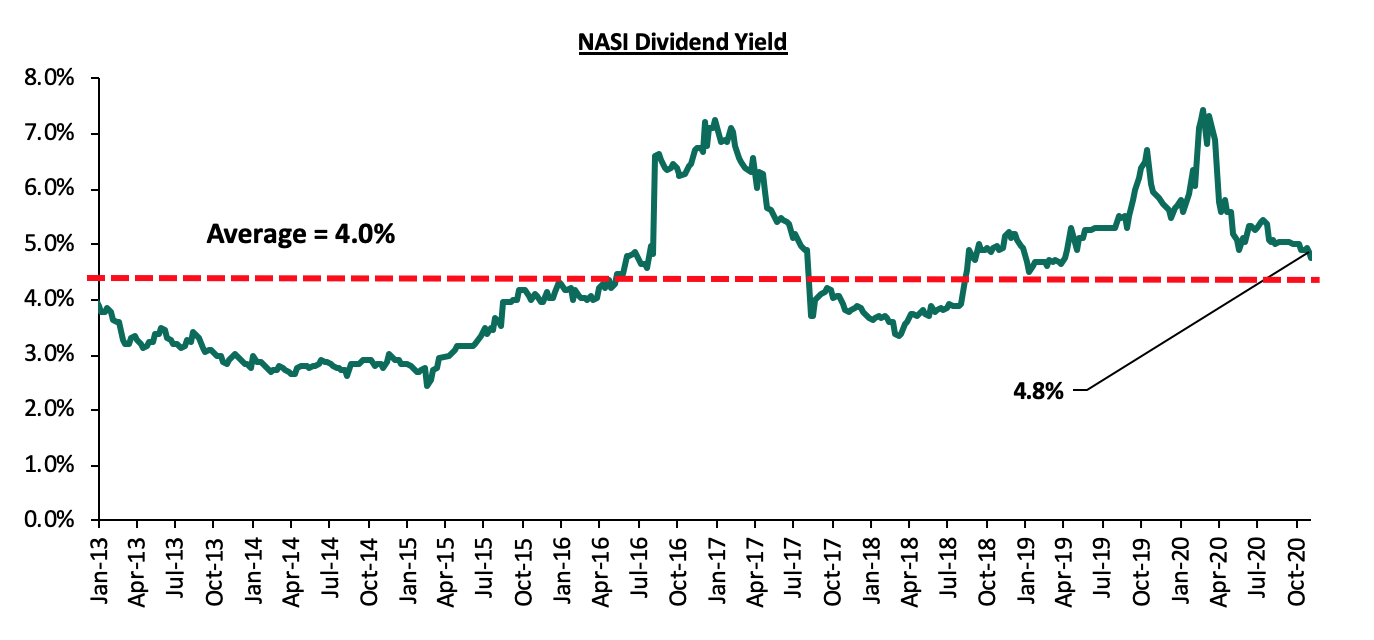
The market is currently trading at a price to earnings ratio (P/E) of 11.0x, 15.4% below the 11-year historical average of 12.9x. The average dividend yield is currently at 4.8%, 0.1% points below the 4.9% recorded the previous week, and 0.8% points above the historical average of 4.0%.
With the market trading at valuations below the historical average, we believe there are pockets of value in the market for investors with higher risk tolerance and are willing to wait out the pandemic. The current P/E valuation of 11.0x is 42.2% above the most recent trough of 7.7x experienced in the first week of August 2020. The charts below indicate the historical P/E and dividend yields of the market.
Monthly Highlights:
- KCB Group disclosed that it had entered into an agreement with Atlas Mara Limited (ATMA) to acquire 62.1% stake in Banque De Populaire du Rwanda (BPR) in Rwanda and 100.0% stake in African Banking Corporation Ltd Tanzania (ABC Tanzania). In the 62.1% BPR acquisition, KCB will pay a cash consideration based on the net asset value of the BPR at completion of the transaction using a price to book multiple of 1.1x. Key to note, according to the latest BPR financials, the bank had a book value of Rwf 46.6 bn (Kshs 5.2 bn), and thus at the trading multiple of 1.1x, we estimate KCB will have to part with Kshs 5.7 bn. For more information, please see Cytonn Weekly#48/2020,
- The Insurance Regulatory Authority (IRA), released the Q2’2020 Insurance Industry Report highlighting that the industry’s gross premium income increased by 3.2% to Kshs 121.0 bn, from Kshs 117.3 bn recorded in Q2’2019, with the general insurance business contributing 60.5% of the industry’s premium income, a 1.8% point decline from the 62.3% contribution witnessed in Q2’2019. The regulator noted that the COVID-19 pandemic had impacted the insurance sector mainly through reduced returns from the capital markets and the increase in insurance claims in the long term insurance business class. For more information, please see Cytonn Weekly#47/2020, and,
- The Capital Markets Authority (CMA) approved the registration of ABSA Unit Trust Funds, which will be offered by ABSA Asset Management Limited (formerly Barclays Credit Limited). ABSA Asset Management Limited is a fully owned subsidiary of Absa Bank Kenya PLC. The fund will offer the following Collective Investment Schemes (CIS); ABSA Shilling Fund, ABSA Dollar Fund, ABSA Fixed Income Fund, ABSA Equity Fund, and, ABSA Balanced Fund. For more information, please see Cytonn Weekly#45/2020.
Weekly Highlights:
During the week, CMA, with the support of Financial Sector Deepening (FSD) Africa, on-boarded a consultant, who remains unnamed, to review the Capital Markets (Collective Investment Schemes) Regulations, 2001 to address stakeholders’ concerns with the existing framework and develop a stronger asset management sector that is consistent with the objectives of the 10-year Capital Market Master Plan (2014-2023). From the Master Plan, the Regulator had projected that Assets under Management (AUM) in Collective Investment Schemes would grow at a 5 year CAGR of 27.0% to Kshs 132.0 bn in 2020, from Kshs 40.0 bn in 2014. Additionally, the regulator had projected that the AUM would reach Kshs 220.0 bn by the end of 2023. However, given the effects emanating from the pandemic that has seen a downturn in various sectors of the economy, the AUM is currently short of meeting the required target by 33.3%, with the AUM as at 30th June 2020 coming in at Kshs 88.1 bn, from Kshs 76.5 bn recorded in Q1’2020.
Key to note, the Authority had also published guidelines to CIS in September 2020, with the aim of encouraging international best practice in the capital markets. The guidelines will take effect on 1st January 2021. In our Analysis of the new CMA guidelines to CIS topical, we scrutinized the guidelines and gave our view on what they meant to fund managers as well as the CIS industry in general. Further, we noted that the guidelines presented various shortcomings in the industry such as can the regulator determine the asset allocation for managers? Do these guidelines override the fund managers trust deed? Etc.
The move by the regulator to review the CIS Regulations 2001 is commendable, as this will ensure a more robust financial market that is up to international standards. The review will also help in the development of the capital market in terms of introduction of products that are currently not available such as Sector Funds, and consequently promote the growth of the CIS AUM in line with the 10-year Capital Market Master Plan (2014-2023). However, more needs to be done to open up our capital markets as currently, the Capital Markets remains stifled with Kenyan businesses relying on banks for a staggering 99.0% of their funding, compared to well-functioning economies which only rely on banks for only 40.0% of their funding, with the remaining 60% coming from capital markets. Additionally, we believe that the review of the regulations will pave way for an ecosystem in the industry that will not only stimulate the growth in the Capital Markets, but also remove the myriad of obstacles that impede market growth. Specifically, the obstacles we recommend to be removed include:
- Expand eligibility of Trustees of Unit Trust Funds to include non-bank Trustees such as Corporate Trustees. The current situation where all Trustees are banks, severely constrains capital market growth because of;
- The inherent conflict of interest where banks are Trustees in a market where they are also competing for funds, and,
- Banks are not best suited to be Trustees in complex financial products, hence this restrains the market to plain vanilla investments such as bank deposits and government debt,
- Remove conflicts of interest in the governance of capital markets and create a governance structure that is more responsive to market participants and market growth,
- Improve fund transparency to provide investors with more information. Each Unit Trust Fund should be required to publish their portfolio holdings on a quarterly basis. Q3’2020 saw investors in Amana Capital, whose funds had been frozen for the past 2 years, receive a 59.0% impairment on their investments following the losses incurred from investing in the Nakumatt commercial paper, yet they were not aware that their funds had been invested in the Commercial Paper,
- Allow for sector funds: The current capital markets regulations require that funds must diversify. Consequently, one has to seek special dispensation in form of sector funds such as a financial services fund, a technology fund or a real estate UTF fund. Regulations allowing unit holders to invest in sector funds would expand the scope of unit holders interested in investing, and,
- Reduce the minimum investments to reasonable amounts: Sector funds, in addition to cumbersome incorporation as mentioned above, have high minimums of Kshs 1,000,000, which is way above the median wage of Kshs 50,000. Having sector funds minimum that is 20 times the national income seems unreasonably high.
Earnings Releases:
During the week, I&M Holdings and HF Group released their Q3’2020 financial results. Below is a summary of their performance;
- I&M Holdings
|
I&M Holdings Q3’2020 Key Highlights |
|||
|
Balance Sheet |
|||
|
Balance Sheet Items |
Q3’2019 (Kshs bn) |
Q3’2020 (Kshs bn) |
y/y change |
|
Government Securities |
53.5 |
91.4 |
70.9% |
|
Net Loans and Advances |
174.1 |
185.7 |
6.7% |
|
Total Assets |
324.3 |
344.7 |
6.3% |
|
Customer Deposits |
236.2 |
252.8 |
7.0% |
|
Deposits per Branch |
3.1 |
3.6 |
17.7% |
|
Total Liabilities |
266.7 |
280.8 |
5.3% |
|
Shareholders’ Funds |
54.5 |
60.5 |
10.9% |
|
Income Statement |
|||
|
Income Statement Items |
Q3’2019 (Kshs bn) |
Q3’2020 (Kshs bn) |
y/y change |
|
Net Interest Income |
10.6 |
10.4 |
(1.7%) |
|
Net non-Interest Income |
6.3 |
6.4 |
1.1% |
|
Total Operating income |
16.9 |
16.8 |
(0.7%) |
|
Loan Loss provision |
(1.3) |
(2.1) |
65.4% |
|
Total Operating expenses |
(8.2) |
(9.7) |
18.4% |
|
Profit before tax |
9.3 |
6.5 |
(30.2%) |
|
Profit after tax |
6.6 |
4.6 |
(30.8%) |
|
Core EPS |
8.0 |
5.5 |
(30.8%) |
|
Key Ratios |
|||
|
Ratios |
Q3’2019 |
Q3’2020 |
% point change |
|
Yield on Interest Earning Assets |
10.3% |
9.6% |
(0.7%) |
|
Cost of Funding |
4.61% |
4.65% |
0.04% |
|
Net Interest Margin |
6.0% |
5.3% |
(0.7%) |
|
Non-Performing Loans (NPL) Ratio |
12.7% |
11.2% |
(1.5%) |
|
NPL Coverage |
62.5% |
66.8% |
4.3% |
|
Cost to Income with LLP |
48.6% |
57.9% |
9.3% |
|
Loan to Deposit Ratio |
73.7% |
73.4% |
(0.3%) |
|
Cost to Income Without LLP |
40.9% |
45.1% |
4.2% |
|
Return on Average Assets |
2.8% |
2.4% |
(0.4%) |
|
Return on Average Equity |
17.2% |
14.5% |
(2.7%) |
|
Equity to Assets Ratio |
16.5% |
16.8% |
0.3% |
|
Capital Adequacy Ratios |
|||
|
Ratios |
Q3’2019 |
Q3’2020 |
% point change |
|
Core Capital/Total Liabilitiesal |
0.2% |
||
|
Minimum Statutory ratio |
8.0% |
8.0% |
0.0% |
|
Excess/Deficit |
12.0% |
12.2% |
0.2% |
|
Core Capital/Total Risk Weighted Assets |
15.9% |
16.5% |
0.6% |
|
Minimum Statutory ratio |
10.5% |
10.5% |
0.0% |
|
Excess/Deficit |
5.4% |
6.0% |
0.6% |
|
Total Capital/Total Risk Weighted Assets |
19.4% |
21.3% |
1.9% |
|
Minimum Statutory ratio |
14.5% |
14.5% |
0.0% |
|
Excess/Deficit |
4.9% |
6.8% |
1.9% |
Key take-outs from the earnings release include;
- Core earnings per share declined by 30.8% to Kshs 5.5, from Kshs 8.0 in Q3’2019, not in line with our projections of a 21.9% decline to Kshs 6.3. The performance was driven by an 18.4% increase in total operating expenses to Kshs 9.7 bn from Kshs 8.2 bn in Q3’2019, coupled with a 0.7% decline in total operating income to Kshs 16.8 bn from Kshs 16.9 in Q3’2019. The variance in core earnings per share declined to Kshs 5.5 against our expectation of Kshs 6.3 was largely due to the 65.4% increase in Loan Loss Provisions (LLP) to Kshs 2.1 bn, from Kshs 1.3 bn in Q3’2019,higher than our 26.4% projected increase,
- Interest income rose by 3.0% to Kshs 19.7 bn, from Kshs 19.2 bn in Q3’2019. This was driven by a 16.9% growth in interest income from government securities to Kshs 3.7 bn, from Kshs 3.1 bn in Q3’2019, coupled with a 1.8% increase in interest income from Loans and Advances to 15.8 bn, from 15.5 bn in Q3’2019. The growth in interest income was weighed down by a 45.3% decline in placements income to Kshs 260.0 mn from Kshs 475.5 mn in Q3’2019,
- Yield on interest-earning assets (YIEA) declined to 9.6% from 10.3% in Q3’2019, largely attributable to a faster 8.9% increase in average interest earning assets as compared to the 1.7% growth in trailing Interest Income,
- Interest expense rose by 8.9% to Kshs 9.3 bn, from Kshs 8.6 bn in Q3’2019, following a 6.0% rise in Interest expense on deposits to Kshs 8.2 bn from Kshs 7.8 bn in Q3’2019, coupled with a 214.5% growth in the interest expense on placements to Kshs 0.5 bn, from Kshs 0.2 bn in Q3’2019. Cost of funds increased marginally by 4.0 bps to 4.65% from 4.61% recorded in Q3’2019, following a 9.1% increase in trailing interest expense, which outpaced the 8.2% increase in average interest bearing liabilities,
- Net Interest Margin (NIM) on the other hand, declined to 5.3%, from 6.0% in Q3’2019 due to the 1.7% decline in NII, despite the 8.9% increase in average interest-earning assets,
- Total operating expenses rose by 18.4% to Kshs 9.7 bn from Kshs 8.2 bn in Q3’2019, largely driven by a 65.4% increase in Loan Loss Provisions (LLP) to Kshs 2.1 bn, from Kshs 1.3 bn in Q3’2019, coupled with a 20.6% growth in other operating expenses to Kshs 4.1 bn from Kshs 3.4 bn in Q3’2019. Staff costs on the other hand, declined marginally by 0.2% to Kshs 3.51 bn in Q3’2020, from Kshs 3.52 bn in Q3’2019,
- The balance sheet recorded an expansion as total assets grew by 6.3% to Kshs 344.7 bn, from Kshs 324.3 bn in Q3’2019. The growth was supported by a 70.9% increase in government securities to Kshs 91.4 bn, from Kshs 53.5 bn in Q3’2019, coupled with a 6.7% loan book expansion to Kshs 185.7 bn from Kshs 174.1 bn in Q3’2019. Placements on the other hand declined by 59.2% to Kshs 21.2 bn from Kshs 52.0 bn in Q3’2019,
- Total liabilities rose by 5.3% to Kshs 280.8 bn, from Kshs 266.7 bn in Q3’2019, driven by a 7.0% rise in customer deposits to Kshs 252.8 bn from Kshs 236.2 bn in Q3’2019. The growth was however weighed down by a 12.7% decline in placements to Kshs 9.4 bn, from Kshs 10.8 bn in Q3’2019. Deposits per branch increased by 17.7% to Kshs 3.6 bn from Kshs 3.1 bn in Q3’2019, with the number of branches decreasing from 77 to 70 during the period,
- Gross non-performing loans declined by 6.2% to Kshs 22.6 bn in Q3’2020 from Kshs 24.1 bn in Q3’2019. Consequently, the NPL ratio, improved to 11.2% in Q3’2020, from 12.7% in Q3’2019, attributable to the faster 6.1% growth in gross loans, which outpaced the 6.2% decline in Gross Non-Performing Loans,
- The NPL coverage on the other hand improved to 66.8% in Q3’2020 from 62.5% in Q3’2019, as general Loan Loss Provisions increased by 27.6% to Kshs 10.5 bn from Kshs 8.3 bn in Q3’2019, which was despite a 6.2% decline in gross non-performing loans, and,
- I&M Holdings Plc remains sufficiently capitalized with a core capital to risk-weighted assets ratio of 16.5%, 6.0% points above the statutory requirement. In addition, the total capital to risk-weighted assets ratio came in at 21.3%, exceeding the statutory requirement by 6.8% points.
For a comprehensive analysis, please see our I&M Holdings Q3’2020 Earnings Note
- HF Group
|
HF Group Q3’2020 Key Highlights |
|||
|
Balance Sheet |
|||
|
Balance Sheet Items |
Q3’2019 (Kshs bn) |
Q3’2020 (Kshs bn) |
y/y change |
|
Government Securities |
3.6 |
6.0 |
65.6% |
|
Net Loans and Advances |
39.2 |
37.6 |
(4.1%) |
|
Total Assets |
57.4 |
55.1 |
(4.0%) |
|
Customer Deposits |
34.6 |
38.0 |
9.9% |
|
Deposits per Branch |
1.6 |
1.7 |
8.0% |
|
Total Liabilities |
47.0 |
45.6 |
(3.0%) |
|
Shareholders’ Funds |
10.4 |
9.6 |
(8.5%) |
|
Income Statement |
|||
|
Income Statement Items |
Q3’2019 (Kshs bn) |
Q3’2020 (Kshs bn) |
y/y change |
|
Net Interest Income |
1.7 |
1.6 |
(5.6%) |
|
Net non-Interest Income |
1.1 |
0.4 |
(62.2%) |
|
Total Operating income |
2.8 |
2.0 |
(27.3%) |
|
Loan Loss provision |
(0.6) |
(0.4) |
24.9% |
|
Total Operating expenses |
(2.9) |
(2.7) |
6.0% |
|
Profit before tax |
(0.1) |
(0.7) |
|
|
Profit after tax |
(0.1) |
(0.7) |
|
|
Core EPS |
(0.2) |
(1.9) |
|
|
Key Ratios |
|||
|
Ratios |
Q3’2019 |
Q3’2020 |
% point change |
|
Yield on Interest Earning Assets |
11.3% |
10.3% |
(1.0%) |
|
Cost of Funding |
7.0% |
4.7% |
(2.3%) |
|
Net Interest Margin |
4.5% |
4.2% |
(0.3%) |
|
Non-Performing Loans (NPL) Ratio |
28.2% |
25.4% |
(2.8%) |
|
NPL Coverage |
44.4% |
58.2% |
13.8% |
|
Cost to Income with LLP |
102.9% |
133.2% |
30.3% |
|
Loan to Deposit Ratio |
113.3% |
98.8% |
(14.5%) |
|
Cost to Income Without LLP |
81.8% |
111.4% |
29.6% |
|
Return on Average Assets |
(0.6%) |
(1.3%) |
(0.7%) |
|
Return on Average Equity |
(3.3%) |
(7.6%) |
(4.3%) |
|
Equity to Assets Ratio |
17.6% |
17.8% |
0.2% |
|
Capital Adequacy Ratios |
|||
|
Ratios |
Q3’2019 |
Q3’2020 |
% point change |
|
Core Capital/Total Liabilities |
19.5% |
11.3% |
(8.2%) |
|
Minimum Statutory ratio |
8.0% |
8.0% |
0.0% |
|
Excess/Deficit |
11.5% |
3.3% |
(8.2%) |
|
Core Capital/Total Risk Weighted Assets |
15.1% |
9.6% |
(5.5%) |
|
Minimum Statutory ratio |
10.5% |
10.5% |
0.0% |
|
Excess/Deficit |
4.6% |
(0.9%) |
(5.5%) |
|
Total Capital/Total Risk Weighted Assets |
16.4% |
10.9% |
(5.5%) |
|
Minimum Statutory ratio |
14.5% |
14.5% |
0.0% |
|
Excess/Deficit |
1.9% |
(3.6%) |
(5.5%) |
Key take-outs from the earnings release include;
- HF Group recorded a loss per share of Kshs 1.9 in Q3’2020, higher than the loss per share of Kshs 0.2 recorded in Q3’2019, and in-line with our expectation of a loss per share of Kshs 1.7. The performance of the group can be attributed to a 27.3% decline in total operating income, coupled with a 6.0% decline in total operating expenses,
- Interest income declined by 12.2% to Kshs 3.6 bn, from Kshs 4.4 bn in Q3’2019. This was driven by a 15.8% decline in interest income from loans and advances to Kshs 3.2 bn, from Kshs 3.8 bn in Q3’2019. Interest income on government securities, however, recorded a 25.2% rise to Kshs 391.6 mn, from Kshs 312.8 mn in Q3’2019. The yield on interest-earning assets declined to 10.3%, from 11.3% in Q3’2019, due to the faster 16.0% decline in trailing interest income compared to the 7.2% decline in the average interest-earning assets (IEA),
- Yield on interest-earning assets (YIEA) declined to 10.3%, from 11.3% in Q3’2019, due to the faster 16.0% decline in trailing interest income compared to the 7.2% decline in the average interest-earning assets (IEA),
- Interest expense declined by 16.9% to Kshs 2.0 bn, from Kshs 2.4 bn in Q3’2019, this can be attributed to a 59.5% decline in other interest expenses to Kshs 0.4 bn, from Kshs 1.0 bn in Q3’2019. Interest expenses on customer deposits on the other hand increased by 6.3% to Kshs 1.4 bn in Q3’2020, from Kshs 1.3 bn in Q3’2019, coupled with a 192.4% increase in Deposits and placements from other banks to Kshs 179.6 mn from Kshs 61.4 mn recorded in Q3’2019,
- Net Interest Margin (NIM) increased to 5.5%, from 4.4% in Q3’2019, due to the faster 7.2% decline in the average interest-earning assets, compared to the 5.6% decline in trailing Net Interest Income (NII),
- Total Operating Expenses declined by 6.0% to Kshs 2.7 bn from Kshs 2.9 bn seen in Q3’2019. This is attributable to a 6.2% drop in Other Operating Expenses to Kshs 1.4 bn from Kshs 1.5 bn in Q3’2019, coupled with a 24.9% decline in Loan Loss Provisions to Kshs 0.4 bn from Kshs 0.6 bn in Q3’2019. Staff costs recorded an 8.8% increase to Kshs 839.5 mn from Kshs 771.9 mn recorded in Q3’2019,
- The company’s balance sheet recorded a contraction as total assets declined by 4.0% to Kshs 55.1 bn from Kshs 57.4 bn in Q3’2019. This is attributable to a 4.1% decline in the loan book to Kshs 37.6 bn from Kshs 39.2 bn recorded in Q3’2019 and, a 63.9% decline in placements to Kshs 0.9 bn, from Kshs 2.9 bn in Q3’2019. This was however mitigated by a 65.6% rise in government securities to Kshs 6.0 bn from the Kshs 3.6 bn recorded in Q3’2019,
- Total liabilities declined by 3.0% to Kshs 45.6 bn in Q3’2020, from Kshs 47.0 bn, driven by a 47.2% decline in borrowings to Kshs 5.2 bn, from Kshs 9.9 bn in Q3’2019. This drop can be attributed to the corporate bond that was retired during the last quarter of 2019. There was however a recorded 9.9% rise in Customer deposits to Kshs 38.0 bn from Kshs 33.8 bn in Q3’2019. Deposits per branch increased by 8.0% from Kshs 1.6 bn to Kshs 1.7 bn in Q3’2020, with the number of branches remaining unchanged at 22,
- Gross non-performing loans (NPLs) declined by 11.3% to Kshs 11.2 bn from Kshs 12.6 bn recorded in Q3’2019. Consequently, the NPL ratio improved to 25.4% from the 28.2% following the faster 11.3% decline in NPLs that outpaced the 1.6% decline in gross loans which came in at Kshs 44.1 bn in Q3’2020, from Kshs 44.8 bn recorded in Q3’2019. General loan loss provisions increased by 18.2% to Kshs 3.1 bn in Q3’2020, from Kshs 2.7 bn in Q3’2019,
- NPL coverage increased to 58.2% in Q3’2020, from 44.4% owing to the faster 18.2% increase in general loan loss provisions which outpaced the 11.3% decline in gross NPLs, and,
- HF Group remains undercapitalized with a core capital to risk-weighted assets ratio of 9.6%, 0.9% points below the statutory requirement of 10.5%. In addition, the total capital to risk-weighted assets ratio came in at 10.9%, below the statutory requirement by 3.6% points.
For a comprehensive analysis, please see our HF Group Q3’2020 Earnings Note
Asset Quality:
|
Bank |
Q3’2019 NPL Ratio |
Q3’2020 NPL Ratio |
Q3’2019 NPL Coverage |
Q3’2020 NPL Coverage |
|
HF Group |
28.2% |
25.4% |
44.4% |
58.2% |
|
KCB Group |
8.3% |
15.3% |
56.5% |
58.5% |
|
NCBA Group |
12.4% |
14.1% |
60.2% |
58.3% |
|
Standard Chartered Bank Kenya |
14.9% |
14.8% |
77.0% |
78.2% |
|
Co-operative Bank of Kenya |
10.5% |
13.2% |
55.5% |
50.1% |
|
Stanbic Bank |
10.9% |
12.3% |
58.9% |
61.8% |
|
I&M Holdings |
12.7% |
11.2% |
62.5% |
66.8% |
|
Equity Group |
8.4% |
10.8% |
45.8% |
52.0% |
|
Diamond Trust Bank |
8.9% |
8.7% |
48.0% |
62.5% |
|
ABSA Bank Kenya |
6.8% |
7.6% |
78.6% |
64.9% |
|
Mkt Weighted Average |
9.8%** |
12.4%* |
57.8%** |
59.2%* |
|
*Market cap weighted as at 01/12/2020 **Market cap weighted as at 29/11/2019 |
||||
Key take-outs from the table include;
- Asset quality deteriorated during the period of review, with the NPL ratio rising by 2.6% points to a market cap weighted average of 12.4% from 9.8% in Q3’2019. The deterioration in asset quality was as a result of the coronavirus-induced downturn in the economy which led to an uptick in the non-performing loans,
- NPL Coverage has risen to a market cap weighted average of 59.2% in Q3’2020 from 57.8% recorded in Q3’2019, as the banks increased their provisioning levels to proactively manage risks given the tough economic conditions. We expect higher provisional requirements to subdue profitability during the year across the banking sector on account of the tough business environment, and,
- ABSA, NCBA and COOP recorded a decline in their NPL Coverage despite their NPL ratios rising, which could suggest modest provisioning. Given the current economic environment and elevated risk of loans defaults, we expected high provisioning for the banks. Key to note, during the Co-operative Bank Q3’2020 briefing, management indicated that the decline in the NPL Coverage was attributable to the downgrade on some of the non-performing loan book. The management however indicated that the 123.4% Q/Q and 89.4% Y/Y growth in provisions was an adequate response to the disruption occasioned by the ongoing pandemic more so in the personal consumer sector, which once in a while might not be fully collateralized and as such the Bank had to have higher provisioning for them due to the risk.
The table below highlights the performance of the banks, showing the performance using several metrics, and the key take-outs of the performance.
|
Bank |
Core EPS Growth |
Interest Income Growth |
Interest Expense Growth |
Net Interest Income Growth |
Net Interest Margin |
Non-Funded Income Growth |
NFI to Total Operating Income |
Growth in Total Fees & Commissions |
Deposit Growth |
Growth in Government Securities |
Loan to Deposit Ratio |
Loan Growth |
Return on Average Equity |
|
NCBA |
(67.3%) |
4.8% |
4.1% |
5.3% |
3.2% |
11.8% |
48.7% |
47.7% |
8.1% |
12.5% |
63.0% |
0.4% |
3.9% |
|
ABSA |
(65.4%) |
1.4% |
0.8% |
1.6% |
7.1% |
4.5% |
32.7% |
(10.7%) |
4.7% |
13.1% |
84.9% |
7.8% |
15.2% |
|
KCB |
(43.2%) |
23.0% |
20.8% |
23.7% |
7.8% |
1.5% |
30.8% |
(14.2%) |
31.7% |
83.9% |
74.7% |
18.7% |
13.1% |
|
I&M |
(30.8%) |
3.0% |
8.9% |
(1.7%) |
5.3% |
1.1% |
38.1% |
(5.9%) |
7.0% |
70.9% |
73.4% |
6.7% |
2.4% |
|
SCBK |
(30.4%) |
(5.8%) |
(17.3%) |
(2.4%) |
7.0% |
(8.8%) |
31.1% |
(9.7%) |
8.0% |
7.6% |
1.5% |
11.2% |
12.9% |
|
Stanbic |
(30.2%) |
(5.4%) |
(3.1%) |
(7.3%) |
5.9% |
(18.4%) |
44.5% |
(33.3%) |
18.2% |
103.8% |
70.3% |
7.5% |
12.0% |
|
DTBK |
(27.8%) |
(3.4%) |
(8.9%) |
0.9% |
5.5% |
15.3% |
26.6% |
17.7% |
1.8% |
5.1% |
71.4% |
7.1% |
9.2% |
|
Equity |
(13.9%) |
21.7% |
21.6% |
21.8% |
7.6% |
10.1% |
38.7% |
(1.3%) |
44.5% |
37.2% |
65.7% |
30.1% |
16.9% |
|
Co-op |
(10.2%) |
7.1% |
(3.5%) |
11.7% |
8.0% |
(3.5%) |
36.5% |
(31.7%) |
16.4% |
50.5% |
75.7% |
5.7% |
16.4% |
|
HF Group |
N/A |
(12.2%) |
(16.9%) |
(1.1%) |
4.2% |
(62.2%) |
20.0% |
11.8% |
9.9% |
65.6% |
98.8% |
(4.1%) |
(7.6%) |
|
Q3'20 Mkt Weighted Average* |
(32.4%) |
10.8% |
8.2% |
11.7% |
7.0% |
2.1% |
35.9% |
(7.9%) |
23.1% |
47.4% |
65.6% |
15.0% |
13.0% |
|
Q3'19Mkt Weighted Average** |
8.7% |
4.5% |
4.3% |
4.9% |
7.7% |
15.8% |
37.9% |
22.6% |
11.0% |
3.3% |
75.7% |
11.6% |
19.3% |
|
*Market cap weighted as at 01/12/2020 |
|||||||||||||
|
**Market cap weighted as at 29/11/2019 |
|||||||||||||
Key takeaways from the table above include:
- For the third quarter of 2020, core Earnings Per Share (EPS) recorded a weighted (32.4%) decline, compared to a weighted growth of 8.7% in Q3’2019,
- The sector recorded a weighted average deposit growth of 23.1%, faster than the 11.0% growth recorded in Q3’2019,
- Interest expense, on the other hand, grew faster by 8.2%, compared to 4.3% in Q3’2019. Cost of funds, however, declined, coming in at a weighted average of 2.9% in Q3’2020, from 3.1% in Q3’2019, owing to the faster growth in average interest-bearing liabilities, an indication that the listed banks were able to mobilize cheaper deposits,
- Average loan growth came in at 15.0%, faster than the 11.6% recorded in Q3’2019, but slower than the 47.4% growth in government securities, an indication of the banks preference of investing in Government securities as opposed to lending due to the elevated credit risk occasioned by the pandemic,
- Interest income rose by 10.8%, compared to a growth of 4.5% recorded in Q3’2019. Despite the rise in interest income, the Yield on Interest Earning Assets (YIEA) declined to 9.5% from the 10.3% recorded in Q3’2019, an indication of the increased allocation to lower-yielding government securities by the sector. The decline in the YIEA can also be attributed to the reduced lending rates for customers by the sector, in line with the Central Bank Rate cuts. Consequently, the Net Interest Margin (NIM) now stands at 7.0%, 0.7% points lower than the 7.7% recorded in Q3’2019 for the whole listed banking sector, and,
- Non-Funded Income grew by 2.1% y/y, slower than 15.8% growth recorded in Q3’2019. The performance in NFI was on the back of declined growth in fees and commission of (7.9%), which was slower than the 22.6% growth recorded in Q3’2019. The poor performance of the growth in fees and commission can be attributed to the waiver on fees on mobile transactions below Kshs 1,000 and the free bank-mobile money transfer. Banks with a large customer base who rely heavily on mobile money transactions are likely to take the biggest hit.
For more information, see our Earning notes:
- KCB Group Q3’2020 Earnings Note,
- Co-operative Bank Q3’2020 Earnings Note,
- Equity Group Q3’2020 Earnings Note,
- SCBK Q3’2020 Earnings Note,
- DTB-K Q3’2020 Earnings Note,
- Stanbic Bank Q3’2020 Earnings Note,
- ABSA Q3’2020 Earnings Note,
- NCBA Q3’2020 Earnings Note,
- I&M Q3’2020 Earnings Note, and,
- HF Group Q3’2020 Earnings Note,
Universe of Coverage:
We are currently reviewing our target prices for the Banking Sector coverage.
|
Company |
Price at 27/11/2020 |
Price at 4/12/2020 |
w/w change |
m/m change |
YTD Change |
Year Open |
Target Price* |
Dividend Yield |
Upside/ Downside** |
P/TBv Multiple |
Recommendation |
|
Kenya Reinsurance |
2.1 |
2.2 |
1.9% |
(4.4%) |
(28.7%) |
3.0 |
4.0 |
5.1% |
90.3% |
0.2x |
Buy |
|
Sanlam |
11.0 |
11.0 |
0.0% |
(10.6%) |
(36.0%) |
17.2 |
18.4 |
0.0% |
67.3% |
1.2x |
Buy |
|
Liberty Holdings |
7.5 |
7.1 |
(5.3%) |
(5.5%) |
(31.4%) |
10.4 |
9.8 |
0.0% |
38.0% |
0.6x |
Buy |
|
Britam |
7.2 |
7.2 |
0.0% |
(2.4%) |
(20.0%) |
9.0 |
8.6 |
3.5% |
22.9% |
0.8x |
Buy |
|
Jubilee Holdings |
280.0 |
270.0 |
(3.6%) |
0.2% |
(23.1%) |
351.0 |
313.8 |
3.3% |
19.5% |
0.5x |
Accumulate |
|
CIC Group |
2.1 |
2.1 |
2.9% |
(5.8%) |
(20.9%) |
2.7 |
2.1 |
0.0% |
(0.9%) |
0.7x |
Sell |
|
*Target Price as per Cytonn Analyst estimates **Upside/ (Downside) is adjusted for Dividend Yield ***For Disclosure, these are banks in which Cytonn and/ or its affiliates are invested in |
|||||||||||
We are “Neutral” on equities for investors because, despite the sustained price declines, which have seen the market P/E decline to below its historical average presenting investors with attractive valuations in the market, the economic outlook remains grim.
- Industry Reports
During the month, several industry reports were released and the key take-outs were as follows:
|
# |
Theme |
Report |
Key Take-out |
|
1. |
Residential |
· House prices contracted by 0.1% in Q3’2020, a marginal improvement from the 0.2% contraction in Q2’2020. For more analysis, see Cytonn Weekly #46/2020 |
|
|
|
· House prices recorded sluggish growth increasing by 0.3% over the quarter and 2.3% on an annual basis, attributable to reduced transactions as investors adopt a wait and see approach in the midst of uncertainty and reduced disposable income. For more analysis, see Cytonn Weekly #46/2020 |
||
|
2 |
Land |
|
· Land prices within Nairobi suburbs softened recording a 0.9% decline over the quarter, and 2.2% on an annual basis while satellite towns recorded a marginal drop of 0.1% q/q, attributed to suppressed demand, and an overall increase of 0.5% y/y. For more analysis, see Cytonn Weekly #46/2020 |
|
3. |
General Real Estate |
· The total number of international arrivals through Jomo Kenyatta International Airport (JKIA) and Moi International Airport (MIA) increased from 13,919 persons in August 2020 to 20,164 persons in September 2020. For more analysis, see Cytonn Weekly #47/2020 |
On overall, the real estate sector continues to record sluggish growth attributable to the tough economic environment. Nevertheless, we expect the sector to have increased activities in the residential sector and land sector following the gradual reopening of the economy and government offices such as the National Lands Commission to facilitate the issuing of building approvals, which will result in continued increase in development activities. In addition, the gradual recovery of the tourism industry is expected to boost performance of the hospitality sector.
- Residential Sector
During the month, the Kenyan national government floated to the public, the first lot of 488 completed units at its Park Road low-cost housing project in Nairobi, which have so far been inspected and handed over to the government, with the sale having taken a one-week period. Additionally, the government started allocation of the first block of 160 units at the aforementioned project. The tenants are expected to move into the houses in February, becoming the first owners of the ongoing Kshs 5.0 bn Pangani Estate renewal project. For one to move into the house, they’ll need to have paid 12.5% of the house value as a deposit, and outline how they intend to pay the balance in cash or mortgage. The project consists of eight blocks of 30 SQM 1-bed, 40 SQM 2-bed and 60 SQM 3-bed social housing units selling at Kshs 1.0 mn, Kshs 2.0 mn and Kshs 3.0 mn, respectively, which translates to Kshs 52,083 per SQM. On completion, the project will have a total of 1,562 affordable and market housing units. Key to note, the project which was launched in December 2018, has been encountering delays in its implementation due to bureaucracy and lack of land documentation.
The affordable housing programme has continued to take shape with approximately 228 housing units completed in October 2019 through the Park Road Project Phase 1, while other projects such as Shauri Moyo, Makongeni and Starehe houses are still underway. Despite the growing demand for the affordable housing units, evidenced by the relatively high number of approximately 300,000 individuals who have registered through the boma yangu portal, the implementation of affordable housing projects has been sluggish and the initiative is expected to fall short of its 2022 target of delivering 500,000 housing units. Some of the challenges facing the initiation and implementation of the projects include; (i) bureaucracy and slow project approval processes, (ii) the pending operationalization of the Integrated Project Delivery Unit which was tasked with being a single point of regulatory approval for developments, infrastructure provision and developer incentives, (iii) failure to fast track incentives provided in support of the affordable housing initiative, (iv) ineffectiveness of Public-Private Partnerships, and, (v) the current economic slowdown due to the ongoing pandemic.
In our view, the handing over of the 160 units will enhance Kenyans’ confidence in the affordable housing programme thus encouraging more potential home owners to join the boma yangu platform. However, given the negligible number of units delivered compared to existing demand, we expect the housing deficit to expand even further driven by the relatively high population growth of 2.2% per annum, compared to the global average of 1.9% according to World Bank. Therefore, to accelerate the supply of housing units, the government must embark on resolving the above challenges in addition to investing in urban planning to enhance sustainability and also invest in infrastructure around the satellite towns to open them up.
Other notable highlights for the month include:
- Centum Real Estate launched a Kshs 2.0 bn housing project dubbed Loft Residences in Gigiri area, set for completion in 2022, and is expected to have 56 units on 7 blocks. For more information, see Cytonn Weekly #46/2020,
- Acorn Group, a Kenya-based real estate developer, announced that it is set to build two hostels under the Qejani and Qwetu brands, to be located next to the University of Nairobi Chiromo Campus, along Science Crescent Road, off Riverside Road to host approximately 3,000 students. For more information, see Cytonn Weekly #46/2020,
- Centum Real Estate, through its project development arm, Two Rivers Development Limited, submitted regulatory filings to the National Environmental Management Authority seeking approval to begin construction of a residential development dubbed Mzizi Court in Two Rivers Development, along Limuru Road. For more information, see Cytonn Weekly #47/2020,
- Fairdeal Properties, a real estate developer, announced plans to develop a 229-unit residential project dubbed Fairvalley Heights, to be located in Gimu area, near CITAM Athi River in Mavoko at a cost of Kshs 500.0 mn. For more information, see Cytonn Weekly #47/2020,
- Hydro Developers Limited, a real estate developer based in Nairobi, partnered with the Kenyan government for the construction of approximately 30,489 affordable units under the Big Four Agenda, at a cost of Kshs 3.0 bn. For more information, see Cytonn Weekly #48/2020, and,
- The Capital Markets authority granted approval for Centum Real Estate to issue a Kshs 4.0 bn bond to finance ongoing housing projects in Kenya. For more information, see Cytonn Monthly- October 2020.
We expect the residential sector to record increased activities driven by the launching of several projects, the ongoing focus on the implementation of affordable housing projects and provision of student housing accommodation.
- Retail Sector
During the month, Carrefour Supermarket, opened its first outlet in Mombasa County at City Mall in Nyali, bringing its total number of operational outlets to 9 countrywide. This follows the opening of its Mega Mall outlet along Uhuru Highway in Nairobi, a space previously occupied by Nakumatt, in June this year. The retailer had also announced plans to open two other outlets at Centre Point Plaza in Diani and Shanzu Mall in Shanzu by the end of the year. The multinational retailer has continued to expand its foothold in the Kenya retail market since its first store in 2016 supported by; i) its ability to leverage on its scale and operational know-how to become one of the leading retailers locally, ii) availability of funding evidenced by the Kshs 3.0 bn loan from Standard Bank Group in May this year, and, iii) availability of prime locations vacated by struggling supermarket chains such as Nakumatt and Uchumi.
The expansion to Mombasa has been supported by; i) positive demographics with the population having grown from 0.5 mn in 2009 to 1.2 mn in 2019 according to Kenya National Bureau of Statistics data, ii) improved infrastructure such as the ongoing construction of the Dongo- Kundu bypass enhancing ease of accessibility, iii) a growing middle class with increased purchasing power, and, iv) tourist activities which has created a customer base with need for goods and services. In terms of performance, according to the Kenya Retail Report 2020, Mombasa recorded an average rental yield of 6.6%, 0.1% points lower than the market average of 6.7% in key urban cities. Occupancy rates of retail spaces recorded a 3.0% point’s increase to 76.3% in 2020 from 73.3% in 2019 attributed to the reduced rental rates, from Kshs 123 per SQFT in 2019 to Kshs 114 in 2020, owing to reduced demand for retail space as some retailers shut down shops to cushion themselves from the effects of the Covid-19 pandemic.
The table below shows the performance of key urban cities in 2020;
|
Summary of Retail Performance in Key Urban Cities in Kenya |
|||
|
Region |
Rent/SQFT 2020 |
Occupancy 2020 |
Rental Yield 2020 |
|
Mount Kenya |
125.0 |
78.0% |
7.7% |
|
Nairobi |
168.5 |
74.5% |
7.5% |
|
Mombasa |
114.4 |
76.3% |
6.6% |
|
Kisumu |
97.2 |
74.0% |
6.3% |
|
Eldoret |
130.0 |
80.2% |
5.9% |
|
Nakuru |
55.7 |
76.6% |
5.9% |
|
Average |
115.1 |
76.6% |
6.7% |
Source: Cytonn Research 2020
The table below shows a summary of the number of stores of main local and international retail chains in Kenya;
|
Main Local and International Retail Supermarket Chains |
||||||
|
Name of Retailer |
Initial number of branches |
Number of branches opened in 2020 |
Closed branches |
Current number of Branches |
Branches expected to be opened / closed |
Projected total number of branches |
|
Naivas Supermarket |
61 |
7 |
0 |
68 |
2 |
70 |
|
Tuskys |
64 |
2 |
14 |
52 |
27 |
25 |
|
QuickMart |
29 |
6 |
0 |
35 |
0 |
35 |
|
Chandarana Foodplus |
19 |
1 |
0 |
20 |
0 |
20 |
|
Carrefour |
7 |
2 |
0 |
9 |
2 |
11 |
|
Uchumi |
37 |
0 |
33 |
4 |
0 |
4 |
|
Game Stores |
2 |
1 |
0 |
3 |
0 |
3 |
|
Choppies |
15 |
0 |
13 |
2 |
0 |
2 |
|
Shoprite |
4 |
0 |
2 |
2 |
0 |
2 |
|
Nakumatt |
65 |
0 |
65 |
0 |
0 |
0 |
|
Total |
303 |
19 |
127 |
195 |
31 |
172 |
Source: Online research
Other notable highlights during the month include;
- Tuskys Supermarket a local retail chain, shut down four of its branches namely; Tuskys Magic branch in Nakuru Town, Tuskys Pioneer on Moi Avenue Street in Nairobi, Adams Arcade branch on Ngong Road and the Kitengela branch. The retailer also announced plans to close down half of its branches, in an attempt to stabilize operations amid financial woes. For more analysis, see Cytonn Weekly #45/2020, and Cytonn Weekly #47/2020,
- QuickMart supermarket, a local retail chain, opened an outlet in Nanyuki Mall, Nanyuki town, bringing the total number of Quickmart’s outlets to 35, with 6 outlets opened in 2020. For more analysis, see Cytonn Weekly #46/2020, and,
- Naivas supermarket, opened two branches one in Hazina towers in Nairobi CBD taking up space previously occupied by Nakumatt Lifestyle and House of Leather which relocated to another location, and the other at Ananas Mall in Thika Town taking up space left behind by struggling retailer, Tuskys, bringing its operational outlets to 68. The retailer had in October announced plans to open an outlet in Rongai, and another one location currently remains undisclosed. For more information, see Cytonn Weekly #48/2020.
Despite the continued scaling down of operations by retailers such as Tuskys and Shoprite, with the former planning to reduce its operational branches by half while the latter is set to exit the market by the end of the year, we expect the performance of the retail sector to be cushioned by the continued expansion by local and international chains taking up prime spaces left behind by struggling counter parts supported by; i) continued improvement of infrastructure opening up areas for investment, ii) relatively high population growth rate, and, iii) the growing middle class with increased purchasing power.
- Hospitality Sector
During the month, the United States (US) government issued a travel advisory to Kenya, citing an increase in the number of COVID-19 cases. The move is expected to result in a decline in the number of tourist arrivals with the USA being one of the key tourist market for Kenya, thus a resultant negative impact on the hospitality sector which relies mainly on tourism and meetings, incentives, conferences and exhibitions (MICE). According to the Tourism Research Institute the number of international arrivals recorded a 72.0% drop to 470,971 between January to October compared to 1,718,155 international arrivals during a similar period last year. Approximately 260,164 of the tourists came to visit for leisure, while approximately 165,358 were business travellers. According to the report, Uganda was the largest source market bringing in 60,399 arrivals and was closely followed by the United States of America at 53,444 arrivals.
The graph below shows the number of international arrivals in Kenya between January and October in 2020;
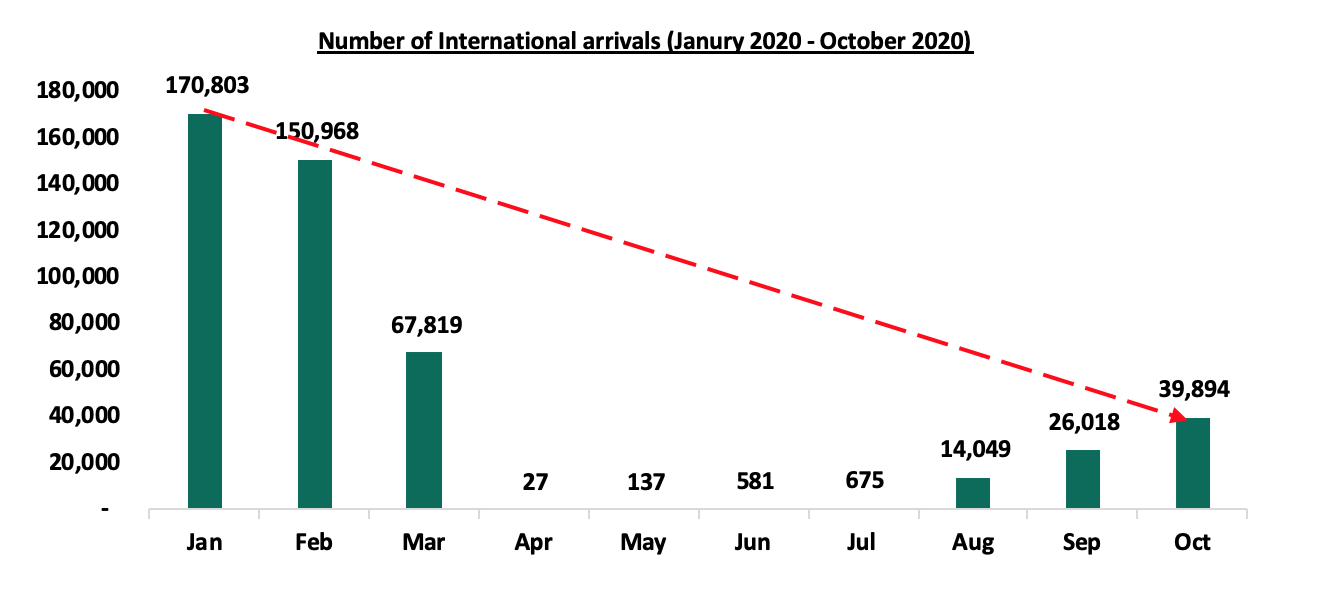
Source: Tourism Research Institute
The government announced plans to merge the management of its two iconic conferencing facilities, Bomas of Kenya with the Kenyatta International Convention Centre (KICC), in efforts to accelerate the recovery of the tourism sector. Bomas is used for holding events and hosting heritage for tourism while KICC hosts meetings, incentives, conferences and exhibitions (MICE). The tourism industry was the hardest hit by the Covid-19 pandemic due to travel bans and restrictions that led to cancellation of meetings and conferences and a resultant cessation of operations in key hospitality facilities especially in the second and third quarters of the year due to reduced demand for the same. However, the sector has been gradually recovering following the easing of travel restriction in and out of the country, opening up of key tourism markets such as Asia, resumption of flight operations starting 1st August, reopening of hospitality facilities, government strategies to support the recovery of the sector such as the Ministry of Tourism Post-Corona recovery funds aimed at offering financial aid to hotel and other establishments in the hospitality industry through the Tourism Finance Corporation (TFC), repackaging of the tourism sector products to appeal to domestic tourists, and relaxation of travel advisories aiming at increasing the number of international tourist arrivals into the country. Others factors boosting the hospitality sector include; recognition of Kenya as a regional hub, improved security and political stability.
Other highlights during the month;
- Kenya was voted as Africa’s leading tourist destination in the World Travel Awards, supported by the epic savannah landscapes, wildlife, beaches and lakes among other tourist attraction centres. Kenyatta International Conference Centre (KICC) was voted as Africa’s leading meeting and conference centre, Fairmont Mount Kenya grabbed the title of Africa’s leading hotel, while the Aberdare Country Club was voted Africa’s leading Green Hotel. Additionally, Kenya Airways was ranked as Africa’s leading Airline-business classes and Africa’s leading Airline-economy class. For more information, see Cytonn Weekly #46/2020.
We expect the sector to recover gradually with the resumption of tourism activities coupled by government’s supportive strategies such as the Ministry of Tourism post-corona recovery funds aimed at offering financial aid to hotel and other establishments in the hospitality industry through the Tourism Finance Corporation (TFC), repackaging of the tourism sector products to appeal to domestic tourists, relaxation of travel advisories and reopening of Kenya’s key tourism markets. The second wave of the pandemic in some markets, coupled by travel advisories as in the case of USA, is however expected to continue affecting tourist arrivals and thus negatively impacting on the hospitality sector.
- Infrastructure
During the month;
- The Kenyan government through the Kenya Rural Roads Authority, a state corporation within the State Department of Infrastructure, commenced the tarmacking of the first 7.0 km of Juja Farm Road in Kiambu County at a cost of Kshs 3.9 bn. The road is part of Kshs 30.0 bn Mau Mau roads that are being constructed in Murang’a, Nyeri and Kiambu Counties and set for completion in six months starting November. For more information, see Cytonn Weekly #45/2020, and,
- Kenya Urban Roads Authority (KURA), announced plans to construct two elevated carriage ways in the Nairobi Central Business District (CBD). The Kshs 2.9 bn project which has been assigned to China Road and Bridge Corporation will take shape after the completion of the Nairobi Expressway which is currently under construction by the Kenya National Highways Authority (KENHA), and is expected to be completed by 2023. For more information, see Cytonn Weekly #48/2020.
We expect the government to continue with the implementation of select projects, opening up areas for development and thus boosting the real estate sector. Other ongoing infrastructural projects include construction of; i) Nairobi Expressway, ii) Nairobi Western Bypass, and, iii) Lamu Port Access Road among others.
- Listed Real Estate
In the month of November, the Fahari I-REIT closed the month at Kshs 5.5 per share, trading at an average of Kshs 5.4 during the month, a 43.8% loss of value on YTD from Kshs 9.6 recorded in January 2020, and 73.0% drop from its initial price of Kshs 20.0 as at November 2015. The REIT is expected to continue recording subdued performance attributable to lack of investor appetite in the instrument and the continued subdued performance of the real estate market as it continues to grapple with the effects of the COVID-19 pandemic.
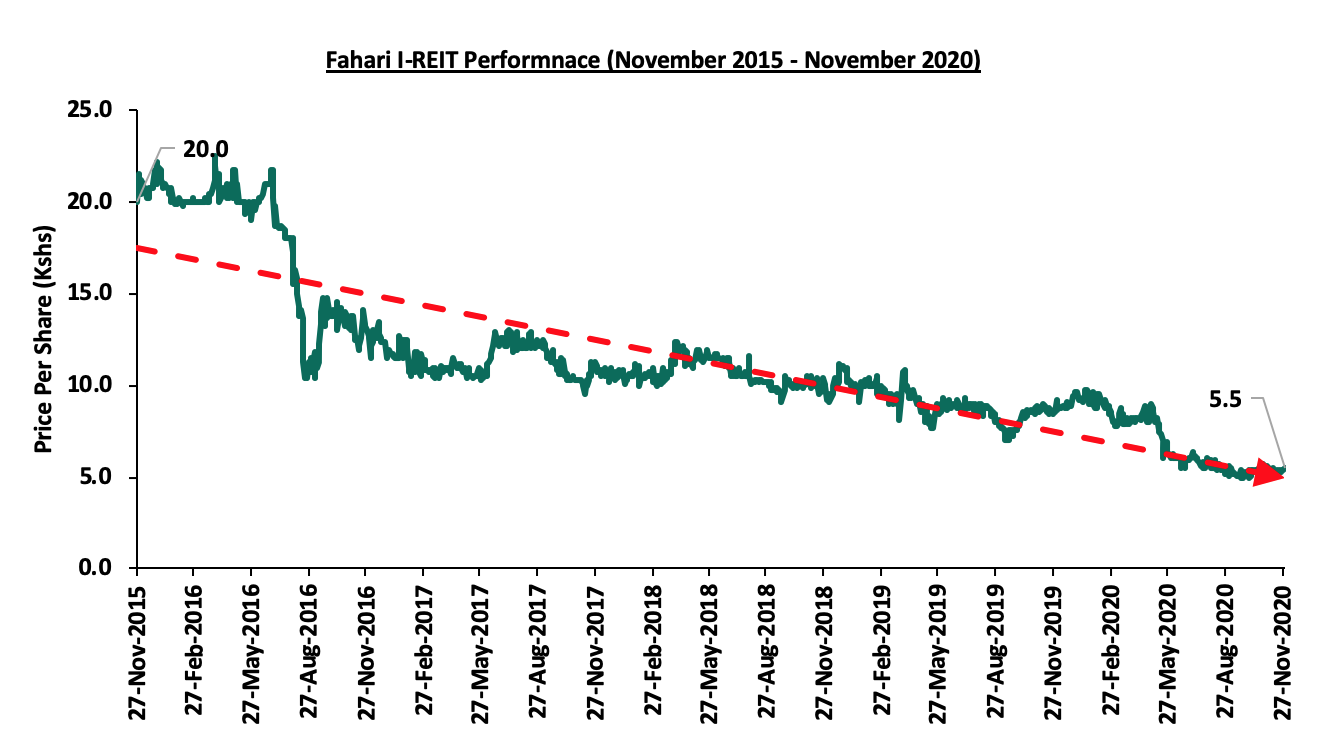
A notable highlight in the sector was;
- Acorn Investment Management Limited, a subsidiary of Acorn Holdings, was granted a Real Estate Investment Trust (REIT) manager license by the Capital Markets Authority (CMA) following the fulfilment of applicable regulations. Acorn is in the process of establishing a Development Real Estate Investment Trust (D-REIT) to finance the student hostels, and an Investment real estate investment trust (I-Reit) to acquire property for rental income. For more information, see Cytonn Weekly #47/2020, and, Cytonn Weekly #41/2020.
We expect real estate sector performance to improve supported by; i) increased activities in support of the affordable housing agenda, ii) expansion by local retailers, iii) strategies put in place to support recovery of the tourism industry boosting the hospitality sector, and, iv) implementation of infrastructural projects.
In 2019, we published the Nairobi Metropolitan Area Serviced Apartments Report 2019, which highlighted that serviced apartments within the NMA recorded an average rental yield of 7.6%, 0.2% points higher than the 7.4% recorded in 2018, and this was attributed to a 2.3% increase in monthly charges per SQM, from Kshs 2,742 in 2018 to Kshs 2,806 in 2019, fuelled by the continued demand for serviced apartments by both guests on business and leisure travels. The improved performance was overally supported by the stable political environment and improved security, thus making Nairobi an ideal destination for both business and holiday travellers. This year, we update our report findings on the same by focusing on:
- Overview of the Kenyan Hospitality Sector,
- Introduction to Serviced Apartments sector,
- Supply and Distribution of Serviced Apartments within the Nairobi Metropolitan Area,
- Performance of Serviced Apartments in the Nairobi Metropolitan Area,
- Serviced Apartments Performance by Node
- Comparative Analysis- 2019/2020 Market Performance
- Performance per Typology
- Recommendation and Outlook.
Section I: Overview of the Kenyan Hospitality Sector
The hospitality sector was the worst hit by the COVID-19 pandemic as businesses either closed down completely or operated under minimal capacity. This was mainly due to the reduced number of tourist arrivals as the government issued a travel ban on international flights into and outside the country and the restriction of movement in select cities within the country. As a result of the fear of contracting the virus and adhering to social distancing measures enforced by the government, hotels and restaurants recorded significantly low occupancy rates especially in Q2’2020 and Q3’2020. The negative impact of the pandemic is evidenced by the decline in the hospitality sector’s contribution to GDP through accommodation and food services by 83.3% during the second quarter of 2020 compared to an expansion of 12.1% during the same period in 2019, according to the KNBS Quarterly Gross Domestic Product Report – Q2'2020. The total number of international arrivals through Jomo Kenyatta International Airport (JKIA) and Moi International Airport (MIA) recorded a 71.5% decline from 1.2 mn persons between January to September 2019 to 0.3 mn during the same period in 2020. This is however an increase from 13,919 persons in August 2020 to 20,164 persons in September 2020 according to the Kenya National Bureau of Statistics (KNBS), Leading Economic Indicators - September 2020, indicating the gradual recovery of the tourism sector. Despite this, the sector has remained resilient evidenced by investor focus, with Accor Hotels and Radisson Hotel Group announcing that they would continue with their expansion plans in Kenya and the African region as a whole despite the slump in the sector due to the COVID-19 pandemic. Additionally, Hyatt, a US-based hospitality chain announced plans to build a 225-room facility in Nairobi along Mombasa road, marking the brand’s entry into the Kenya hospitality market. The move by these brands shows investor confidence in the Kenya’s hospitality industry despite being one of the hardest hit by the COVID-19 pandemic.
Some of the factors that continue to cushion the hospitality sector include;
- Gradual Recovery of the Tourism Industry: The relaxation of travel advisories and reopening of Kenya’s key tourism markets is expected to enhance recovery of the tourism industry thus a resultant boost to the hospitality sector,
- Post-Corona Hospitality Sector Recovery Stimulus by the Ministry of Tourism: The Ministry of Tourism put in place the Post-Corona recovery funds aimed at offering financial aid to hotels and other establishments in the hospitality industry through the Tourism Finance Corporation (TFC),
- Repackaging of the Tourism Sector Products to Appeal to Domestic Tourists: The government and other industry players in the hospitality industry have been making efforts to repackage the tourism products targeting domestic tourists. This has been through; making domestic travel more attractive through campaigns, organized road transport to events and tourist attraction sites, and doing more research on domestic market preferences,
- Improved Security: The security of Kenya has improved evidenced by reduced terrorist attacks. This has boosted the confidence of tourists thus a preferred travel destination for both holiday and business travellers,
- Travel Tourism: Travel tourism is one of the key drivers of the Kenya’s hospitality sector evident by the number of international arrivals into the country through the main airports in Kenya; Jomo Kenyatta International Airport and Moi International Airport. The total number of international arrivals through Jomo Kenyatta International Airport (JKIA) and Moi International Airport (MIA) increased from 13,919 persons in August 2020 to 20,164 persons in September 2020. This signals the gradual recovery of the tourism industry thus enhancing the demand hospitality services and facilities. The graph below shows the number of international arrivals in Kenya in the last five years;
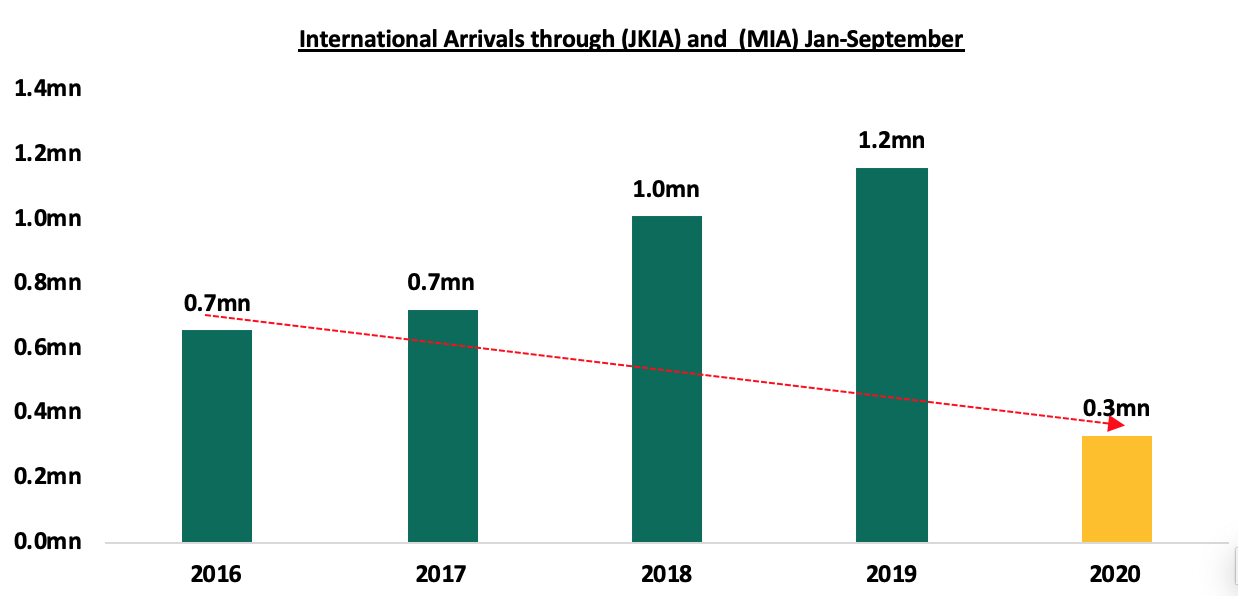 Source: Kenya National Bureau of Statistics
- Recognition of Nairobi as a Regional Hub: Nairobi’s strategic geo-positioning and improving infrastructure sets it apart as a preferable regional hub for the East African Community and this has continued to enhance the growth of business travellers into the country, and,
- Positive Accolades: Kenya’s hospitality facilities have continued to receive global recognition despite the pandemic thus boosting the status of the country as a preferred travel destination globally. Kenya was recently voted as Africa’s leading tourist destination in the World Travel Awards, supported by the epic savannah landscapes, wildlife, beaches and lakes among other tourist attraction centres. Kenyatta International Conference Centre (KICC) was voted as Africa’s leading meeting and conference centre (MICE), while Fairmont Mount Kenya grabbed the title of Africa’s leading hotel, and the Aberdare Country Club was voted Africa’s leading Green Hotel. Additionally, Kenya Airways was ranked as Africa’s leading Airline-business classes and Africa’s leading Airline-economy class.
Nevertheless, the sector continues to face challenges among them;
- The COVID-19 Pandemic- The hospitality sector was significantly affected by the COVID-19 pandemic due to overreliance on tourism and Meetings Incentives Conferences and Events (MICE). This was occasioned by the government issuing a travel ban on all international flights and implementation of strict measures that led to the temporary closure of major hospitality facilities. The sector is however on the road to recovery following the easing of travel restrictions in the country in Q3’2020, lifting of the ban on domestic and international flights and the reopening of Kenya’s key tourism markets. However, the pandemic is yet to be mitigated with some countries experiencing a second wave and this continues to affect the hospitality sector,
- Travel Advisories: Despite political stability and elongated prevalence of peace within the country, Kenya still suffers from risk prone travel advisories. For instance, in October 2020, the government of the United States advised its citizens to exercise increased caution in Kenya due to crime, terrorism, health issues, and kidnapping, and,
- Reduced Private Sector Lending: Most of lenders have largely pulled back or ceased new lending to business on overall with the Kenyan hospitality industry not exempted. In addition, the market has slowed down as lenders exercise more a conservative underwriting approach as a strategy to cushion themselves against the pandemic which is marked by high loan default rates.
Section II: Introduction to Serviced Apartments
To reiterate our 2019 Topical, a serviced apartment is a type of furnished apartment available for short-term or long-term stays, which provides amenities for daily use and housekeeping services all included in the rental charges. The serviced apartments provides facilities much like the traditional hotels however, they have added space, convenience and privacy just like home so that the occupants gets to enjoy their stay. The concept of serviced apartments has been popularised over the years as travellers continue to find them more convenient, credible, easily available and cost effective. They are also convenient for families and people who opt for the longer stays.
The advantages of a serviced apartment include;
- Extra room services are offered as opposed to traditional hotels such as laundry services and general housekeeping,
- Substantially cheaper than a hotel room when staying for a longer period of time. For example, a standard 3-star hotel in Nairobi, Gigiri area charges on average Kshs 6,500 per night for a suite, while a studio serviced apartments charges on average Kshs 5,600 per night within the same location,
- Serviced apartments offers a “home far from home” feel compared to hotels. Has utilities available which makes them more comfortable and convenient,
- Offers the ease of integration, as the concept offers guests a chance to integrate with the larger community as they are located within or in close proximity to other residential developments,
- Some serviced apartments are designed to resemble the culture of some specific areas. This gives insight into what a real local apartment would look like, giving a more comprehensive immersion of the culture and values compared to hotel rooms, which usually all look alike, and,
- The easy conversion, as serviced apartments can easily be converted into furnished or normal apartments in the case where the former is not performing well.
Section III: Supply and Distribution of Serviced Apartments in the Nairobi Metropolitan Area
The number of serviced apartments within the Nairobi Metropolitan Area (NMA) increased by a 6-Year CAGR of 8.6% to 5,594 apartments in 2020, from 3,414 apartments in 2015, with one of the key facilities coming into the market this year being 106-room Emara Hotel Ole Sereni located along Mombasa Road.
In terms of distribution, Westlands and Kilimani has the largest market share of serviced apartments within the Nairobi Metropolitan Area, at 38.4% and 26.3%, respectively. This is attributed to the attractiveness of the areas due to; (i) proximity to the Nairobi CBD and other major business nodes such as UpperHill and Westlands, ii) relatively good infrastructure within the area, iii) high presence of international organizations such as International Committee of the Red Cross (ICRC), Oxfam and Save the Children International, and, iv) availability of social amenities such as shopping malls within the area.
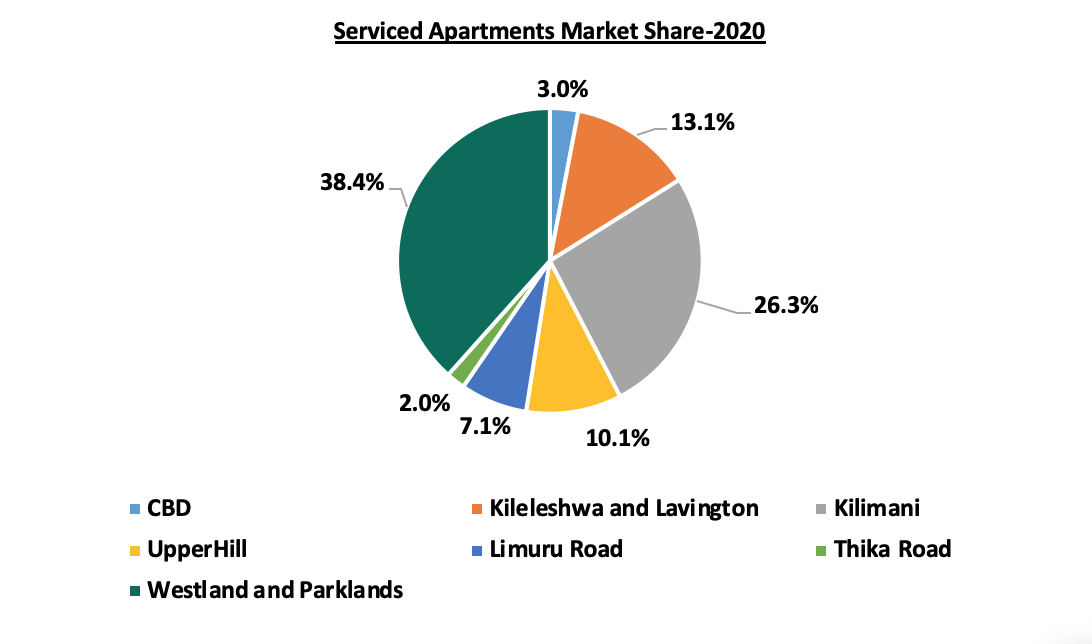
Source: Cytonn Research 2020
Currently, there are at least 804 apartment keys in the development pipeline set for completion by 2021. Some of the developments in the pipeline include:
|
Serviced Apartments Developments in the Pipeline within the NMA |
||||
|
Name |
Developer |
Location |
Number of Keys/Rooms |
Completion |
|
Skynest |
Elegant Properties |
Westlands |
250 |
2021 |
|
Britam |
Britam |
Kilimani |
163 |
2021 |
|
Sun Africa Luxury Apartments |
Sun Africa Hotels Group |
Kilimani |
20 |
2021 |
|
9 Oak |
Mifta Holdings |
Kilimani |
120 |
2021 |
|
Avic |
Avic |
Westlands |
51 |
2021 |
|
Elsie Ridge |
Intime Group |
Spring Valley |
40 |
2021 |
|
Habitat |
Ekco Investments |
Kilimani |
160 |
2021 |
|
Total |
804 |
|||
Source: Cytonn Research 2020
Section IV: Performance of Serviced Apartments in the Nairobi Metropolitan Area
For the purpose of this report, we tracked the performance of serviced apartments in 7 nodes within the Nairobi Metropolitan Area and compared this to the performance to 2019. The key metrics we looked at include:
- Charged Rates: This is the amount guests pay for an apartment in a specific market, on a daily basis, weekly and/or monthly. It informs potential investors on the rental income they are likely to gain from investing in serviced apartments,
- Occupancy Rates: This measures the number of apartments that are let out of the total available, in order to inform on the expected rental yield of the developments, and,
- Rental Yields: This refers to the measure of return on the real estate investment, from the rental income collected annually. The rental yield informs potential investors on the return they are likely to get from a property and hence the time it will take an investor to recoup the money invested. To calculate this, we have estimated annual income from monthly revenues having deducted operational costs assumed to be at 40.0% of revenues. To estimate the investment value, we have calculated development cost per SQM by factoring in land costs based on the location, construction costs, equipping costs, professional fees and other development-related costs. The formula to calculate rental yield is as follows;
Rental Yield= Monthly Rent per SQM x Occupancy Rate x (1-40.0% operational cost) x 12 months
Development Cost per SQM
*Important to note, however, is that depending on the actual incurred land cost, plot ratios, the level of finishing and equipping, investors will generally incur varying costs.
On performance, we will start by covering the performance by the node during the year, compare this with 2019 performance, then cover the performance by typology.
- Serviced Apartments Performance by Node
For our analysis, serviced apartments within the NMA recorded an average rental yield of 4.0% in 2020, 3.6% points lower than the 7.6% recorded in 2019. This is attributed to declines in monthly charges per SQM and occupancies from Kshs 2,806 to Kshs 2,445 and from 79.4% to 48.0%, respectively. The decline in performance is attributable to subdued demand for hospitality facilities and services due to the COVID-19 pandemic which saw the government ban all international flights and local flights into Mombasa and Nairobi, implement partial lockdown within the NMA among other restrictive measures aimed at curbing the spread of the virus. Some serviced apartments have also been issuing discounts to attract and maintain clients amid a tough economic environment occasioned by reduced disposable income.
The table below shows a summary of the performance of the various nodes within the NMA:
(All values in Kshs unless stated otherwise)
|
2020 NMA Serviced Apartments Performance per Node |
||||||||||||
|
Unit Sizes (SQM) |
Monthly Charges per Unit (Kshs) |
|||||||||||
|
Node |
Studio |
1 Bed |
2 Bed |
3 Bed |
Studio |
1 Bed |
2 Bed |
3 Bed |
Occupancy 2020 |
Monthly Charge per SQM(Kshs) 2020 |
Devt Cost per SQM(Kshs) |
Rental Yield |
|
Westlands& Parklands |
37 |
57 |
88 |
114 |
196,000 |
231,811 |
307,734 |
324,000 |
49.4% |
3,578 |
209,902 |
6.1% |
|
Kilimani |
47 |
75 |
114 |
193 |
147,375 |
203,333 |
335,000 |
407,500 |
48.4% |
2,783 |
202,662 |
4.8% |
|
Limuru Road |
44 |
52 |
79 |
116 |
122,000 |
174,093 |
207,143 |
270,000 |
51.4% |
2,839 |
231,715 |
4.5% |
|
Kileleshwa& Lavington |
38 |
91 |
128 |
166 |
112,000 |
198,510 |
296,773 |
433,200 |
48.1% |
2,553 |
206,132 |
4.3% |
|
UpperHill |
95 |
119 |
195 |
190,000 |
290,000 |
373,333 |
48.9% |
2,121 |
209,902 |
3.6% |
||
|
Nairobi CBD |
51 |
82 |
85 |
119 |
104,500 |
148,188 |
207,167 |
295,250 |
42.1% |
2,122 |
224,571 |
2.9% |
|
Thika Road |
70 |
101 |
145 |
100,000 |
190,000 |
275,000 |
48.1% |
1,138 |
200,757 |
2.0% |
||
|
Average |
43 |
75 |
102 |
150 |
136,375 |
177,991 |
261,974 |
339,755 |
48.0% |
2,448 |
212,234 |
4.0% |
|
High |
51 |
95 |
128 |
195 |
196,000 |
231,811 |
335,000 |
433,200 |
51.4% |
3,578 |
231,715 |
6.1% |
|
Low |
37 |
52 |
79 |
114 |
104,500 |
100,000 |
190,000 |
270,000 |
42.1% |
1,138 |
200,757 |
2.0% |
|
||||||||||||
Source: Cytonn Research 2020
- Comparative Analysis- 2019/2020 Market Performance
Overall, serviced apartments’ performance softened with the occupancy rates declining by 31.3% points to 48.0% from 79.4%; the monthly charges per SQM also declined by 14.9% from Kshs 2806 to Kshs 2,448 while the average rental yield declined by 3.6% points to 4.0% in 2020 from 7.6% in 2019. This is mainly attributable to a reduction in the number of tourist arrivals due to the COVID-19 pandemic, and the tough economic environment.
The table below shows the comparative analysis:
(All values in Kshs unless stated otherwise)
|
Comparative Analysis-2019/2020 Market Performance |
||||||||||
|
Node |
Occupancy 2019 |
Occupancy 2020 |
Occupancy rates ∆ |
Monthly Charge per SQM (Kshs) 2019 |
Monthly Charge per SQM (Kshs) 2020 |
∆ in Monthly Charge Per SQM (Kshs) |
% Change of Monthly Charges |
Rental Yield 2019 |
Rental Yield 2020 |
∆ in Rental Yield |
|
Westlands& Parklands |
80.8% |
49.4% |
(31.4%) |
3,884 |
3,578 |
(306) |
(8.6%) |
10.8% |
6.1% |
(4.7%) |
|
Kilimani |
80.0% |
48.4% |
(31.6%) |
3,353 |
2,783 |
(570) |
(20.5%) |
9.5% |
4.8% |
(4.7%) |
|
Limuru Road |
88.2% |
51.4% |
(36.8%) |
3,430 |
2,839 |
(591) |
(20.8%) |
9.4% |
4.5% |
(4.8%) |
|
Kileleshwa& Lavington |
82.4% |
48.1% |
(34.3%) |
2,845 |
2,553 |
(292) |
(11.4%) |
8.2% |
4.3% |
(3.9%) |
|
UpperHill |
67.8% |
48.9% |
(18.9%) |
2,577 |
2,121 |
(456) |
(21.5%) |
6.0% |
3.6% |
(2.4%) |
|
Nairobi CBD |
72.0% |
42.1% |
(29.9%) |
2,230 |
2,122 |
(108) |
(5.1%) |
5.1% |
2.9% |
(2.2%) |
|
Thika Road |
84.4% |
48.1% |
(36.3%) |
1,321 |
1,138 |
(183) |
(16.1%) |
4.0% |
2.0% |
(2.0%) |
|
Average |
79.4% |
48.0% |
(31.3%) |
2806 |
2448 |
(358) |
(14.9%) |
7.6% |
4.0% |
(3.6%) |
|
||||||||||
Source: Cytonn Research 2020
- Westlands and parklands was the best performing node with a rental yield of 6.1% compared to the market average of 4.0%. The submarket recorded a decline in rental charges by 8.6% compared to an overall decline of 14.9% attributed to a growing preference of the area given its the proximity to business nodes such as Kilimani, Westlands and the Nairobi CBD, availability of high quality serviced apartments, ease of accessibility, and proximity to most international organizations.
- Kilimani was the second best performing node with average rental yields of 4.8% compared to market average of 4.0%. This is however a decline of 4.7% points attributed to 31.6% decline in occupancy rates and 20.5% correction in the monthly charges per SQM.
- Performance by Typology
In terms of performance by typology, studio units recorded the highest average rental yield at 5.4%, mainly attributed to the relatively high occupancy rates at 49.6%, compared to 1, 2 and 3 bedroom units at 44.9%, 49.0% and 49.0%, respectively, and a 27.7% higher charge per SQM of Kshs 3,276 compared to the market average of Kshs 2,565, amid the relatively low supply of the typology in the market.
The table below shows the summary of performance by typology:
(All values in Kshs unless stated otherwise)
|
Summary per Typology 2020 |
||||
|
Typology |
Average Size (SQM) |
Monthly Charges per SQM |
Occupancy |
Rental Yield |
|
Studio |
43 |
3,276 |
49.6% |
5.4% |
|
One bedroom |
75 |
2,430 |
44.9% |
3.9% |
|
two bedroom |
102 |
2,378 |
49.0% |
4.2% |
|
Three bedroom |
150 |
2,177 |
49.0% |
3.6% |
|
Average |
92 |
2,565 |
48.1% |
4.3% |
|
||||
Source: Cytonn Research 2020
Section V: Recommendations and Outlook
Having looked at the factors driving the hospitality industry, and specifically the serviced apartments sector, challenges and the current performance, we now conclude with a recommendation of the investment opportunity and outlook.
|
Serviced Apartments Sector Outlook |
||
|
Measure |
Sentiment |
Outlook |
|
Serviced Apartments Performance |
In 2020, serviced apartments within the NMA recorded an average rental yield of 4.0%, 3.6% points lower than the 7.6% recorded in 2019, this is lower compared to the residential market performance which had an average rental yield of 4.9%, attributable to the adverse effects of the pandemic on the sector. The performance is expected to improve in the long term owing to the reopening of the economy and the post pandemic recovery strategies that have been put in place to cushion the hospitality industry. The sector recovery will be largely supported by government strategies such as the Ministry of Tourism post-corona recovery funds aimed at offering financial aid to hotel and other establishments in the hospitality industry through the Tourism Finance Corporation (TFC), repackaging of the tourism sector products to appeal to domestic tourists, relaxation of travel advisories and reopening of Kenya’s key tourism markets. |
Neutral |
|
International Tourism |
The total number of international arrivals through Jomo Kenyatta International Airport (JKIA) and Moi International Airport (MIA) increased from 13,919 persons in August 2020 to 20,164 persons in September 2020. This is an indication of gradual recovery of the tourism industry which will boost the hospitality sector. The second wave of the pandemic in some markets is however expected to slow down these numbers as people limit their travelling options to avoid the spread of the virus. |
Neutral |
|
MICE Tourism |
Kenya has continued to gain popularity as a MICE hub with, Kenyatta International Conference Centre (KICC) being recognized as Africa’s leading meeting and conference centre (MICE). The performance of the sector has been affected by people shifting towards e-conferencing thus minimizing the need for physical meetings. Some factors that are likely to cushion the performance of Kenya as a preferred MICE hub include calm political environment, aggressive marketing by the Kenyan government and the improving infrastructure. |
Neutral |
|
Supply |
Serviced apartments in the Nairobi Metropolitan Area (NMA) increased by a 6-Year CAGR of 8.6% to 5,594 in 2020, from 3,414 in 2015. We expect the current developments in pipeline to add to the current supply of the sector thus boosting performance through increasing competition especially in areas like Kilimani and Westlands which have majority of serviced apartments within the area. |
Neutral |
Based on the above, all metrics are neutral and thus the overall outlook for the hospitality sector is NEUTRAL. The investment opportunity lies in Westlands and Parklands, and Kilimani which have continued to be the best performing nodes with average rental yields of 6.1% and 4.8%, respectively against a market average of 4.0%.
Disclaimer: The views expressed in this publication are those of the writers where particulars are not warranted. This publication, which is in compliance with Section 2 of the Capital Markets Authority Act Cap 485A, is meant for general information only and is not a warranty, representation, advice or solicitation of any nature. Readers are advised in all circumstances to seek the advice of a registered investment advisor.
- Talk to us
- Kenya
- P.O Box 20695 - 00200, Nairobi, Kenya
- Cell +254(0) 709 101 000
- Tel +254(0) 20 3929 000
- WhatsApp +254(0) 748 070 000
- United States
- +1 (240) 368-6217
- DOWNLOAD OUR APP
-


- Kenya
- Cysuites work spaces, Church Rd, Westlands, Nairobi, Kenya
- USA
- Suite 1150, 1775 Eye Street NW, USA, Washington DC 20006, USA
- Investments
- High Yield
- Private Equity
- Real Estate
- Real Estate
- RiverRun Estates
- Cytonn Towers
- The Ridge
- Taraji Heights
- The Alma